MGH Short Sell - Fade unprofitable CallsThis trade idea is designed to trade against an unprofitable signals group.
Next report date
—
Report period
—
EPS estimate
—
Revenue estimate
—
0.12 EUR
40.17 M EUR
575.27 M EUR
140.96 M
About MAAS Group Holdings Ltd.
Sector
Industry
CEO
Wesley J. Maas
Website
Headquarters
Dubbo
Founded
2019
ISIN
AU0000118564
FIGI
BBG01V3XSBC6
MAAS Group Holdings Ltd. engages in the supply of construction materials and equipment. The firm operates through the following segments: Residential Real Estate; Commercial Real Estate; Civil, Construction & Hire; Manufacturing; Construction Materials; and Other. The Residential Real Estate segment engages in developing, investing, building, and selling residential land and housing. The Commercial Real Estate segment operates through commercial construction, which builds and constructs commercial developments and commercial development & investment, which delivers commercial property and industrial developments, and investing in commercial real estate building products. The Civil, Construction & Hire segment provides services under civil construction that includes civil infrastructure construction, roads, dams, renewables, and mining infrastructure; plant hire and sales for infrastructure and tunnelling projects; and electrical services, such as electrical infrastructure, communications, and machinery sales. The Manufacturing segment deals with manufacturing, sales, and distribution of underground construction and mining equipment and parts. The Construction Materials segment provides quarry materials to construction projects, mobile crushing and screening for quarries, geotechnical services, asphalt services, and quarry excavation services. The Other segment includes head office operations. The company was founded by Wesley J. Maas in 2002 and is headquartered in Dubbo, Australia.
Related stocks
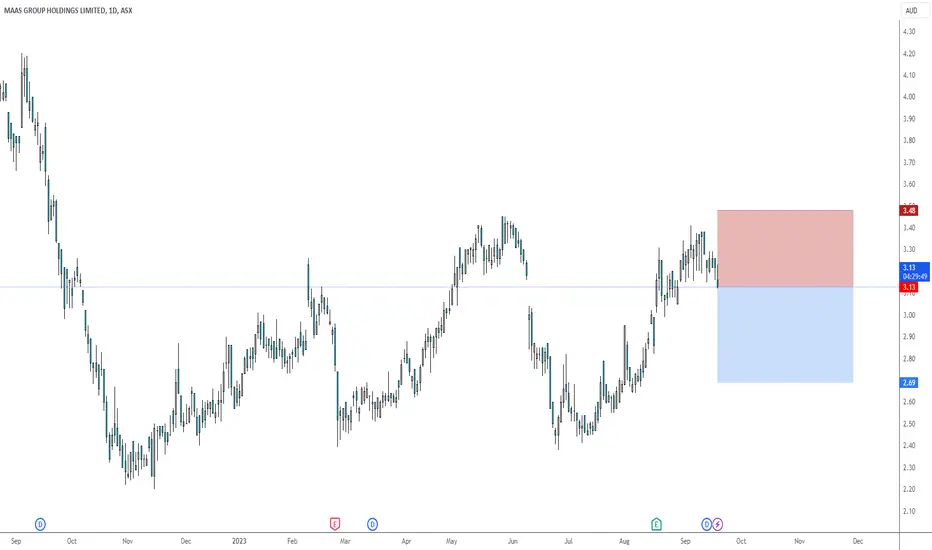
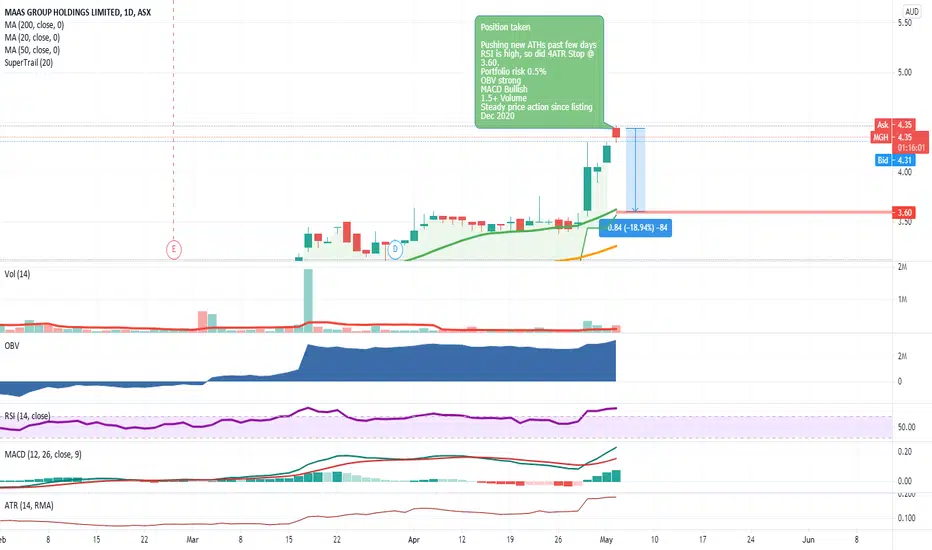
ASX - MGH MAAS Group Holdings at All Time HighsPosition taken
Pushing new ATHs past few days
RSI is high, so did 4ATR Stop @ 3.60.
Portfolio risk 0.5%
OBV strong
MACD Bullish
1.5+ Volume
Steady price action since listing Dec 2020
Will look to build position a few more times before readjusting to Trailing stop.
MAAS Group Holdings Ltd. suppli
See all ideas
Summarizing what the indicators are suggesting.
Neutral
SellBuy
Strong sellStrong buy
Strong sellSellNeutralBuyStrong buy
Neutral
SellBuy
Strong sellStrong buy
Strong sellSellNeutralBuyStrong buy
Neutral
SellBuy
Strong sellStrong buy
Strong sellSellNeutralBuyStrong buy
An aggregate view of professional's ratings.
Neutral
SellBuy
Strong sellStrong buy
Strong sellSellNeutralBuyStrong buy
Neutral
SellBuy
Strong sellStrong buy
Strong sellSellNeutralBuyStrong buy
Neutral
SellBuy
Strong sellStrong buy
Strong sellSellNeutralBuyStrong buy
Frequently Asked Questions
The current price of 766 is 2.46 EUR — it has decreased by −2.38% in the past 24 hours. Watch MAAS Group Holdings Ltd. stock price performance more closely on the chart.
Depending on the exchange, the stock ticker may vary. For instance, on FWB exchange MAAS Group Holdings Ltd. stocks are traded under the ticker 766.
766 stock has fallen by −2.38% compared to the previous week, the month change is a 2.50% rise, over the last year MAAS Group Holdings Ltd. has showed a −0.89% decrease.
We've gathered analysts' opinions on MAAS Group Holdings Ltd. future price: according to them, 766 price has a max estimate of 3.05 EUR and a min estimate of 2.65 EUR. Watch 766 chart and read a more detailed MAAS Group Holdings Ltd. stock forecast: see what analysts think of MAAS Group Holdings Ltd. and suggest that you do with its stocks.
766 stock is 2.44% volatile and has beta coefficient of 1.08. Track MAAS Group Holdings Ltd. stock price on the chart and check out the list of the most volatile stocks — is MAAS Group Holdings Ltd. there?
Today MAAS Group Holdings Ltd. has the market capitalization of 918.51 M, it has increased by 1.24% over the last week.
Yes, you can track MAAS Group Holdings Ltd. financials in yearly and quarterly reports right on TradingView.
MAAS Group Holdings Ltd. is going to release the next earnings report on Feb 19, 2026. Keep track of upcoming events with our Earnings Calendar.
766 earnings for the last half-year are 0.07 EUR per share, whereas the estimation was 0.08 EUR, resulting in a −7.80% surprise. The estimated earnings for the next half-year are 0.07 EUR per share. See more details about MAAS Group Holdings Ltd. earnings.
MAAS Group Holdings Ltd. revenue for the last half-year amounts to 292.51 M EUR, despite the estimated figure of 306.46 M EUR. In the next half-year revenue is expected to reach 314.75 M EUR.
766 net income for the last half-year is 22.68 M EUR, while the previous report showed 18.72 M EUR of net income which accounts for 21.17% change. Track more MAAS Group Holdings Ltd. financial stats to get the full picture.
MAAS Group Holdings Ltd. dividend yield was 1.65% in 2025, and payout ratio reached 33.64%. The year before the numbers were 1.54% and 29.17% correspondingly. See high-dividend stocks and find more opportunities for your portfolio.
As of Sep 10, 2025, the company has 2.3 K employees. See our rating of the largest employees — is MAAS Group Holdings Ltd. on this list?
EBITDA measures a company's operating performance, its growth signifies an improvement in the efficiency of a company. MAAS Group Holdings Ltd. EBITDA is 93.00 M EUR, and current EBITDA margin is 16.01%. See more stats in MAAS Group Holdings Ltd. financial statements.
Like other stocks, 766 shares are traded on stock exchanges, e.g. Nasdaq, Nyse, Euronext, and the easiest way to buy them is through an online stock broker. To do this, you need to open an account and follow a broker's procedures, then start trading. You can trade MAAS Group Holdings Ltd. stock right from TradingView charts — choose your broker and connect to your account.