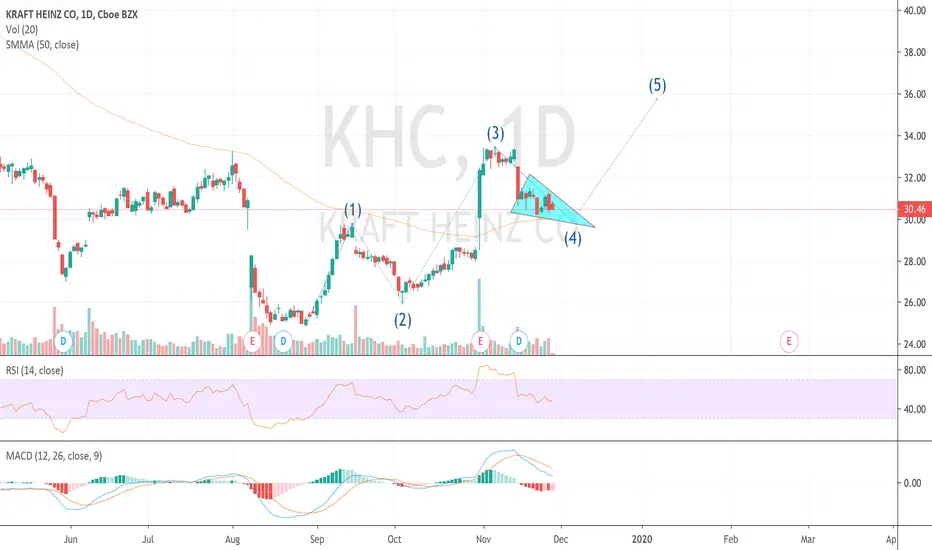
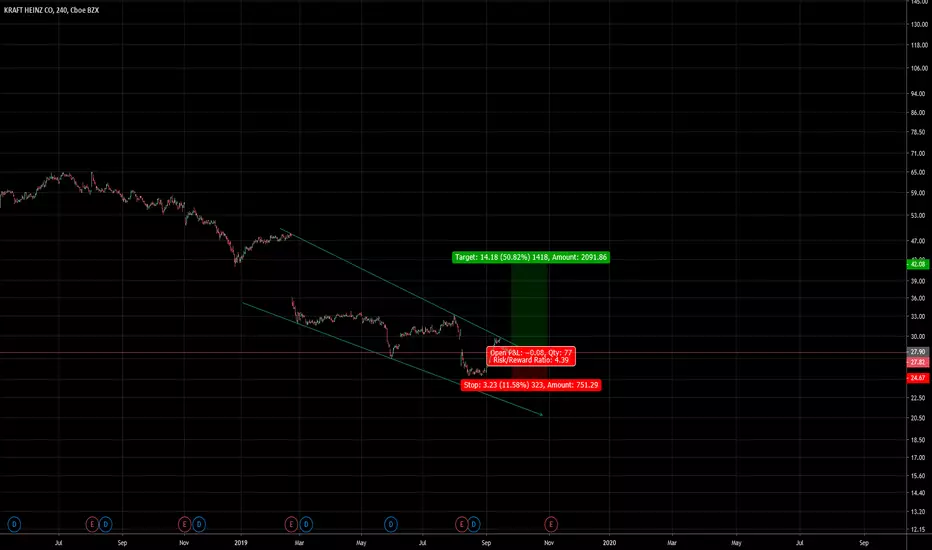
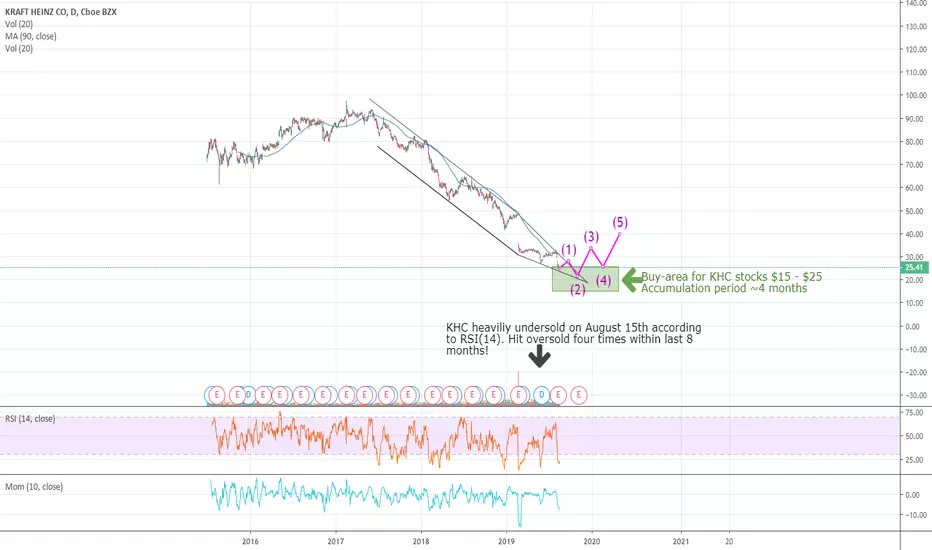
KHC - Potential 5th Wave Long Swing Trading OpportunityUsing our Elliott Wave Indicator Suite for the TradingView Platform we have identified a potential Long 5th Wave Swing Trading Opportunity for KHC on the Daily time frame . The 5th wave move in an elliottwave sequence is the highest probability move.
The wave 4 pull back has found support in the Amber zone of our probability pullback zones, which represents an 80% probability that our automated 5th wave target zone, in blue on the chart, will be hit.
We see yellow dots formed in the overbought zone on our special False Breakout Stochastic indicator, which signals strong Bullish momentum. When, during a wave 4 pullback, the stochastic pulls back against these false break out dots and crosses in the oversold zone, there is a high probability the stocks price action will resume the overall bullish trend .
We also measure the wave 4 behaviour with our Elliottwave oscillator, which has pulled back within our pre-determined zone.
So overall we have identified, using our Elliott Wave Indicator suite for TradingView, a high probability long swing trading opportunity for KHC , Daily Time Frame , with the following entry strategy:
Long entry through $31.63
Stop Loss $29.98
Target $34.50
Giving a Risk to Reward of 1:1.6
Learn more about our Tradingview indicator suites by watching the video tours >>HERE<<
KHNZ trade ideas

KHC Reversal?Christmas shopping might just be around the corner, waiting to see conformation will probably be a longer waiting game for this one. 180 EMA is looking better but we'll have to stay and see where this goes, dividend is good. Keeping on eye on this for now, bullish so far based on what it's show the past 3 months
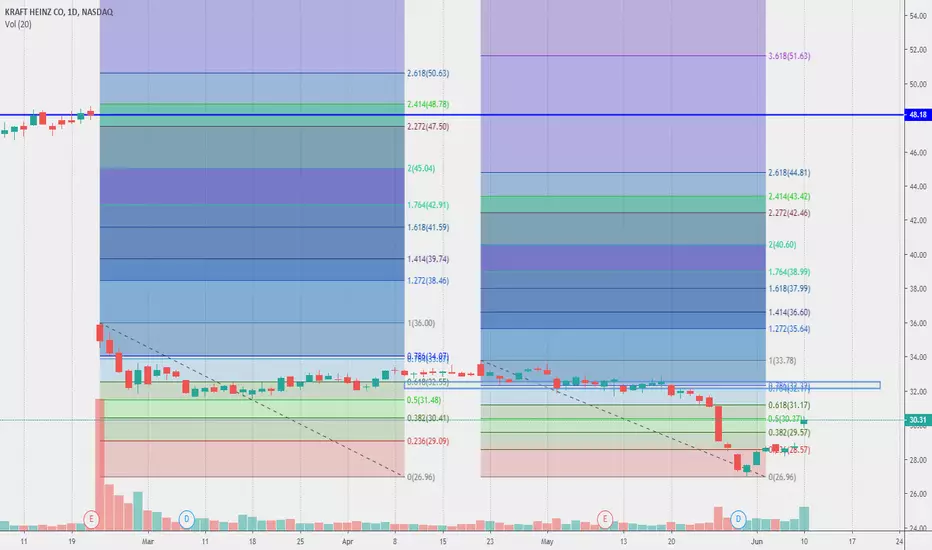
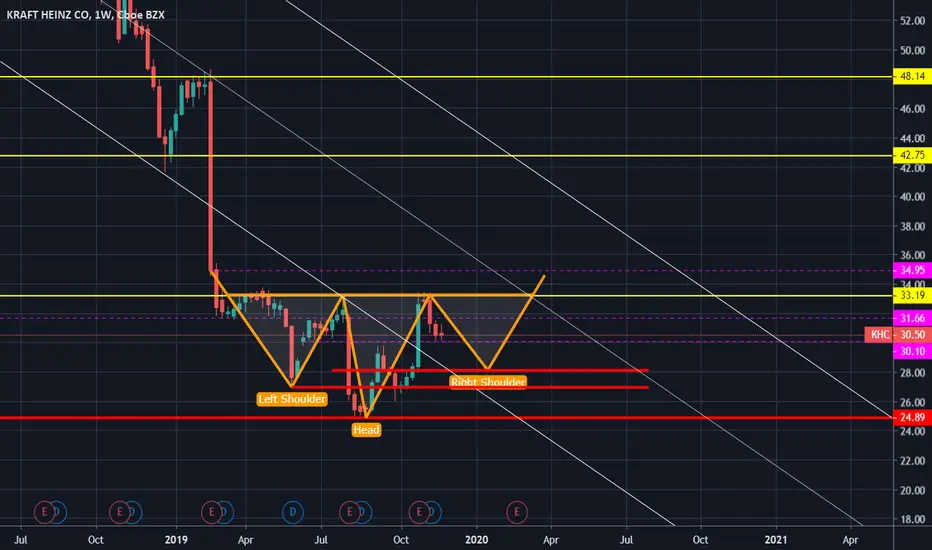
H&S time for reverseSeem that KRAFT after the huge drop, in the chart is forming an interesting Head and Shoulder pattern and so a reversal in trend, let see what will happen in these coming weeks
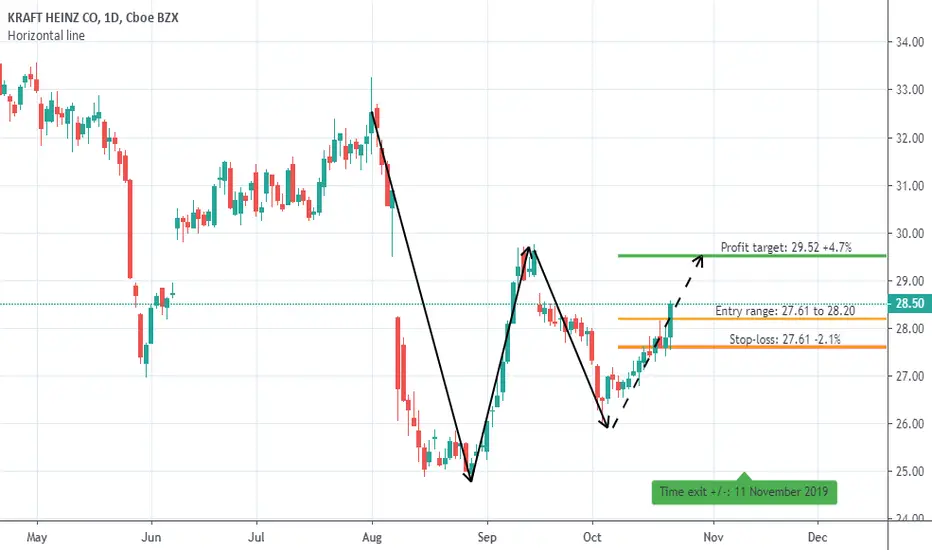
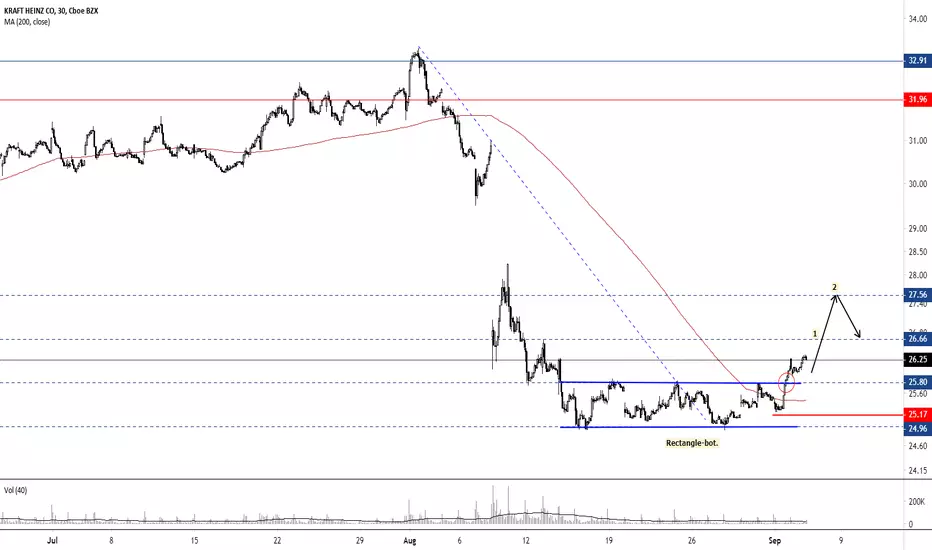
KHC to 35$ by end of JanuaryClassic wave analysis setup:
- Wave 3 with increasing volume
- Wave 4 triangle consolidation (Place stop below wave 1 peak). Great Buy of KHC at 29.80-30.20
- Wave 5 will be a slow melt up
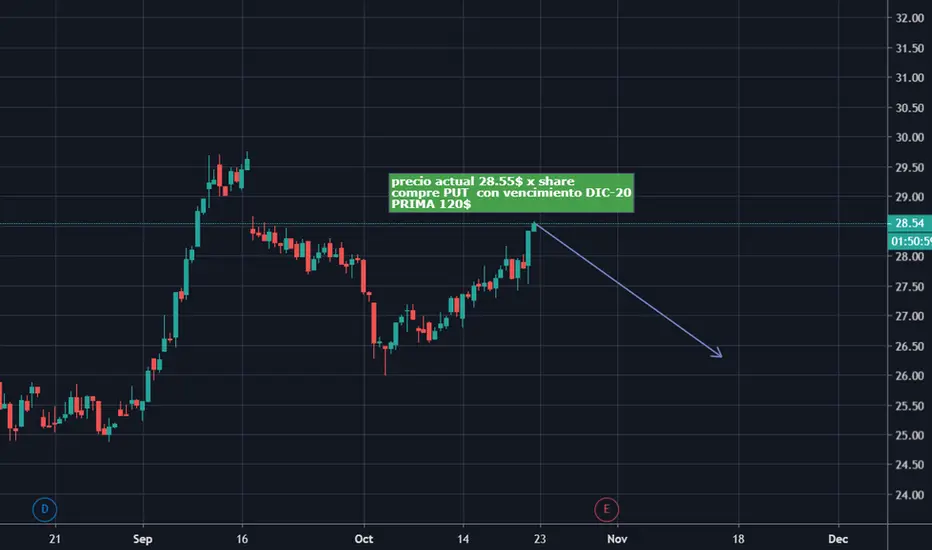
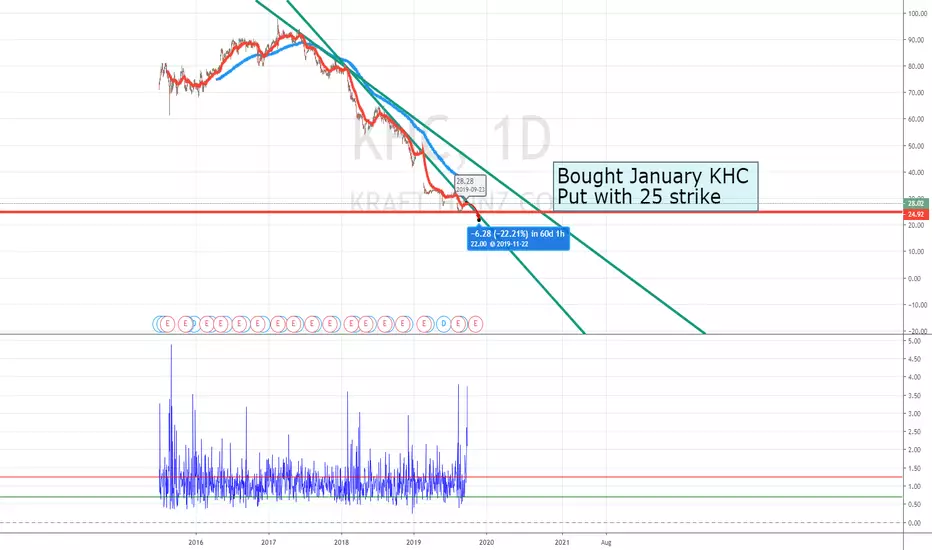
precio actual 28.55$ x share compre PUT con vencimiento DIC-20 precio actual 28.55$ x share
compre PUT con vencimiento DIC-20
PRIMA 120$

KHZ: will the W-bottom pattern increase in strength?Risky trade.
Typical W-bottom pattern is busy unfolding.
Might developed into a stronger pattern.

The short term market consensus for Kraft Heinz Co(KHC)
The short term market consensus for Kraft Heinz Co(KHC) have change to Bullish as at October 17,2019
We will execute the following trade:
Global Entry Signal: Buy @ $27.77
Global Stop Loss:@ $25.58
Global Target Profit:@ $33.84
Global Trade Management Strategy: We will applied the Global Trailing Stop System for Global Trading Strategy #4
Trading is risky
There is a substantial risk of loss in futures and forex trading. Online trading of stocks and options is extremely risky. Assume you will lose money. Don't trade with money you cannot afford to lose.


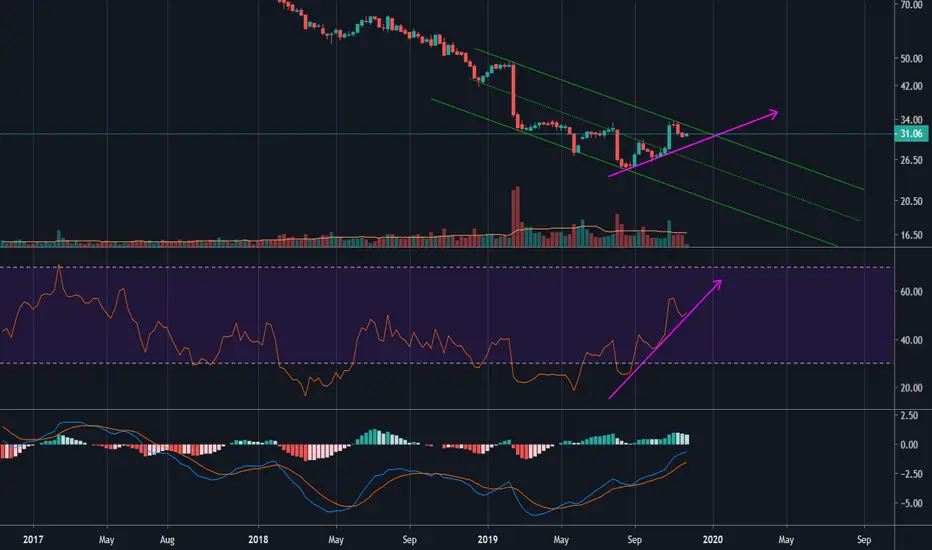
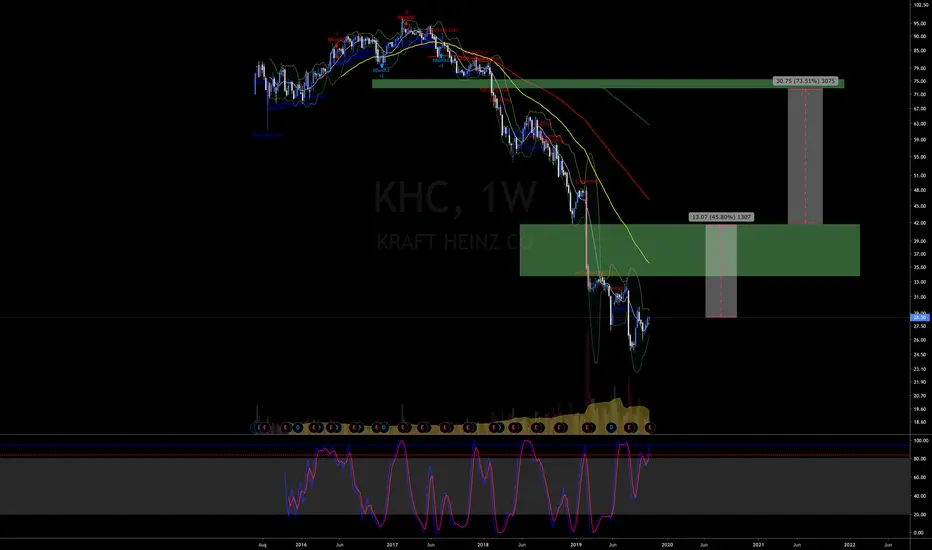
Short KHC KHC has been trending down since 2017, 25 is the next relevant area of support if broken 20 is the next area of support.
KHCKHC’s innovation outlook is neutral based on a current score of 34 out of 99, underperforming sector average. Jobs growth over the past year has decreased and insiders sentiment is neutral. KHC is an Average Performer in terms of sustainability. It is most exposed to Mondelez International, Inc. as its supplier. Over the past 4 quarters KHC beat earnings estimates 2 times and it pays dividend higher than its peers.
For more analysis and articles visit our website .


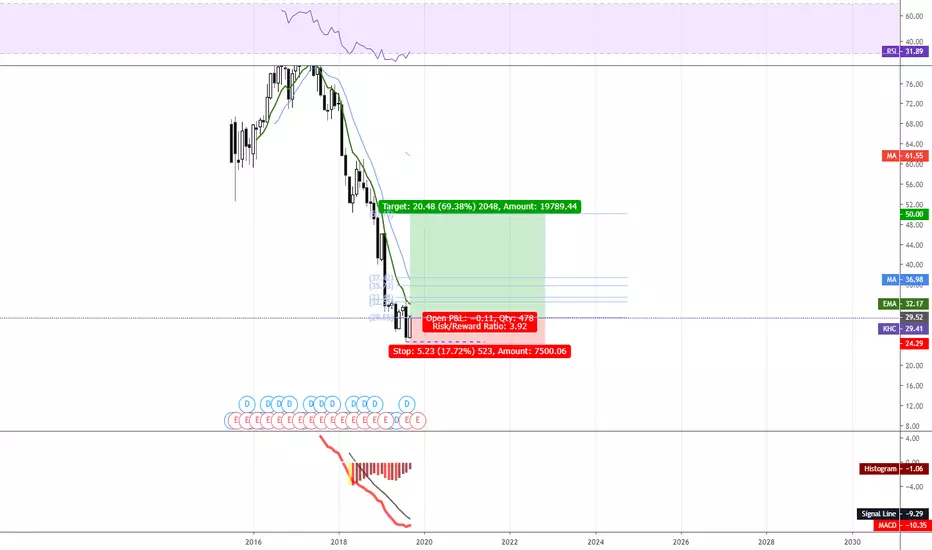
Risky: Kraft Heinz Company accumulation phase $15 - $25KHC is not looking good from a technical point of view and it's fundamentals are also not as strong as perceived before. Still the company owns some well performing brands which might pick up again in retail. For now, the stock is mostly out of favor. Annual Report 2018 suggests a healthy financial position, but with tremendous losses last year. The losses combined seemed partially to be caused by external factors and bad luck. The company might be able to restore trust comming year. With in mind its 30 billion USD market capitalization it won't hurt to pick up some KHC stocks between $15 and $25. If the company is able to reduce it's losses and phase out non-performing brands it might start to climb back to $48 within three years.
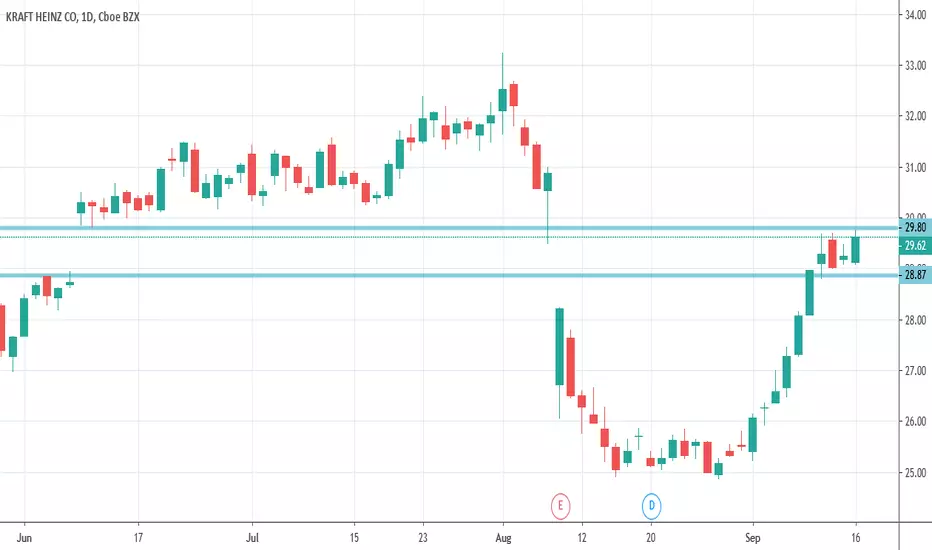
KHC - Found Support & Accumulating Hi friends, It has been a long time I haven't updated KHC idea. Since that time price action printed several signs of bottoming process is taking place. I have shown them on the chart. As mentioned in previous idea the day price opened with 30% gap down a big buyer (could be Warren Buffet ;) ) showed up and absorbed all the panic selling. It was a first and immediate sign beginning of accumulation process. Since then price hasn't moved higher but consolidated for significant time.
Subsequent drop in price after accumulation and return with gap up is our second sign of bottoming process is real and in progress. It gave up a range of accumulation $27-$31.50. I believe price will keep accumulating within that range until it breaks up.
The worst case scenario is double bottom pattern.
The best case scenario is upward gap will be tested and holds without being broken down.
Any purchase within this range will be good for investment. Obviously try to get the lowest entry possible within this range. Good strategy is as usual split your entries into at least 5 and slowly scale in.
Good Luck!

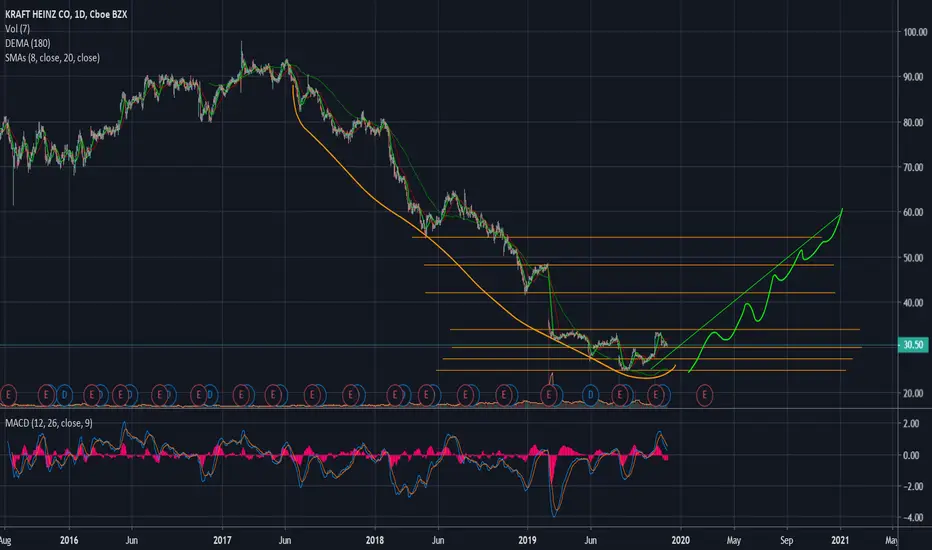
KHC - Where do we go from here?There's a monster gap to fill above blue sky here. 60% up? Or, if you believe in Fibs, 1.618 of $30, today's price range. Any buyers, besides the strange CALL interest around 31-32? Makes me wonder.
Jun 14, 2019 0.16 0.13 0.15 0.20 1290 300 KHC 31
Jun 14, 2019 0.09 -0.01 0.05 0.10 639 490 KHC 31.5
Jun 14, 2019 0.05 0.10 688 600 KHC 32