Trading at the Market OpenTrading at the Market Open
The market open marks a critical juncture in the financial world, presenting a unique blend of opportunities and challenges for traders. This article explores the essence of trading at the open across stocks, forex, and commodities. It delves into the heightened volatility and liquidity characteristic of this period, offering insights and strategies to navigate these early market hours effectively, setting the stage for trading opportunities.
What Does the Open Mean in Stocks, Forex, and Commodities?
The open signifies the start of the trading day for various financial markets. It's a time when trading activity surges, marked by a rush of orders that have accumulated since the previous close. In stock markets, this includes shares, indices, and Exchange-Traded Funds (ETFs). The influx of orders often leads to significant price movements as the market absorbs overnight news and global economic developments.
For forex and commodity markets, the open can vary by region, reflecting their 24-hour nature. This period is crucial for setting the tone of the trading day, offering insights into sentiment and potential trends. Traders closely watch the market open to gauge the strength of these movements, which can indicate broader market trends or sector-specific shifts.
Volatility and Liquidity at Market Open
Trading at the open is often marked by enhanced volatility and liquidity. Heightened volatility is primarily due to the influx of orders accumulated overnight, reacting to various global events and news. As traders and investors assimilate this information, rapid price movements are common, especially in the first few minutes of the session. These price fluctuations can present both opportunities and risks for traders.
Increased liquidity, which refers to the ease with which assets can be bought or sold without causing significant price movements, is also a characteristic of the open. A higher number of market participants during this period may result in better order execution and tighter bid-ask spreads, particularly in highly liquid markets like forex and major stock indices.
What to Know Before the Market Opens
In terms of things to know before the stock market opens, it's essential to review the overnight and early morning news that can affect stocks. This includes company earnings reports, economic data releases, and geopolitical events. Traders also check pre-market trading activity to gauge sentiment and potential opening price movements.
For forex and commodities, understanding global events is crucial. Developments in different time zones, like policy changes by central banks or shifts in political scenarios, can significantly impact these markets. Additionally, reviewing the performance of international markets can provide insights, as they often influence the US open.
It's also vital to analyse futures markets, as they can indicate how stock indices might open. Lastly, around the forex, commodity, and stock market openings, indicators and other technical analysis tools applied to the previous day can also offer valuable context for the day ahead.
Market Open in Different Time Zones
Market open times vary globally due to different time zones, significantly impacting trading strategies. For instance, the New York Stock Exchange (NYSE) opens at 9:30 AM Eastern Time, which corresponds to different times in other parts of the world. For traders in London, this translates to an afternoon session, while for those in Asian markets like Tokyo, it's late evening.
Forex, operating 24 hours a day during weekdays, see overlapping sessions across different regions. For example, when the Asian trading session is concluding, the European session begins and later overlaps with the North American session. Such global interconnectivity ensures that forex markets are active round the clock, offering continuous trading opportunities but also requiring traders to be mindful of time zone differences and their impact on liquidity and volatility.
Strategies for Trading at Market Open
Trading at market open requires strategies that can handle rapid price movements across all markets. Here are some effective approaches:
- Pay Attention to Pre-Market Trends: This helps traders assess how a stock might behave at the market open. If a stock is fading from post-market highs, it might be wise to wait for a trend change before entering.
- Gap and Go Strategy: This involves focusing on stocks that gap up on positive news at market open, an indicator of potential further bullishness. Traders look for high relative volume in pre-market and enter trades on a break of pre-market highs. This strategy is fast-paced and requires quick decision-making.
- Opening Range Breakout (ORB): The ORB strategy uses the early trading range (high and low) to set entry points for breakout trades across all types of assets. The breakout from this range, typically the first 30 to 60 minutes of the session, often indicates the price direction for the rest of the session. Time frames like 5-minute, 15-minute, and 30-minute are commonly used for ORB.
- Gap Reversal: The gap reversal method is used when the price creates a gap, but then the range breaks in the opposite direction. If the gap is bullish and the price breaks the lower level of the opening range, it signals a gap reversal. The same concept applies to bearish gaps but in reverse.
The Bottom Line
In essence, understanding unique features of market open trading is vital for those participating in stock, forex, and commodity markets. The opening moments are characterised by heightened volatility and liquidity, driven by global events and sentiment. However, savvy traders may capitalise on these early market dynamics with effective strategies.
This article represents the opinion of the Companies operating under the FXOpen brand only. It is not to be construed as an offer, solicitation, or recommendation with respect to products and services provided by the Companies operating under the FXOpen brand, nor is it to be considered financial advice.
MSF trade ideas
Microsoft - This might be the ultimate breakout!Microsoft - NASDAQ:MSFT - will break the all time high:
(click chart above to see the in depth analysis👆🏻)
If you wonder why Microsoft has been rallying +15% this month, market structure will give you an answer. In fact, the recent bullish break and retest was totally expected, and if we take into account the recent quite strong bullish behaviour, an all time high breakout will follow soon.
Levels to watch: $450
Keep your long term vision!
Philip (BasicTrading)

MSFT Weekly Options Play – 2025-06-09🧾 MSFT Weekly Options Play – 2025-06-09
Bias: Moderately Bearish
Timeframe: 5–6 days
Catalysts: Overbought RSI, weakening momentum, technical divergences
Trade Type: Single-leg put option
🧠 Model Summary Table
Model Direction Strike Entry Price Target Stop Loss Confidence
Grok Bearish 457.50P $0.76 $1.14 $0.19 65%
Claude Bearish 460.00P $1.03 $1.55 $0.72 70%
Gemini Bearish 457.50P $0.75 $1.20 $0.38 65%
DeepSeek Bearish 470.00P $3.65 $5.48 $2.56 70%
Llama Slightly Bullish 472.50C $3.15 $3.78 $2.83 68%
✅ Consensus: Short-term bearish trade setup
📉 Core Setup: Reversal from overbought with MACD divergence
⚠️ Outlier: Llama prefers bullish call due to longer-term trend strength
🔍 Technical & Sentiment Recap
Trend: Overextended rally, RSI (78.2) = overbought
Momentum: MACD shows bearish divergence on daily; 5-min weak
Sentiment: VIX ~16.7 = stable but cautious; mixed AI news & max pain at $460
Max Pain: $460 implies gravitational pull; current price may pull back
Volatility: Option premiums reflect narrow range, but directional edge favors downside
✅ Final Trade Recommendation
Parameter Value
Instrument MSFT
Strategy Single-leg PUT (weekly)
Strike $457.50
Entry Price $0.76 (ask)
Profit Target $1.22 (~60% gain)
Stop-Loss $0.38 (50% premium loss)
Size 1 contract
Entry Timing At market open
Confidence 65%
🎯 Rationale: Near-term exhaustion of upside, short-term technical reversal, and profit-taking setup with favorable risk/reward.
⚠️ Risk Checklist
Strong trend continuation could invalidate pullback thesis
Low VIX may reduce option gamma/velocity
Sector-wide positive catalyst (AI or rate cuts) can cause rapid rebound
Watch for closes above 10-EMA (~$461) to exit early if invalidated
📊 TRADE DETAILS SNAPSHOT
🎯 Instrument: MSFT
🔀 Direction: PUT (SHORT)
🎯 Strike: 457.50
💵 Entry Price: 0.76
🎯 Profit Target: 1.22
🛑 Stop Loss: 0.38
📅 Expiry: 2025-06-13
📏 Size: 1 contract
📈 Confidence: 65%
⏰ Entry Timing: open
🕒 Signal Time: 2025-06-09 01:44:06 EDT
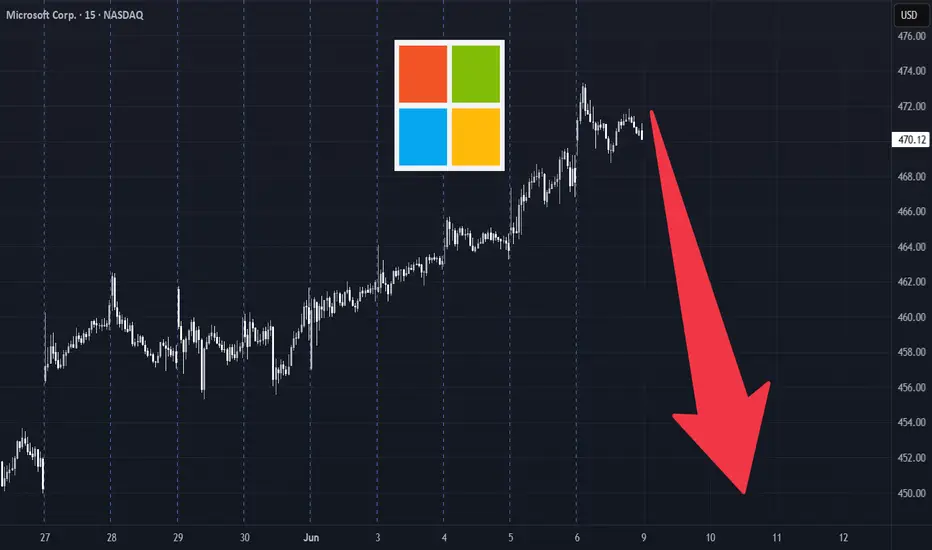
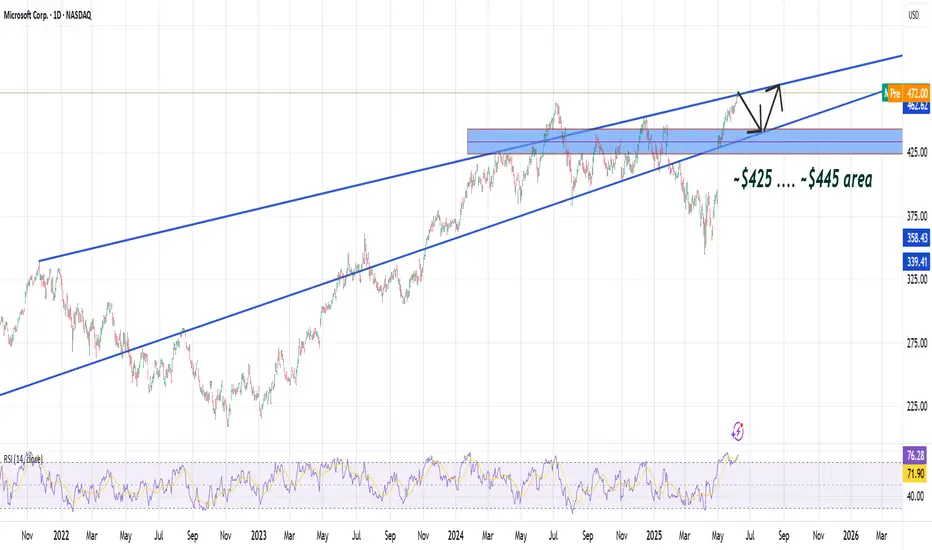
MSFT next target is $500 but....
#MSFT is currently in #overbought territory, which may cause the price to #temporarily decline to the $425–$445 range.
The chart indicates the price is moving between two #inner trendlines.
However, MSFT has broken out of the bearish trend ( ran out of the fear), with the next potential targets at $500 and, later, $600.
Looking to take profits on Microsoft that's severely overboughtThis summer most stocks will lose their momentum making it a great time to take profits. We got into NASDAQ:MSFT at an average of $$350-375, it's time to sell at least half to 75% of the stack then buy back around the 0.618 golden fibonacci at $400 after the gap is filled.
$MSFT Setup – Breakout Momentum with AI & Cloud StrengthMicrosoft NASDAQ:MSFT continues breakout above $474 with AI leadership and cloud dominance. Predicted range: $473.91–$485.18. Model Grade: B. Trend: +0.73%. NASDAQ:MSFT
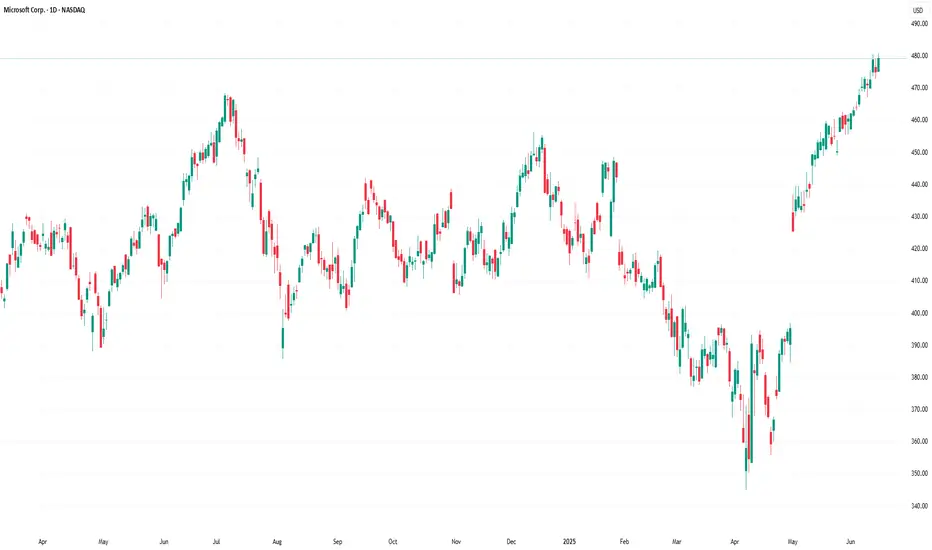
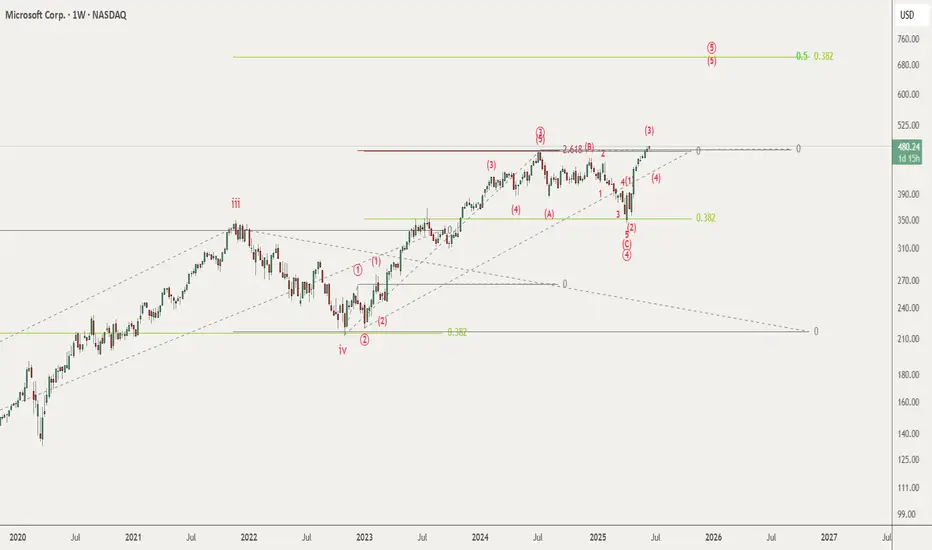
MSFT Surges to Record High, Sustaining Bullish MomentumMicrosoft (MSFT) has demonstrated remarkable resilience, fully recovering from losses incurred during the tariff war sell-off. The stock has even achieved a new all-time high. This performance underscores the stock’s persistent bullish trend. The low recorded on April 7, 2025 likely serves as a robust support level during future pullbacks. The rally from this low is unfolding as a classic five-wave impulse pattern, indicative of strong upward momentum, with wave (3) nearing completion.
From the April 7 low, wave (1) concluded at 394.65, followed by a pullback in wave (2) that bottomed at 355.67. Wave (3) has since extended higher, exhibiting its own internal impulse structure. Within wave (3), wave 1 peaked at 380.39, with wave 2 dipping to 375.19. The stock then surged in wave 3 to 459.58, followed by a wave 4 retracement ending at 448.91. A detailed 45-minute chart below highlights the final leg wave 5, which further subdivides into a lesser-degree impulse. From wave 4, wave ((i)) reached 463 and wave ((ii)) corrected to 454. Wave ((iii)) climbed to 473.43, and wave ((iv)) dipped to 466.96.
MSFT may experience a slight further upside to complete wave ((v)) of 5 of (3). However, a larger-degree pullback in wave (4) is anticipated soon, setting the stage for one final upward push to conclude the five-wave rally from the April 7 low. This structured advance reinforces Microsoft’s bullish outlook, with key support levels likely to hold firm.

$MSFT Getting HighNASDAQ:MSFT is getting to a price where its a good idea to start trimming and/or taking profits as we should always have a plan before trading. Happy Friday
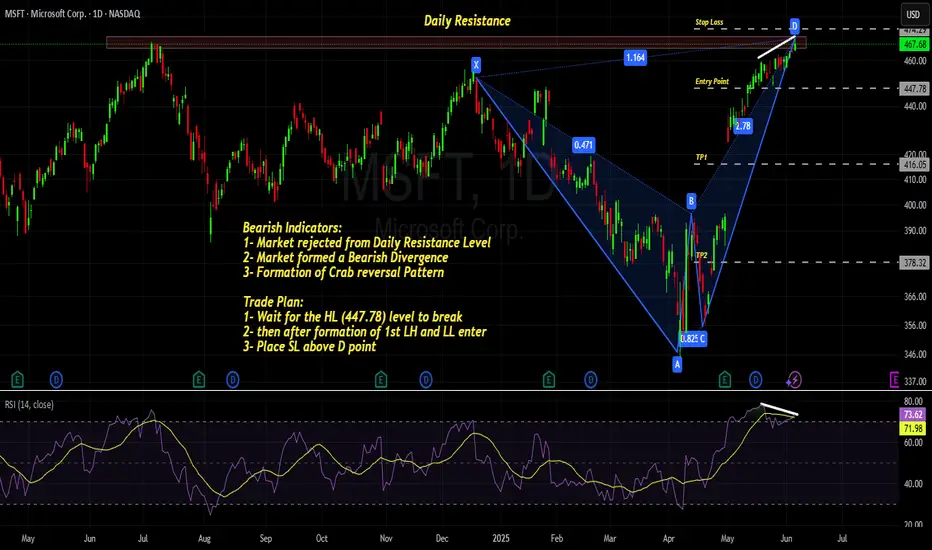
MICROSOFT - Simple Analysis WIN ! Its Bearish Ahead ! MAGIC Microsoft - Lets explore the magic of Technical Analysis / Price action.
Microsoft is currently testing the daily resistance level and it will be more matured once the bearish candle / rejection candle is formed. We see a bearish divergence at this level which is a strong confluence for the bearish trend a head.
forgot to mention, a perfect bookish - Bearish Crab pattern is forming, which is a forming a Potential Reversal Zone (PRZ).
we expect our entry after confirmation on the break of HL - 447 level and then we can plan our TPs accordingly.
Please like and comment!
MSFT - 4th wave correction due then 5th wave to follow?One of the few charts that offers an 'easier' Elliott Wave count for US equities in the present market. This count suggests that we are presently in wave 3 of a 5th of a 5th wave (if that makes sense) and could be due a 4th wave correction any time soon. This count would also expect a shallow 4th wave correction due to wave 2 being deep before continuing higher to complete wave 5.
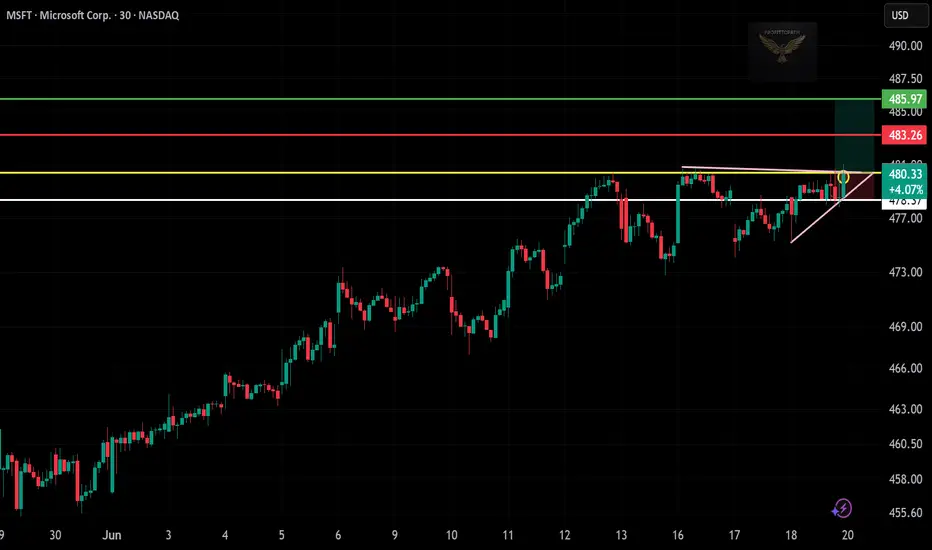
MSFT – Long Trade Setup (30m Chart)!📈
📍 Entry: $480.33 (Breakout above consolidation + trendline)
🛑 Stop-Loss: $483.26 (Below minor resistance zone)
🎯 Target: $485.97 (Next resistance)
🎬
📈 Microsoft breaking out of resistance zone
📍 Entry confirmed after long range
🎯 Targeting $485.97 next resistance
🛡️ Clean setup, low-risk trade idea
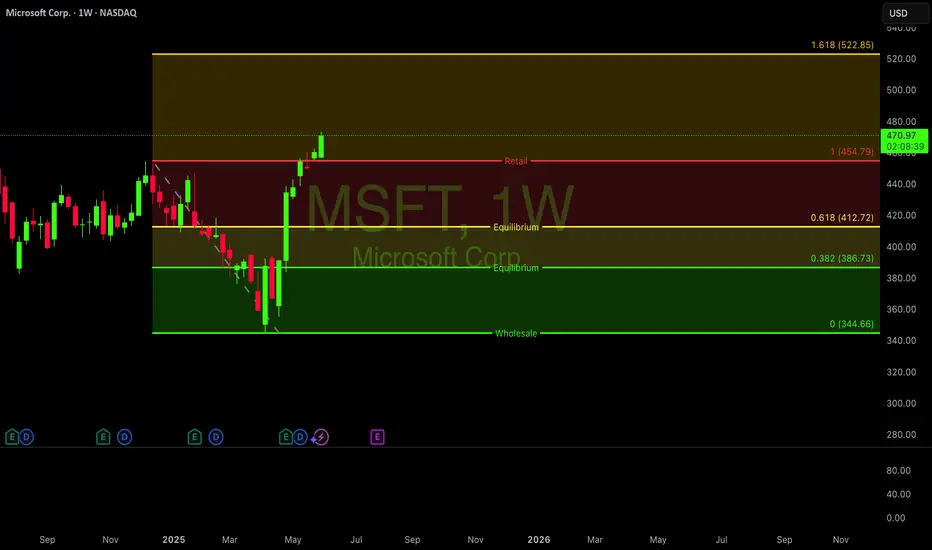
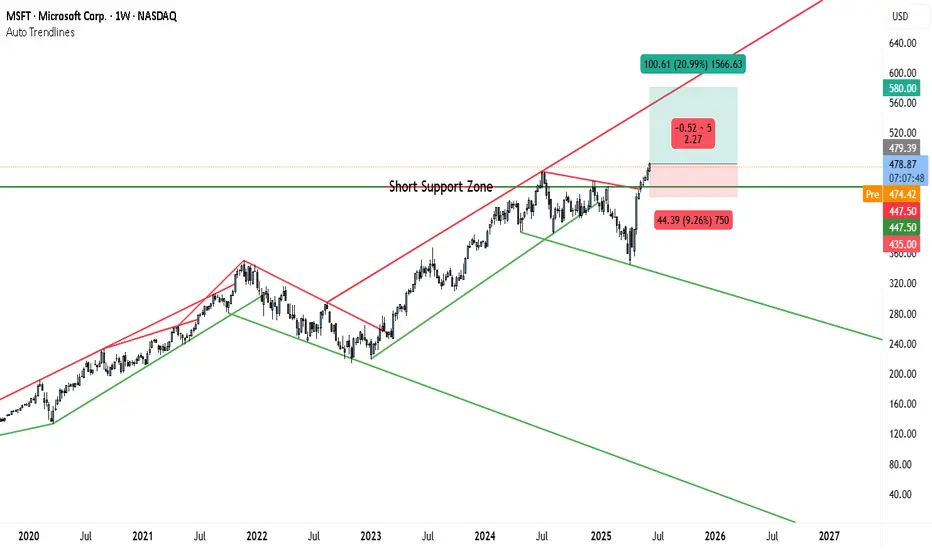
MSFT Weekly Chart Signals a $100 Move — Don’t Miss This BreakoutMicrosoft continues to show strong bullish behavior on the weekly chart. Historically, the stock has respected a well-defined upward channel, and the recent price action has further reinforced this trend. Notably, MSFT has broken through a key resistance level that had previously capped its upside for months. This breakout is significant as it suggests a shift in market structure, from consolidation to a potential new leg up.
The breakout area around $474–$479 has now turned into a short-term support zone. This region will play a critical role in maintaining bullish sentiment; any successful retest that holds above this zone confirms strength and invites further accumulation. The chart highlights a projected move toward $580, which lies near the upper red trendline—this aligns well with the historical resistance trajectory.
A bullish trade setup can be considered from the current levels around $478, with a stop-loss just below the $447–$435 zone. This range marks a previous congestion area and aligns with the lower side of the risk-reward box illustrated on the chart. The potential upside move is about 20.99%, offering a solid risk-reward ratio of approximately 2.27, assuming the price continues to hold above the breakout level.
While the trend remains firmly bullish, a weekly close below $447.50 would warrant caution. It could indicate a deeper retracement, potentially back into the broader green trend channel extending toward $400 or below. However, current momentum favors continuation to the upside, especially after clearing such a pivotal resistance.
In conclusion, Microsoft’s long-term chart structure, combined with the recent breakout and favorable price action, supports a bullish outlook. If price action remains above $474–$479, the stock is well-positioned to challenge the $580 resistance level in the coming weeks.
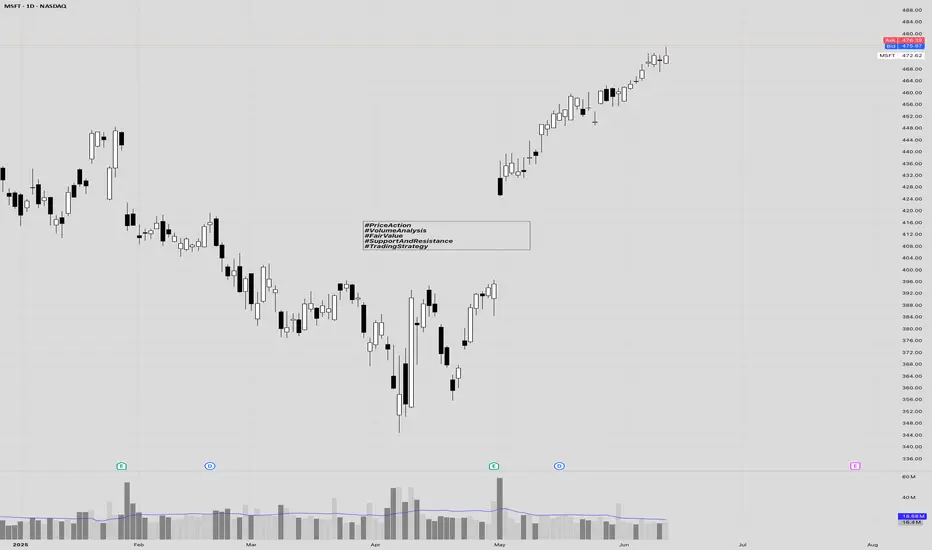
Understanding Time-Based vs. Volume-Based Stock Price Levels. P1Understanding Time-Based vs. Volume-Based Stock Price Levels
Key Concepts:
Time-Based Price Level
Definition: The duration a stock spends at a specific price.
Example: A stock trades at $50 for 2 hours but with only 100 volume .
Significance: The market accepts $50 as fair value because it spends more time there. Moves away are slower.
Volume-Based Price Level
Definition: The amount of shares traded at a specific price.
Example: A stock trades at $40 for 5 minutes but with 200 volume .
Significance: $40 may be a discounted price or manipulation , depending on history.
Interpreting the Levels:
1. Fair Value (Time-Based)
Prolonged time at a price (e.g., $50) = Market consensus on fair value.
Low volume + high time = Stability; reversals are gradual.
2. Discounted Price (Volume-Based)
High volume + short time = Potential discount if the price was a previous fair value .
✅ Confirmed Discount:
Example: Milk historically fair at $1 → Drops to $1 (high volume) → Rebounds to $2.
Traders recognize the discount, leading to rapid buying.
❌ Manipulation/Fakeout:
Example: Price drops to $0.15 (no history) → High volume but weak rebound.
3. Manipulation/Fake-Out
High volume at new/unfamiliar levels (e.g., $0.15) lacks conviction.
Practical Takeaways:
Prioritize Historical Context:
High volume + past fair value = Strong signal (e.g., $1 → $2).
Speed of Moves:
Discounted prices ($1) → Fast, high-volume rallies.
Combine Time & Volume:
Fair value = Time > Volume.
Discounts = Volume > Time.
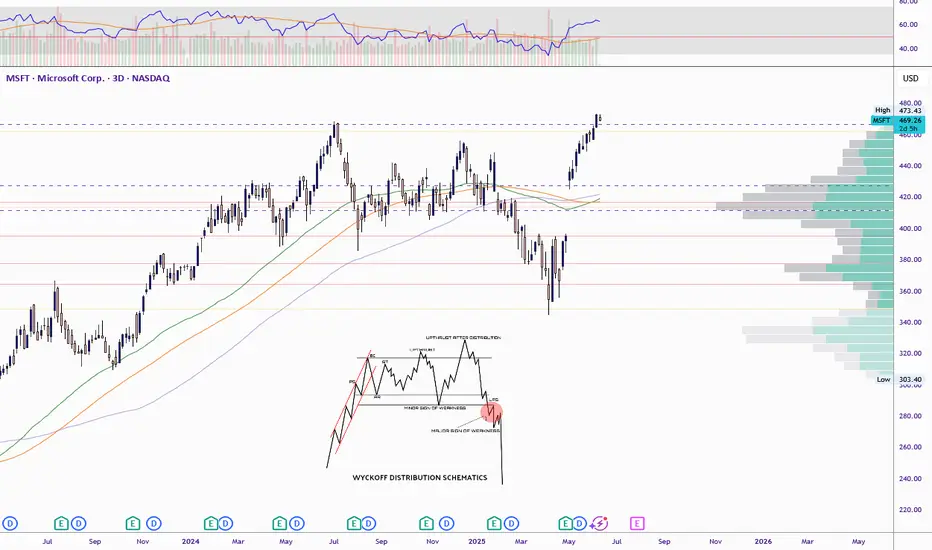
MSFT 3d, Q2 2025 Microsoft painting a pattern that looks like a wyckoff distribution. Not 100%, but want to publish to keep an eye on it.
MSFT weekly cup and handleMSFT staying strong during all of the volatility and chop shows relative strength would like to see the market push to all time highs with MSFT and some other mega caps leading the way this could pan out in time and looks like a great set up to test the highs reset and push higher. Not financial advice

MSFT Pushes Into New Highs With Quiet StrengthMicrosoft ( NASDAQ:MSFT ) is breaking into all-time highs with tight, steady movement up the right side of the base. What stands out is how well it’s held up — even with recent market chop, there’s been no giveback, just clean progression.
This kind of action tends to reflect confident buying behind the scenes — no big spikes, just quiet control. The stock is firmly above all major moving averages and has been coiling near the highs without breaking structure.
From a fundamental angle, MSFT continues to impress:
AI dominance via Azure + OpenAI
Strong cloud growth and margin expansion
Reliable EPS growth, quarter after quarter
One of the few mega caps leading, not lagging, right now
Whether you’re tracking leadership, strength under pressure, or clean chart structure, it’s all lining up here.
Trade Setup:
📈 Entry: 464.80 – 478.68
🛑 Stop: 441.30 – 432.17
🎯 Target: 529.76 – 557.68
Will be watching for continuation through highs — or possibly a tight flag that gives a second entry window. In a market with fewer names standing tall, MSFT is acting like a leader.

MSFT Holding Highs. Gamma & Structure Say Rejection Risk is Real🔍 MSFT GEX Daily Overview (Options Sentiment Breakdown)
Microsoft ( NASDAQ:MSFT ) closed at $460.36, right inside a tight zone between heavy call resistance at 462.5–465 and a weakening support floor at 450. The stock has been on a strong run, but we’re now entering a dealer-dense gamma zone — which often creates price suppression or whipsaws.
GEX Sentiment Insights:
* 🟩 Call Walls stacked at 462.5 → 465 → 470, with major gamma hedging expected.
* 🟥 Moderate Put Wall @ 450 (–18.48%), with further protection near 447.5 HVL.
* ❄️ IVR at 7.1 → dirt cheap premiums = great for debit spreads or directional plays.
💡 Options Play (GEX Bias):
* Bullish Scenario: Break above 465, consider Jul 19 470c or 465c/475c spread — targeting 470–475 before next gamma wall.
* Bearish Scenario: If price loses 458, ride short to 450 with Jul 19 455p/445p vertical spread or naked 455p if volume confirms.
Gamma flip zone is tight. Bulls need momentum + volume to break through. Otherwise, dealer hedging could pin MSFT here all week.
📉 MSFT 1-Hour Price Structure (Swing/Intraday Gameplan)
On the hourly, MSFT is in a rising wedge structure, testing overhead supply around 463–468, while forming lower highs and building distribution signals.
Key Observations:
* 🔻 Price failed to hold above BOS zone near 463.
* 📦 Sitting inside CHoCH supply (red box), multiple rejection candles printing.
* ⚠️ Overbought readings across BBP & DPR (98%+), MACD softening — potential for pullback.
📈 Swing Trade Setup:
* Bullish: Only get long if MSFT reclaims and bases above 465. Target: 470–475. Stop: below 460.
* Bearish: Break below 458 = clean swing short toward 450–447.5. Stop: above 461.
📊 Intraday Plan:
* Scalp rejection at 462–463 for short → first target 458, extended 455.
* Long scalp off 455.3–456 demand zone if market supports tech bounce.
Volume and index context (SPY/QQQ) are critical — MSFT follows market rotation, so use confluence.
💭 Final Take
MSFT is now dancing at the top of a major gamma ceiling. Without fresh momentum or market-wide tech strength, this area favors fade setups. GEX data supports cautious upside while rewarding early downside setups with clean risk-reward.
⚠️ Disclaimer:
This analysis is for educational purposes only and not financial advice. Always do your own due diligence and manage risk properly before trading.

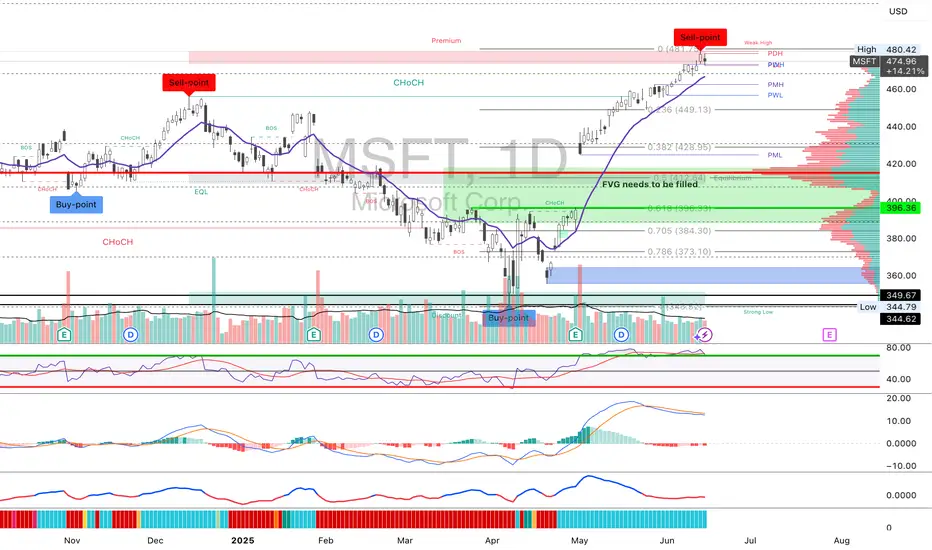
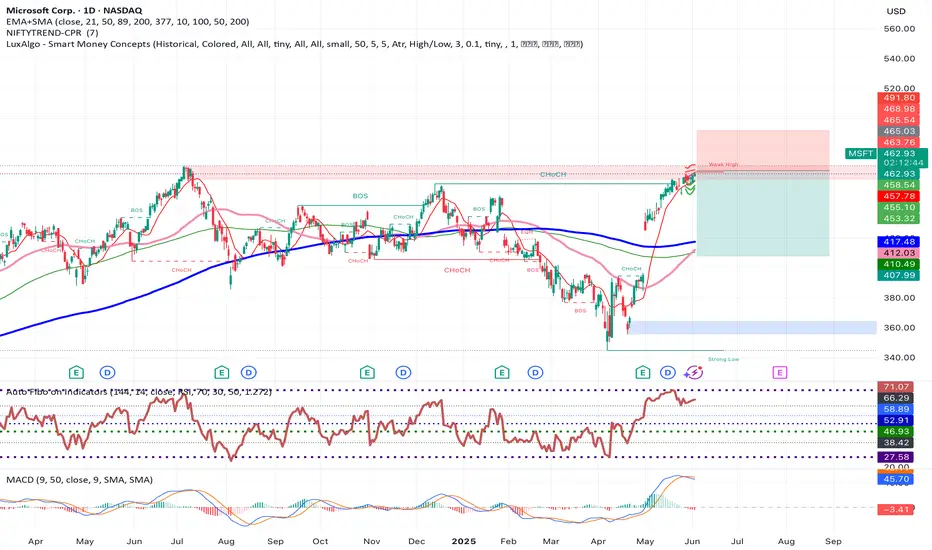
Microsoft Corp. (MSFT) – Smart Money Concepts | Liquidity Trap This chart outlines a high-probability liquidity run reversal setup driven by SMC principles. Price has reached Premium territory, sweeping the weak high and now showing signs of distribution.
🔍 Key Levels & Structure:
Current Price: $459.63
Premium Zone: $457–462 → Price swept weak high (liquidity engineered)
Break of Structure (BOS): Seen post-CHoCH, signaling bearish shift
Equilibrium Target: $396.66 (macro midpoint)
Discount Refill Zone: $355–365 (previous accumulation base)
📊 Strategy & Setup:
Wait for confirmation of BOS below $450
First Re-entry Opportunity: $445–448 supply zone retest
Second Re-entry: $432–435 mitigation block
Final Buy Zone: $355–365 if deeper liquidity grab unfolds
Final Target (Mean Reversion): $396.66
🔄 Institutional Flow Logic:
Smart Money likely induced breakout liquidity above weak high.
Now expecting distribution and redistribution cycles on the way to equilibrium.
Ideal setup for swing traders or position traders aligning with SMC framework.
📌 If the market fails to hold above $462, this could trigger a cascade of BOS levels and internal breakouts all the way back to the discount zone.
#MSFT #SmartMoneyConcepts #SMC #LiquiditySweep #OrderBlocks #BreakOfStructure #TradingStrategy #WaverVanir #Equilibrium #MarketStructure #TradingView

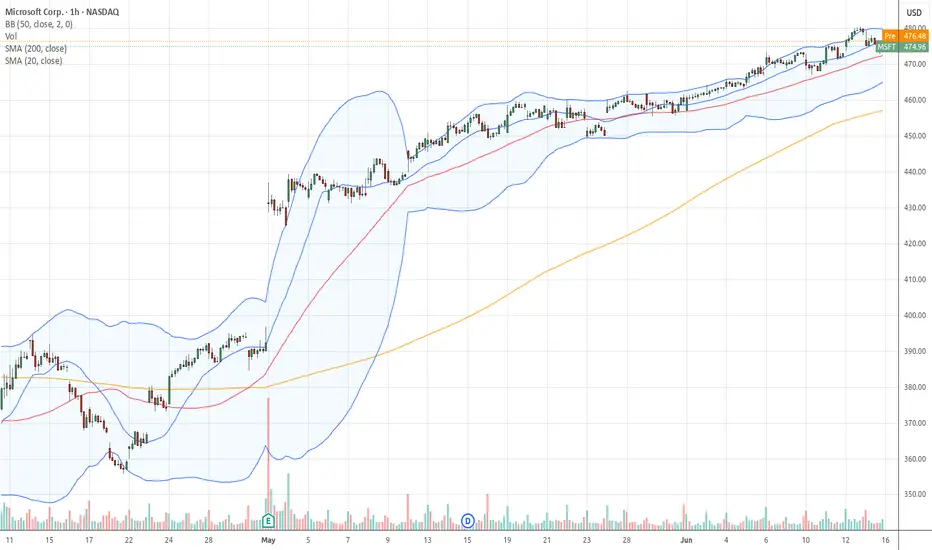
MSFT short, Broader Market Weakening.Weekly:
MFI divergence: Smart money flow pulling back while price pushes up — early warning sign of distribution.
Price touching upper Bollinger Band: Extended move on volatility basis; usually implies reversion risk, especially if paired with divergence.
Daily:
Overbought RSI: Price momentum overstretched.
RSI Bearish Divergence: Momentum slowing while price makes new highs — classic reversal signal.
MACD Bearish Crossover: Bearish momentum shift confirmed.
Volume Divergence: Lower volume on recent up moves or spike on down bars — lack of conviction on the rally.
✅ Multiple uncorrelated indicators (momentum, volatility, volume, price action) pointing to a short-term reversal.
✅ Higher time frame (weekly) divergences + Daily confirmations — that’s powerful confluence.

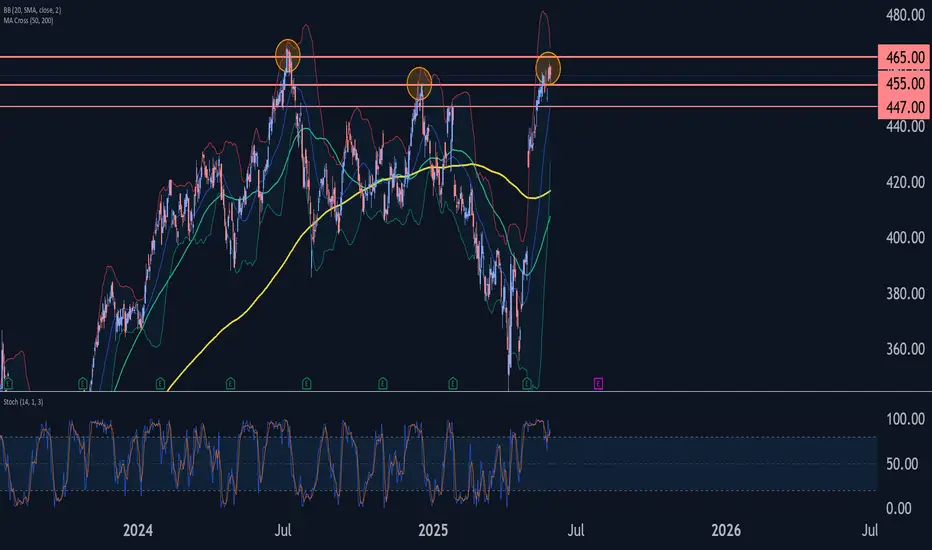
Microsoft Wave Analysis – 29 May 2025
- Microsoft reversed from resistance zone
- Likely to fall to support level 447.00
Microsoft recently reversed down from the resistance zone located between the resistance levels 465.00 (which stopped the weekly uptrend in 2024) and 455.00 (top of wave (B) from the end of 2024).
This resistance zone was further strengthened by the upper weekly and daily Bollinger Bands.
Given the strength of the aforementioned resistance zone and the overbought daily Stochastic, Microsoft can be expected to fall to the next support level 447.00.
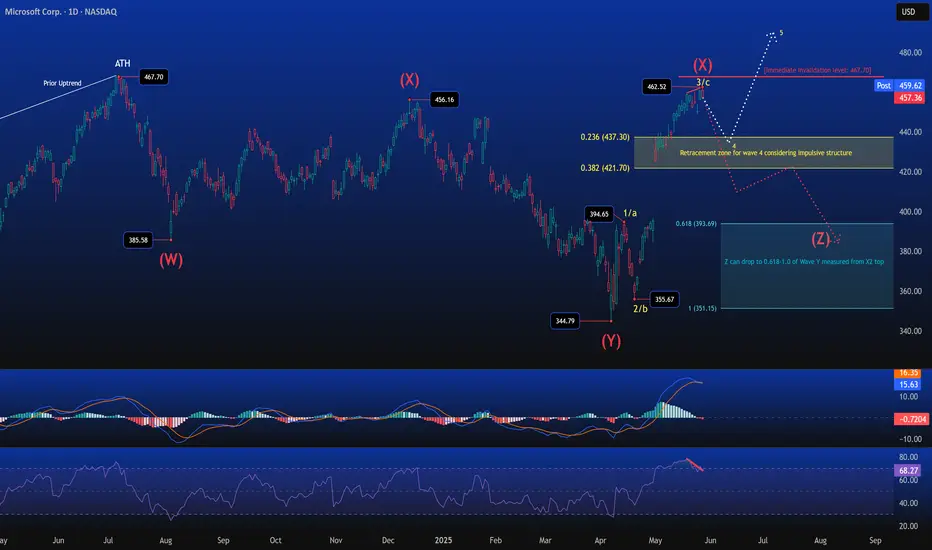
Microsoft’s Market Puzzle — The X2 ConundrumAfter a corrective decline from Microsoft’s All-Time High at $467.70, we’ve been tracking a potential complex structure unfolding — and the recent price behavior fits right into a well-formed W–X–Y–X–Z pattern .
In this latest move, we may be witnessing the final stages of the second X-wave (X2) — a sharp and extended rally that reached $462.52, pushing marginally above the first X-wave at $456.16.
Now before that raises eyebrows — yes, X2 is allowed to extend above X1 . In a complex correction, X-waves are connectors, not trends. They can retrace deeply or even overshoot previous pivot highs — especially in the form of an expanded zigzag or running correction. It’s rare, but perfectly legal in Elliott’s chaotic universe.
But this leads to a question:
Is this rally impulsive… or is it bait?
If the move from $344.79 is truly impulsive, then we’re potentially mid-way through a new bullish leg — with wave 3 ending at $462.78, and a mild wave 4 correction into the $437–$421 zone (0.236–0.382 retracement) expected before another pop higher. This view only holds as long as price remains below the ATH at $467.70 — our immediate invalidation level .
However, momentum indicators raise suspicions:
RSI is showing a clear bearish divergence — price made a new high, but RSI didn’t confirm it.
MACD has started rolling over, with a fading histogram — signaling potential exhaustion in this move.
This sets the stage for an alternate, and perhaps more compelling, scenario:
The rally from $344.79 to $462.78 is not a new trend — it’s the X2 wave in a still- unfinished W–X–Y–X–Z combo correction .
If this is the case, then what comes next is Wave Z — the final leg down to complete the entire corrective structure.
And here’s the Elliott rulebook:
Wave Z must be a 3-wave structure (likely a zigzag)
It often mirrors the size of Wave Y or contracts modestly
Projection for Z from the X2 top targets the $393–$351 zone, which represents a 0.618–1.0 retracement of the Wave Y decline
This zone becomes the primary downside watch area, should price reject from this level and fail to break above $467.70.
Summary:
We’re at a critical junction.
The rally from $344.79 could either be:
An impulsive move needing a wave 4 pullback
Or a complex X2 wave — ready to hand over the baton to Wave Z
Both scenarios require careful tracking of structure, MACD, RSI, and price action near the retracement zone and the ATH invalidation level.
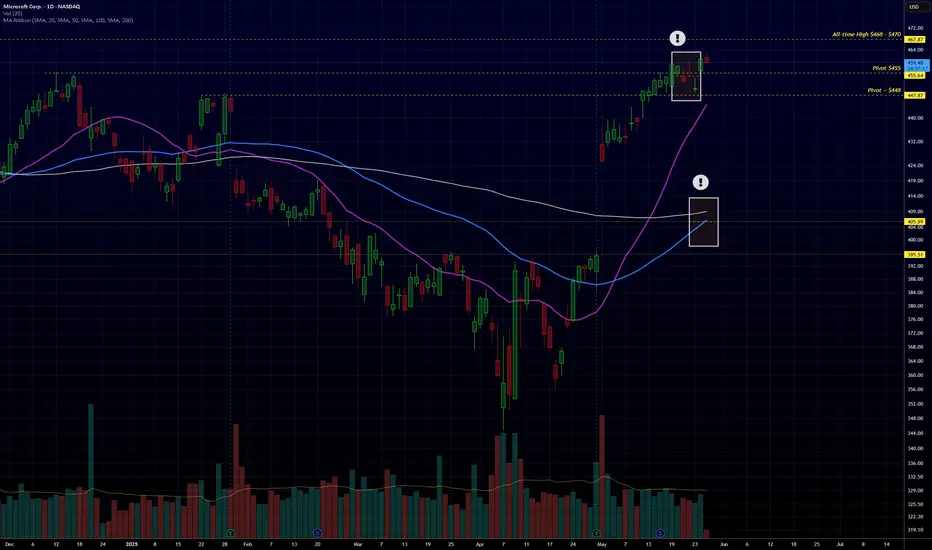
MSFT Breaking out? 4 Things Need to be Fixed FirstIn the last 2 weeks, MSFT broke above 2 major pivot levels $448 and $455 – that’s just 4 weeks after hitting a 52-week low on April 7th
Some would say that this represents huge momentum – and that the stock is ready for a major breakout above all-time high level and fly above $470
I have 4 issues with that view – that I need the stock to go through first and “prove itself” – let’s take a look at them quickly
1. Daily Shows Exhaustion: The last few daily bars are not reflecting confidence in the price moves – they reflect exhaustion – that’s almost all last week – the price struggled to close at the day’s high.
2. Missing the Right Alignment: The 50SMA is still below the 100SMA – that shows the bulls will still need a “breather” to consolidate their efforts and the key SMAs to align properly. In the daily view we also see how extended the price is (look at the purple line 20SMA wrt the other MA's)
3. Over-bought Weekly: The weekly chart shows the stock as over-bought, supporting the view that some profit taking and consolidation need to happen first before a serious breakout to new highs
4. Unsupportive Market: The market is still not recovered – we’re still in “daily-news-jumpy-sensitive” mode – there are even opinions that we’re in a bear market rally. Then some large money are waiting to see the outcome of tariffs and other decisions that will have lagging impact in June & July .. for me this is the most critical factor.
MSFT continues to be one of the best plays out there, so as we build up the position in our portfolio, let’s keep an eye on these factors and await setups with higher probabilities.
As usual, this is not a trading recommendation - just my own quick analysis
- please feel free to share your thoughts.