Tesla - This bullish break and retest!Tesla - NASDAQ:TSLA - confirmed the bullish reversal:
(click chart above to see the in depth analysis👆🏻)
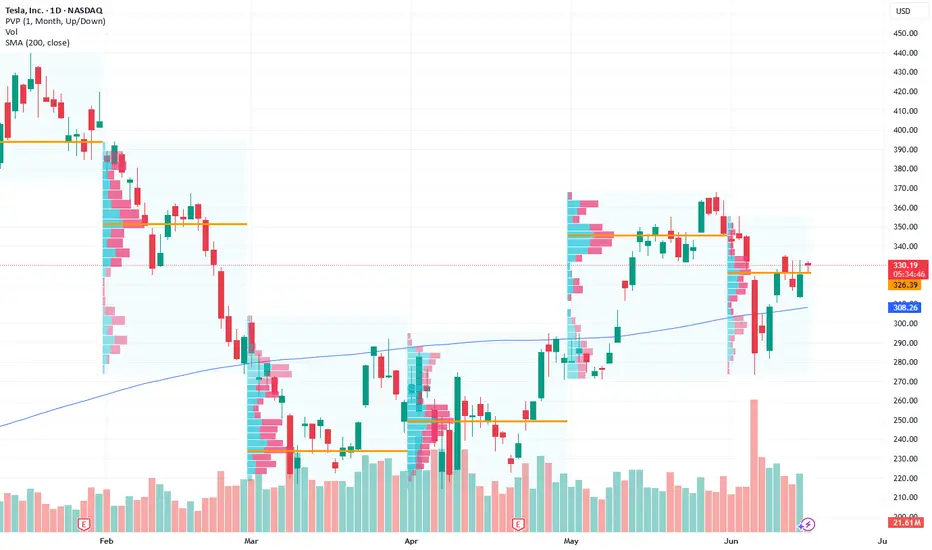
Tesla recently created a very bullish break and retest. Therefore together with the monthly bullish price action, the recent rally was totally expected. But despite the short term volatility, Tesla remains bullish, is heading higher and will soon create new highs.
Levels to watch: $400
Keep your long term vision!
Philip (BasicTrading)
TL0 trade ideas

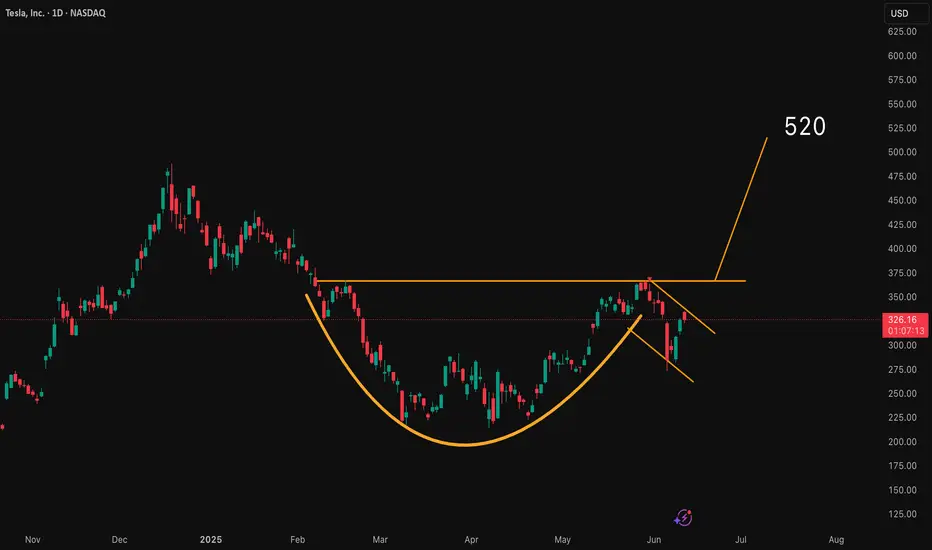
Cup and handleA big move is coming if the formation breaks to the upside. I see 500-520$ as the target area.
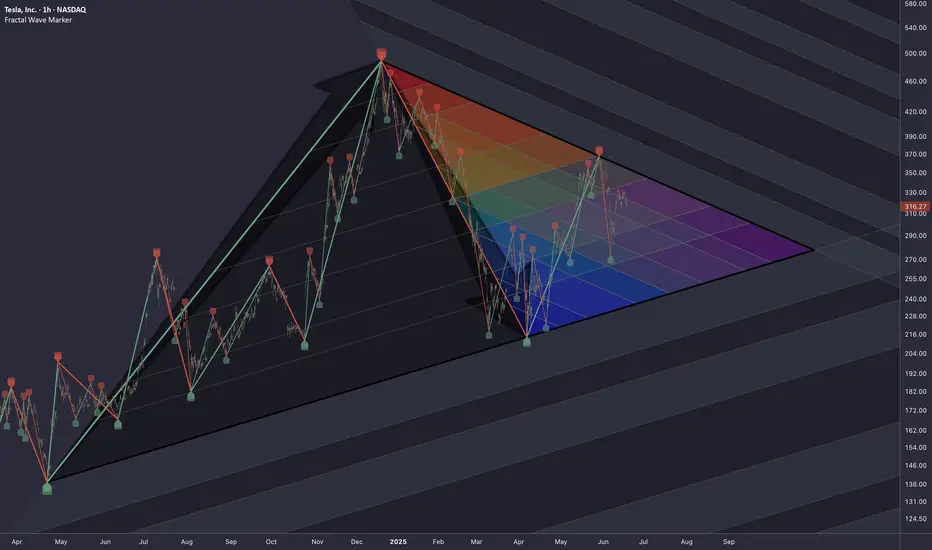
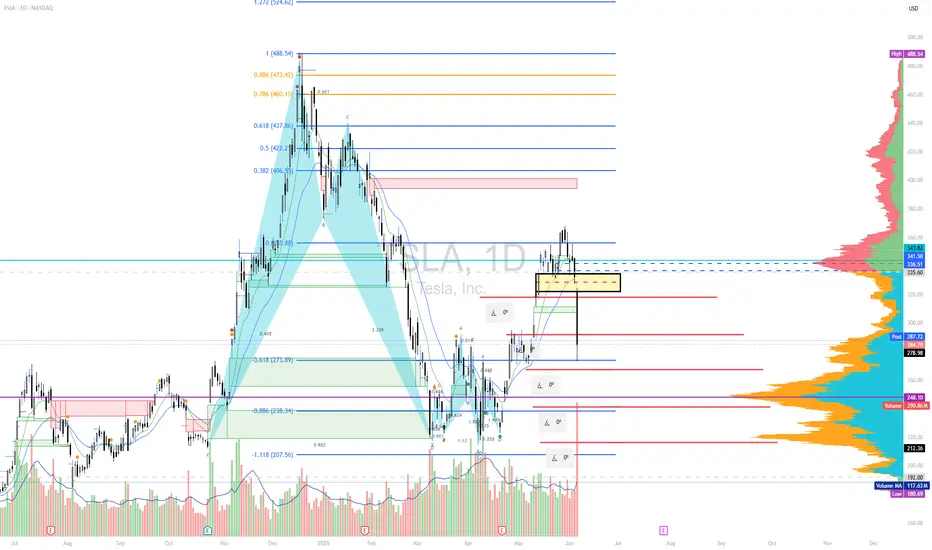
TSLA: Triangle PatternResearching the market through structural lens, particularly the topology of trapped liquidity buildup and compression of volatility, that leads to a proportionally heavier move once a breakout occurs.
Raw compression area derived from waves of higher degrees (2nd, 3rd)
The longer price consolidates within boundaries of a triangular formation, the more significant the breakout tends to be.
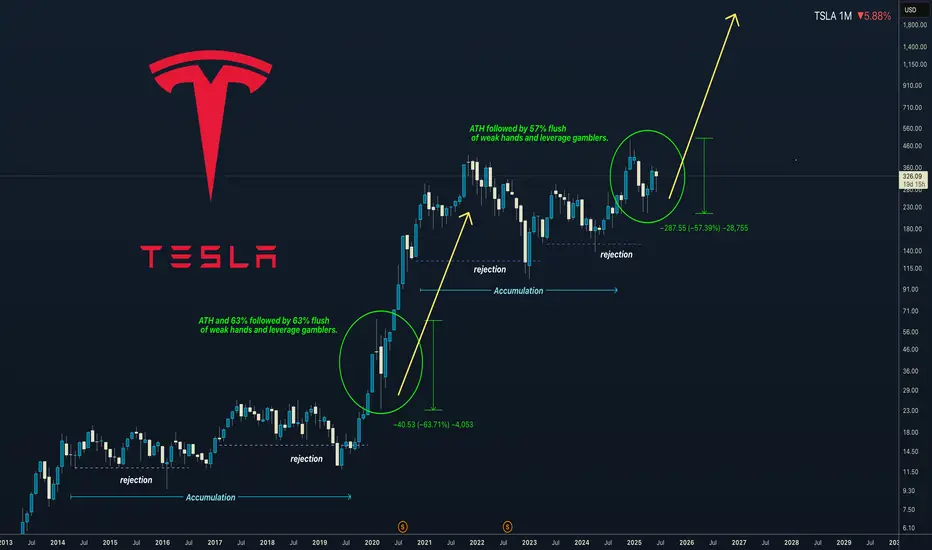
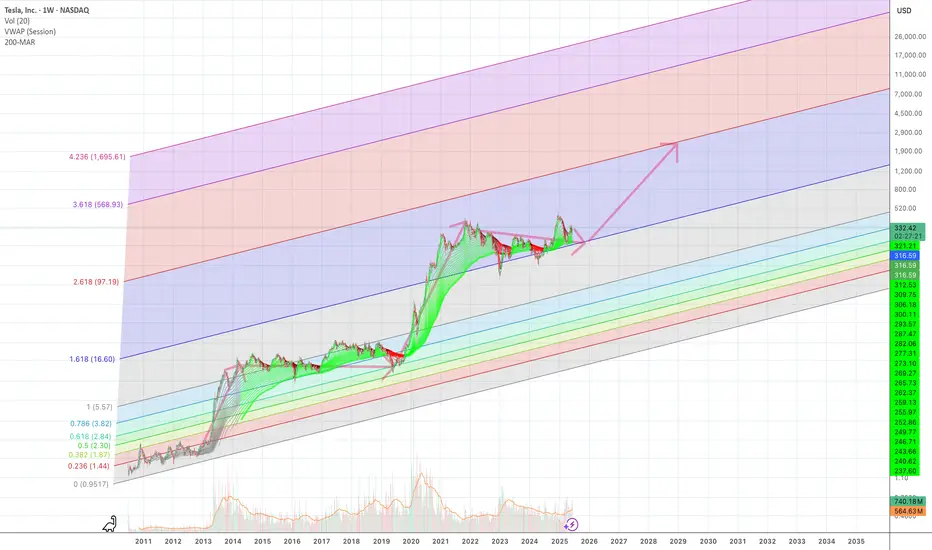
Tesla Crashed 57% — Here’s What History Says Happens AfterThose who knows me you know Im Tesla Bull. I got a longterm vision for Robotics and AI. Which I think Tesla will be big part of it. Whether you like Elon Musk or not Tesla will participate. Can. his behavior and politics acitivities affect Tesla stocks? Absolutely, Im aware that this is risky long term investment. I got numbers which I follow, shared in my previous Tesla ideas.
Here is a just price action and historical perspective - History doesnt repeat but it definitely rhymes and I can see this pattern repeating. Here is a key points.
5 years accumulation
Few big dumps followed by rejections
Break out and new ATH
ATH imidiatelly followed by 60% dump
After Dump price expanded 1000%
Currently we are at point 4.....
Will the history repeat ??
I dont know and Im not shilling anything, its my view which Im betting on based on the data from the expert analysts which I shared in this posts.
PS: Every of mine Tesla idea gets too emotional comments. I get it, you hate Elon, or you have different opinions. Fine I respect that, but please stay civil, it's not necessary to attack person on the internet for having different opinion.
Have a gret day !!
Called and bought $200 bottom
Long term vision
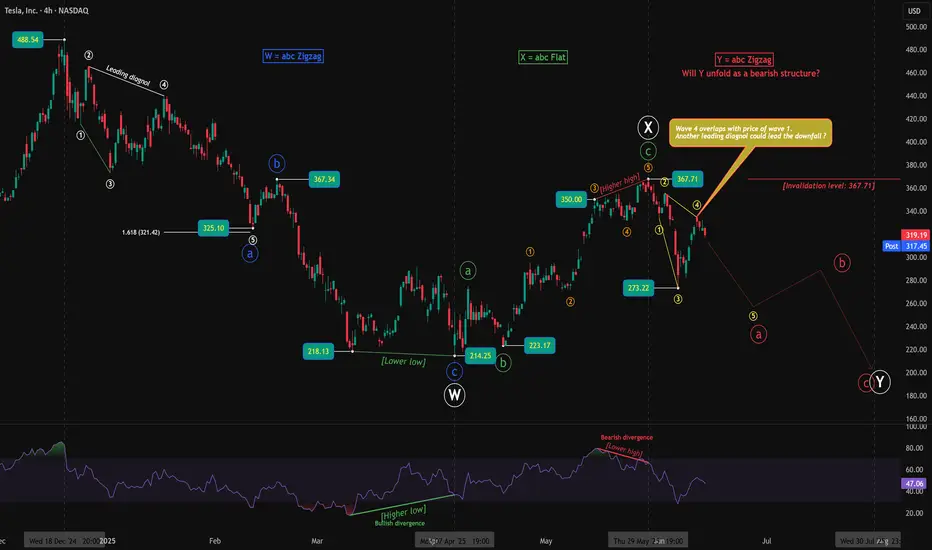
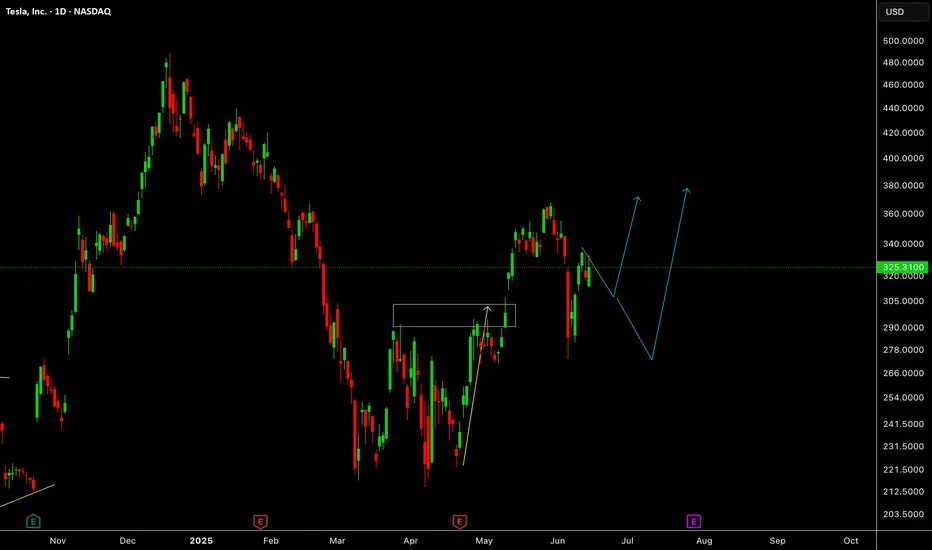
Tesla’s Flat Deception: Bearish Wave Y in the Making?Tesla’s price structure has taken traders on quite a journey, and after peeling back the layers, it's clear that both bullish and bearish possibilities demanded attention — but only one holds more weight for now.
The first sign of life came at the March low, where price made a lower low (218.13 to 214.25), but RSI formed a higher low. This classic bullish divergence paved the way for a strong rally, confirming that Wave W had likely ended with a sharp zigzag, and Wave X was beginning to unfold. The bounce from 214.25 extended into a flat structure, which completed near 367.71 — a textbook ABC flat with the internal wave b forming a higher low at 223.17.
Initially, this structure looked like the beginning of a bullish impulse. The drop to 273.22 perfectly tagged the 0.618 Fibonacci retracement, and it was tempting to label it as Wave 2 of a new impulse. However, that bullish view began to crack when the bounce from 273.22 appeared to be a three-wave move, not a clean five-wave impulse. More importantly, Wave 4 of this move overlapped the price of Wave 1 — a key violation that rules out a typical impulse and instead suggests the move was a leading diagonal.
This view is supported by the RSI, which revealed bearish divergence as price climbed from 350.00 to 367.71 — price made a higher high, but RSI made a lower high, indicating fading momentum. That divergence, combined with the overlapping structure, tilts the probability toward a bearish scenario now unfolding as Wave Y.
If this view plays out, the decline from 367.71 may be the start of Wave a of Y in a final zigzag correction. The projected path would take Tesla lower in a 5-3-5 structure, with potential support near or below the March lows. The bearish view remains valid as long as price stays below 367.71 — the clear invalidation point. A move above that level would force a reevaluation and potentially revive the bullish case.
At this point, the market has spoken — and it's whispering bearish. The structure favors caution unless bulls reclaim momentum with strength.
Disclaimer: This analysis is for educational purposes only and does not constitute investment advice. Please do your own research (DYOR) before making any trading decisions.
Gold silver the es and the Russell Friday 13 there's no time to have a long discussion here the information is in the video important things are happening in these markets and they are explained in the video. there are some changes suggesting that the silver may not actually go lower at this point even though the gold is holding for the time being .

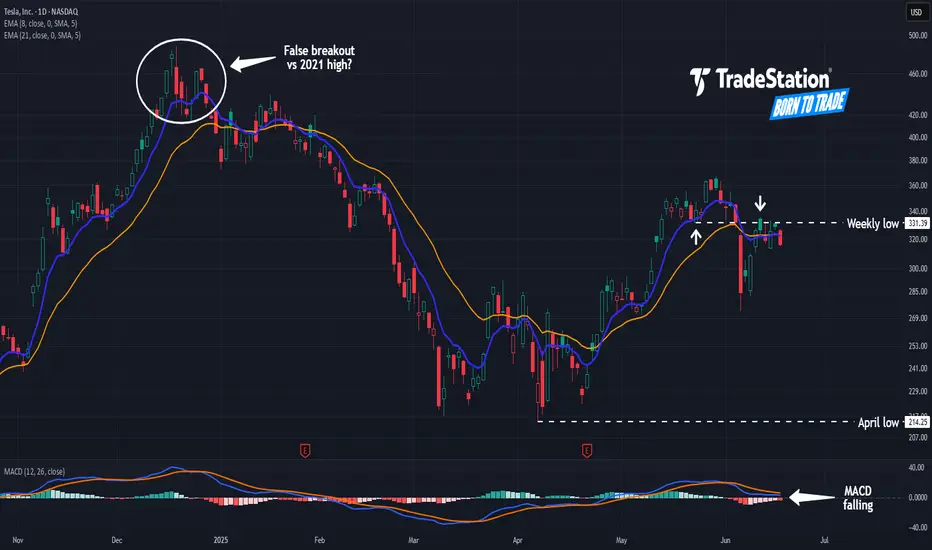
Tesla May Be StallingTesla bounced between early April and late May, but now it may be stalling.
The first pattern on today’s chart is the weekly low of $331.39 from May 22. TSLA fell below that level two weeks ago and was rejected at the same price area last week. Has old support become new resistance?
Second, the stock has fallen under its 8- and 21-day exponential moving averages (EMAs). The 8-day EMA is also at risk of slipping below the 21-day EMA. Such patterns may reflect short-term bearishness. Falling MACD paints a similar picture.
Third, the EV stock peaked at $488.54 in December -- above its previous high of $414.50 from November 2021. But it failed to hold, which could be viewed as a false breakout.
Those signals could focus traders’ attention on the April low of $214.15, which is still more than $100 below TSLA’s close on Tuesday.
Finally, TSLA is an active options underlier. (Its average daily volume of 2.6 million contracts last month ranked third in the entire market, according to TradeStation data.) That could make it easier for traders to take positions with calls and puts.
Check out TradingView's The Leap competition sponsored by TradeStation.
TradeStation has, for decades, advanced the trading industry, providing access to stocks, options and futures. If you're born to trade, we could be for you. See our Overview for more.
Past performance, whether actual or indicated by historical tests of strategies, is no guarantee of future performance or success. There is a possibility that you may sustain a loss equal to or greater than your entire investment regardless of which asset class you trade (equities, options or futures); therefore, you should not invest or risk money that you cannot afford to lose. Online trading is not suitable for all investors. View the document titled Characteristics and Risks of Standardized Options at www.TradeStation.com . Before trading any asset class, customers must read the relevant risk disclosure statements on www.TradeStation.com . System access and trade placement and execution may be delayed or fail due to market volatility and volume, quote delays, system and software errors, Internet traffic, outages and other factors.
Securities and futures trading is offered to self-directed customers by TradeStation Securities, Inc., a broker-dealer registered with the Securities and Exchange Commission and a futures commission merchant licensed with the Commodity Futures Trading Commission). TradeStation Securities is a member of the Financial Industry Regulatory Authority, the National Futures Association, and a number of exchanges.
Options trading is not suitable for all investors. Your TradeStation Securities’ account application to trade options will be considered and approved or disapproved based on all relevant factors, including your trading experience. See www.TradeStation.com . Visit www.TradeStation.com for full details on the costs and fees associated with options.
Margin trading involves risks, and it is important that you fully understand those risks before trading on margin. The Margin Disclosure Statement outlines many of those risks, including that you can lose more funds than you deposit in your margin account; your brokerage firm can force the sale of securities in your account; your brokerage firm can sell your securities without contacting you; and you are not entitled to an extension of time on a margin call. Review the Margin Disclosure Statement at www.TradeStation.com .
TradeStation Securities, Inc. and TradeStation Technologies, Inc. are each wholly owned subsidiaries of TradeStation Group, Inc., both operating, and providing products and services, under the TradeStation brand and trademark. When applying for, or purchasing, accounts, subscriptions, products and services, it is important that you know which company you will be dealing with. Visit www.TradeStation.com for further important information explaining what this means.
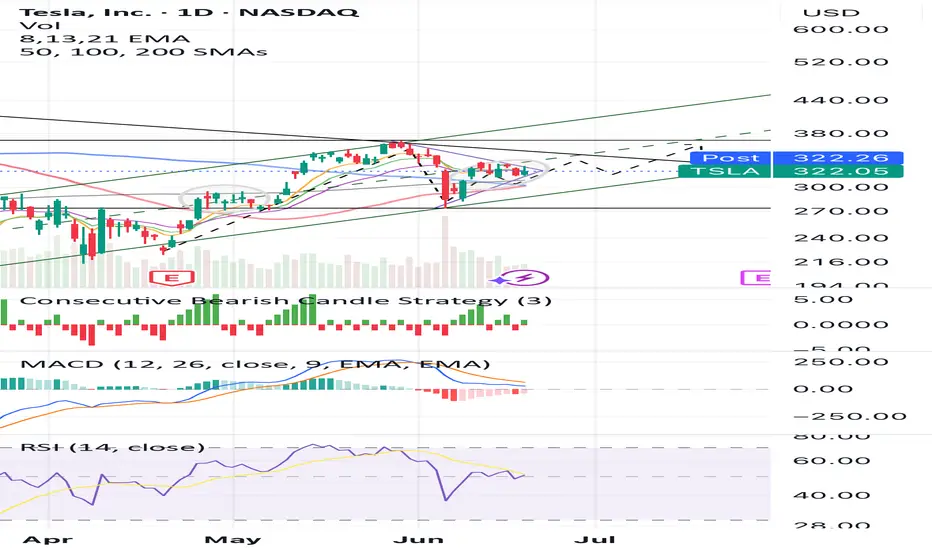
On the edge of bullish breakdownCurrent price is in a falling wedge and consolidating in 310-330 above 100 SMA within a long-term uptrend channel. Two grey circles mark previous & current consolidation zones - a clear attempt to highlight a repeating pattern that may lead to a breakout, just like in late April. MACD/RSI show signs of bullish momentum recovery. PT: 350. NFA!
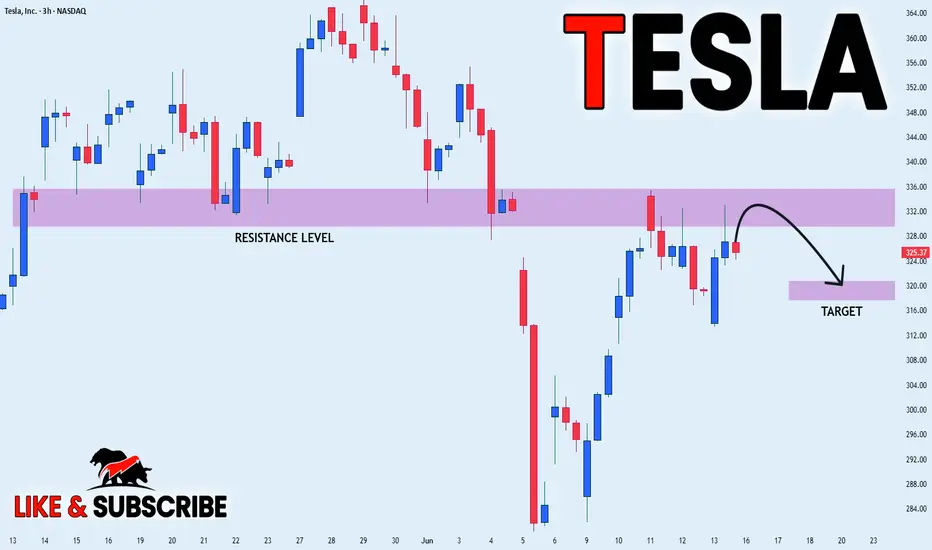
TESLA WILL GO DOWN|SHORT|
✅TESLA is going up now
But a strong resistance level is ahead at 336$
Thus I am expecting a pullback
And a move down towards the target of 320$
SHORT🔥
✅Like and subscribe to never miss a new idea!✅
Disclosure: I am part of Trade Nation's Influencer program and receive a monthly fee for using their TradingView charts in my analysis.
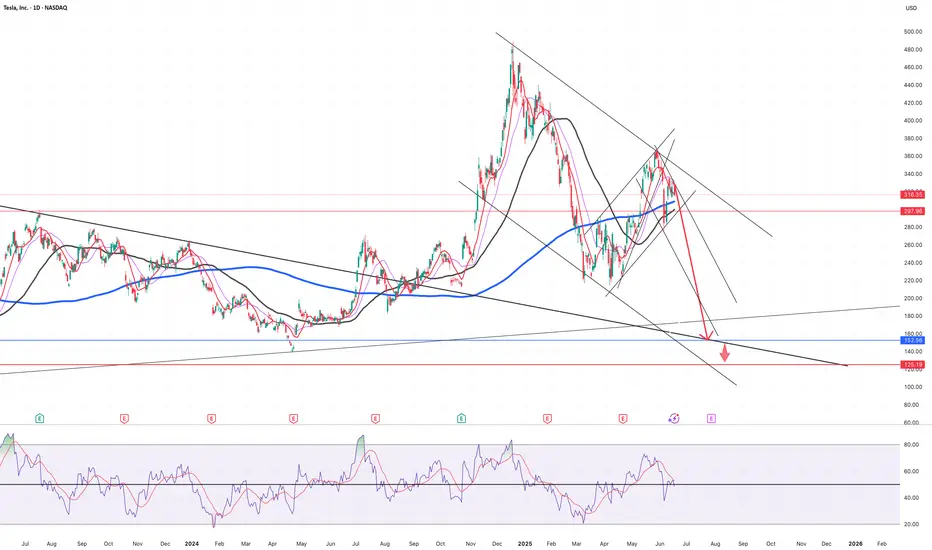
TSLA It’s still downtrendIf break support 297 below then It’s going down till 153 , (extention is 125)
The stock market is highly volatile. Please be very careful with your investments.
TSLA Failing at Gamma Wall! Will $322 Hold or Collapse Into $315🔬 GEX (Options Sentiment) Breakdown:
* Gamma Exposure Zones:
* Major Resistance (Gamma Wall): $327.50 → current rejection zone
* Second CALL Wall: $340 → unlikely unless gamma squeeze kicks in
* Strongest CALL Zone: $350 (very unlikely without broader tech rally)
* PUT Support Zones:
* $322.50 → HVL + initial gamma flip
* $315 = highest negative GEX / heavy PUT support
* $310 = 3rd PUT wall — deep flush risk
* Options Metrics:
* IVR: 25.2 (moderate)
* IVx avg: 70.5
* Calls Flow: 71.5% → bullish interest still high
* GEX Sentiment: 🟢🟢🟢🟢 (tilted bullish but with risk below $322.50)
* Interpretation:
* TSLA is trading below the Gamma Wall at $327.5 and just cracked the HVL zone at $322.5 — this is a bearish transition point.
* GEX model shows put acceleration below $322. If bulls don’t step in quickly, it could slide fast to $315 or even $310.
🧠 15-Minute SMC Breakdown:
* Current Price: $325.00
* Structure:
* Multiple CHoCHs and BOS levels near $330–$327
* Bearish wedge breakdown from consolidation just occurred
* Breakdown candle volume surging = institutional selling confirmed
* Entering demand zone (green box) near $324 → temporary bounce possible
* Trendlines:
* Broken wedge & horizontal support = confirms downside pressure
* If $322.50 fails, next liquidity is $315 (GEX + prior BOS zone)
⚔️ Trade Setups:
🟥 Bearish Setup (High Probability):
* Trigger: Continuation below $322.50
* Target 1: $315 (PUT support)
* Target 2: $310
* Stop-loss: Above $327.50 (Gamma Wall)
Price is transitioning below gamma support and into negative delta zone — watch for acceleration if $322.50 loses volume bid.
🟩 Bullish Scenario (Needs Reclaim):
* Trigger: Reclaim of $328
* Target 1: $331.20 (minor resistance)
* Target 2: $336–$340 (CALL wall / next GEX magnet)
* Stop-loss: Below $324.50
Would need strong market reversal and SPY/QQQ support for this to play out.
💭 My Thoughts:
* TSLA is transitioning into a bearish zone, especially with this CHoCH + GEX rejection from $327.5.
* Volume spike shows sellers are stepping in — bounces are sell opportunities unless reclaimed fast.
* Call buyers are still heavy (71.5%) — if this unwinds, downside could be even faster.
* Great setup for PUT spread or directional PUTs on breakdown.
🔚 Conclusion:
TSLA has rejected from the $327.5 Gamma Wall and now cracked a key support. With structure and options data aligned, a flush to $315 is on watch if $322.5 breaks cleanly. Bullish only above $328 with strength.
Disclaimer: This content is for educational purposes only. Always manage your risk and execute trades based on your own strategy.

Short TSLA, for nowdef juice to the downside right now, media attn is insane. But theirs major harmonics at play. and ill be buying at those lows and posting long, until then. dont fight it. t3 almost hit of momentum measure. actually insane moves
What Is T-Distribution in Trading? What Is T-Distribution in Trading?
In the financial markets, understanding T-distribution in probability is a valuable skill. This statistical concept, crucial for small sample sizes, offers insights into market trends and risks. By grasping T-distribution, traders gain a powerful tool for evaluating strategies, risks, and portfolios. Let's delve into what T-distribution is and how it's effectively used in the realm of trading.
Understanding T-Distribution
The T-distribution in probability distribution plays a crucial role in trading, especially in situations where sample sizes are small. William Sealy Gosset first introduced it under the pseudonym "Student". This distribution resembles the normal distribution with its bell-shaped curve but has thicker tails, meaning it predicts more outcomes in the extreme ends than a normal distribution would.
A key element of T-distribution is the concept of 'degrees of freedom', which essentially refers to the number of values in a calculation that are free to vary. It's usually the sample size minus one.
The degrees of freedom affect the shape of the T-distribution; with fewer degrees of freedom, the distribution has heavier tails. As the degrees of freedom increase, the distribution starts to resemble the normal distribution more closely. This is particularly significant in trading when dealing with small data sets, where the T-distribution provides a more accurate estimation of probability and risk than the normal distribution.
T-Distribution vs Normal Distribution
T-distribution and normal distribution are foundational in statistical analysis, yet they serve different purposes. While both exhibit a bell-shaped curve, the T-distribution has thicker tails, implying a higher probability of extreme values. This makes it more suitable for small sample sizes or when the standard deviation is unknown.
In contrast, the normal distribution, with its thinner tails, is ideal for larger sample sets where the standard deviation is known. Traders often use T-distribution for more accurate analysis in small-scale or uncertain data scenarios, while normal distribution is preferred for larger, more stable datasets, where extreme outcomes are less likely.
Application in Trading
In trading, T-distribution is a valuable tool for analysing financial data. It is primarily used in constructing confidence intervals and conducting hypothesis testing, which are essential for making informed trading decisions.
For instance, a trader might use T-distribution to test the effectiveness of a new trading strategy. Suppose a trader has developed a strategy using the technical analysis tools and wants to understand its potential effectiveness compared to the general market performance. They would collect a sample of returns from this strategy over a period, say, 30 days. Given the small sample size, using T-distribution is appropriate here.
The trader would then calculate the mean return of this sample and use T-distribution to create a confidence interval. This interval would provide a range within which the true mean return of the strategy is likely to lie, with a certain level of confidence. If this confidence interval shows a higher mean return than the market average, the trader might conclude that the strategy is potentially effective. However, it's important to note that this is an estimation and not a guarantee of future performance.
How to Plug Probability and Normal Distribution in Your T-Calculation
To use a T-calculator for integrating probability and normal distribution, follow these steps:
- Input Degrees of Freedom: For T-distribution, calculate the degrees of freedom (sample size minus one).
- Convert Z-Score to T-Value: If using normal distribution data, convert the Z-score (standard deviation units from the mean in a normal distribution) to a T-value using the formula: T = Z * (sqrt(n)), where 'n' is the sample size.
- Enter T-Value: Input this T-value into the calculator.
- Calculate Probability: The calculator will then output the probability, providing a statistical basis for trading decisions based on the T-distribution.
Limitations and Considerations of T-Distribution
While T-distribution is a powerful tool in trading analysis, it's important to recognise its limitations and considerations:
- Sample Size Sensitivity: T-distribution is most effective with small sample sizes. As the sample size increases, it converges to a normal distribution, reducing its distinct utility.
- Assumption of Normality: T-distribution assumes that the underlying data is approximately normally distributed. This may not hold true for all financial data sets, especially those with significant skewness or kurtosis.
- Degrees of Freedom Complications: Misestimating degrees of freedom can lead to inaccurate results. It's crucial to calculate this correctly based on the sample data.
- Outlier Sensitivity: T-distribution can be overly sensitive to outliers in the data, which can skew results.
Advanced Applications of T-Distribution in Trading
T-distribution extends beyond basic trading applications, playing a role in advanced financial analyses:
- Risk Modelling: Utilised in constructing sophisticated risk models, helping traders assess the probability of extreme losses.
- Algorithmic Trading: Integral in developing complex algorithms.
- Portfolio Optimisation: Assists in optimising portfolios by estimating returns and risks of various assets.
- Market Research: Used in advanced market research methodologies to analyse small sample behavioural studies.
The Bottom Line
The T-distribution is a powerful tool, offering nuanced insights in scenarios involving small sample sizes or uncertain standard deviations. Its ability to accommodate real-world data's quirks makes it invaluable for various trading applications, from strategy testing to risk assessment. However, understanding its limitations and proper application is crucial for accurate analysis.
This article represents the opinion of the Companies operating under the FXOpen brand only. It is not to be construed as an offer, solicitation, or recommendation with respect to products and services provided by the Companies operating under the FXOpen brand, nor is it to be considered financial advice.
TSLA trade of the weekThis idea is something new where I'm asking my HIGHLY EXPERIMENTAL dowsing work for a "best bang for your buck" trade at the beginning of the week. Last week was pretty good saying to short SPY on Wed., so I'm going to journal these and see if it can be consistent.
If this aligns with YOUR work, great.
The idea is TSLA has a spike up towards the upper gap around $326-28. My levels on TSLA often are overshot, but anyway. Then watch for it to head towards the lower gap in the $310-307 zone and possibly down to $302.
My work is INCONSISTENT. There's more going into this than just looking at an indicator. This is energy, intention, intuition and God knows what else and it's more for myself than you. But, if you're interested, I'm happy to answer questions and share as I hope it inspires your own sense of what is possible beyond just the physical world.

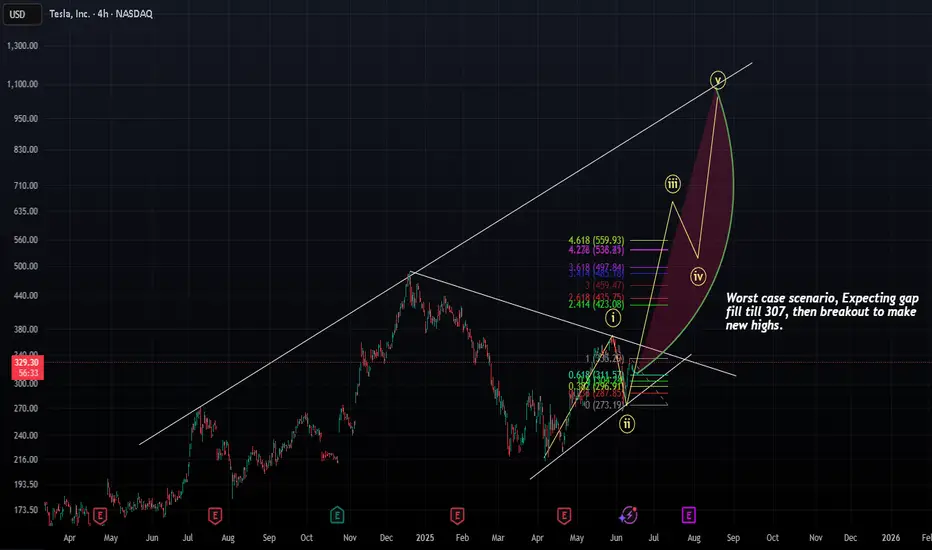
TESLA - Some consolidation, before parabolic moveAnticipating Tesla to consolidate, with a worst-case scenario of filling the gap down to $307, followed by a sharp parabolic rise to new all-time highs.
Get ready for a parabolic move :)
When Intuition Beats the Algorithm█ When Gut Feeling Beats the Bot: How Experience Can Improve Algorithmic Trading
In today’s world of fast, data-driven trading, we often hear that algorithms and rules-based systems are the future. But what happens when you mix that with a trader’s intuition, the kind that only comes from years of watching charts and reading price action?
A recent study has some surprising results: A seasoned discretionary trader (someone who trades based on what they see and feel, not just rules) was given a basic algorithmic strategy. The twist? He could override the signals and use his instincts. The result? He turned a losing system into a winning one, big time.
█ What Was the Experiment?
Researchers Zarattini and Stamatoudis (2024) wanted to test whether a skilled trader’s experience could boost a mechanical system. They took 9,794 stock “gap up” events from 2016 to 2023, where a stock opens much higher than the day before, and let the trader pick which ones looked promising.
⚪ To make it fair:
All charts were anonymized — no names, no news, no distractions.
The trader had only the price action to guide his choices.
He could also manage open trades — adjusting stop-losses, profit targets, and position sizing based on what the price was doing.
⚪ The Trading Setup
█ What Did They Find?
The trader only selected about 18% of all the gap-ups. But those trades performed far better than the full list. Here's what stood out:
Without stop-losses, the basic strategy lost money consistently (down -0.25R after just 8 days).
With the trader involved, profits rose fast, hitting +0.80R just 4 days after entry.
Risk was tightly managed: only 0.25% of capital was risked per trade.
⚪ So what made the difference? The trader could spot things the system missed:
Strong momentum early in a move
Clean breakouts from long sideways ranges
Patterns that had real follow-through, not just random gaps
He avoided weak setups and managed trades like a pro, cutting losers, letting winners run, and trailing positions with smart stop placements.
⚪ Example
An experienced trader can quickly identify a breakaway gap, when a stock gaps up above a clear resistance level. Unlike random gaps, this setup often signals the start of a strong move. While a system might treat all gaps the same, a skilled trader knows this one has real potential.
█ What Does This Mean for You?
This research shows that trading experience still matters — a lot.
If you’re a systematic trader, adding a discretionary filter (whether it’s your own review or someone else’s) could drastically improve your results. A clean chart read can help you avoid false signals and focus only on the best setups.
If you’re a discretionary trader, this study is proof that your skills can add measurable value. With the right tools and discipline, you don’t need to throw away your instincts, you can combine them with structure and still win.
█ Key Takeaways
⚪ Gut feeling isn’t just noise, trained instincts can spot what rules miss.
⚪ Trade selection matters more than just following every signal.
⚪ Managing risk and exits well is just as important as picking good entries.
⚪ Hybrid trading, rules plus judgment — might be the most powerful combo.
-----------------
Disclaimer
The content provided in my scripts, indicators, ideas, algorithms, and systems is for educational and informational purposes only. It does not constitute financial advice, investment recommendations, or a solicitation to buy or sell any financial instruments. I will not accept liability for any loss or damage, including without limitation any loss of profit, which may arise directly or indirectly from the use of or reliance on such information.
All investments involve risk, and the past performance of a security, industry, sector, market, financial product, trading strategy, backtest, or individual's trading does not guarantee future results or returns. Investors are fully responsible for any investment decisions they make. Such decisions should be based solely on an evaluation of their financial circumstances, investment objectives, risk tolerance, and liquidity needs.

TESLA: Can double its price ($640) by the end of the year.Tesla is neutral on its 1D technical outlook (RSI = 51.064, MACD = 4.910, ADX = 24.971), consolidating for the past week, but remains over its 1D MA50 and 1D MA200 nonetheless. Since the major market bottom on January 6th 2023, it's been trading inside a Channel Up and this is its 3rd bullish wave. The 2 prior rose by +196.67% from the bottom of the pattern (despite the 2nd breaking marginally under it). Consequently, this suggests that Tesla can rise by +100% from the current $320 level, before the Channel Up tops (HH) again. We are bullish, TP = 640.
See how our prior idea has worked out:
## If you like our free content follow our profile to get more daily ideas. ##
## Comments and likes are greatly appreciated. ##

Tesla🚗 Tesla (TSLA) – Long-Term Bullish Outlook 📈
Tesla is showing extreme bullish strength across higher timeframes, supported by strong fundamentals, innovation momentum, and institutional interest. The current price action suggests a solid long-term buying opportunity for patient investors and swing traders alike.
🔍 Technical Outlook:
The stock has broken key resistance levels and is maintaining higher lows.
Momentum indicators support continuation of the uptrend.
Volume and sentiment remain favorable.
📅 Investment Horizon:
Mid to Long Term (Up to 2 Years)
🎯 Target Levels:
➡️ 500 – First major resistance
➡️ 700 – Medium-term breakout target
➡️ 900 – Long-term bullish target based on macro and chart structure
📌 Strategy:
Buy on dips or sustained breakouts. Suitable for long-term portfolios with a 1–2 year holding perspective. Risk management and scaling in recommended.
💬 This is not financial advice. Always do your own research and manage risk appropriately.
#TSLA #Tesla #Stocks #TradingView #Investing #Bullish #LongTerm #SwingTrade #GrowthStocks

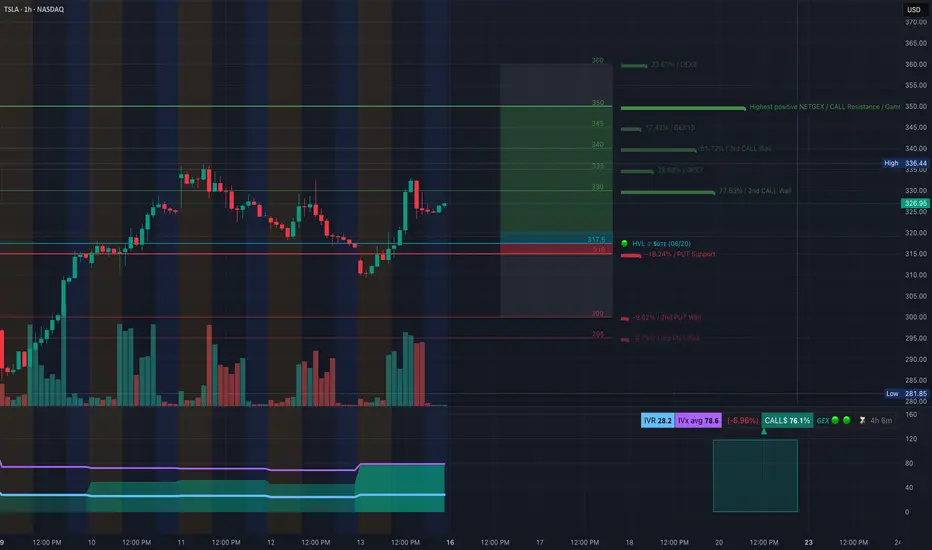
TSLA: Gamma & Price Action Aligning for Potential Bullish-Jun 16TSLA: Gamma Setups & Price Action Aligning for Potential Bullish Run
1️⃣ Options GEX Insights
* Gamma ‘walls’ building: Strongest Call protection at 335–350, anchored by the largest NETGEX/Call Wall — signaling substantial gamma support in that zone.
* Current call exposure stands at 76.1%, with puts at 23.9%. With IV suppressed (28.2 vs 78.6 avg), volatility is compressed—ideal for a quick rebound if triggered.
* Price is near 325, resting above the 317.5 HVL, and poised to test the gamma shelf near 335–340. Entry into 0–5DTE or 3DTE calls around 325–330 offers leverage as gamma accelerates through these walls.
2️⃣ 15-Minute Chart & Trade Plan
* Structure: Broke down below ascending range, but just executed a bullish Break of Structure (BOS) reversal near 309–310.
* Current trend: Eyes stacked higher lows (HL), structure confirmed—momentum is rebuilding.
* Key Zones:
* Entry area: on pullback/support near 325–326
* Target: 332.99–335+ (aligned with Call Wall)
* Invalidation: below 319.11, which would signal loss of structure.
⏫ Trade Suggestion: Consider initiating a bull entry on dip into 325–326, targeting 332–335 for the short term, and scaling out or trailing into gamma resistance zones.
🧠 Why I’m Interested
The alignment here is compelling: Options flow shows strong net gamma support ahead, IV is low (less decay hit), and structure reset (HL + BOS) confirms a textbook SMC setup. TSLA is carving out a classic bull signal off gamma-based support—ideal for scalping or short-term leg trades.
🚨 Disclaimer
This is not financial advice—purely educational. Trade with proper risk management, and be aware options carry unique risks, including rapid theta decay and volatility shifts.
TESLATesla is in the correction right now for bigger structure. It can go up to break the recent top with small correction or it can breakdown further before a push up.
Disclosure: We are part of Trade Nation's Influencer program and receive a monthly fee for using their TradingView charts in our analysis.
Near bottom. On The way To $2k as The Singularity Approaches see chart.
Near bottom. On The way To $2k as The Singularity Approaches .
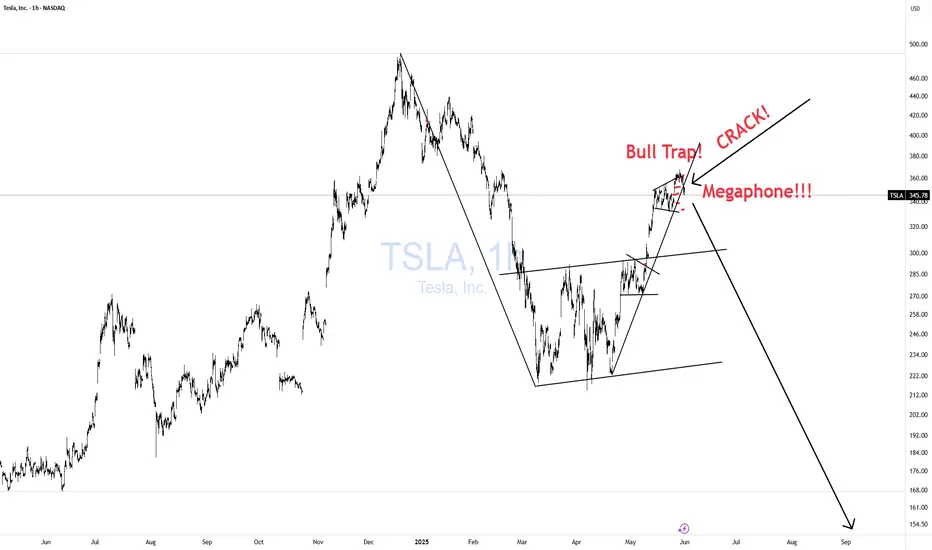
TSLA Honey Ticking Bull Trap!TSLA has a beautiful big ars bear flag! While it should have broken down to trigger a short trade, it decided to Honey Tick people right into a Trap!
It formed a perfect MEGAPHONE in wave 3 up that has now CRACKED! This is a much juicer short setup with the potential of collapsing from here and taking out the entire bear flag and MORE!!
First, we need a lower low and then a lower high and off we GO BABY!!!
Don't Get HONEY TICKED!
As I always say, never EVER!! Invest in toxic people like Elona. They always blow themselves up in the end. It's in their nature!
Click boost and follow, let's get to 5,000 followers. ;)
Take a bullish position on TSLA as price action confirms upside
Current Price: $325.31
Direction: LONG
Targets:
- T1 = $335.00
- T2 = $345.00
Stop Levels:
- S1 = $320.00
- S2 = $315.00
**Wisdom of Professional Traders:**
This analysis synthesizes insights from thousands of professional traders and market experts, leveraging collective intelligence to identify high-probability trade setups. The wisdom of crowds principle suggests that aggregated market perspectives from experienced professionals often outperform individual forecasts, reducing cognitive biases and highlighting consensus opportunities in Tesla.
**Key Insights:**
Tesla has shown substantial resilience in the tech-heavy market, with bullish sentiment linked to its innovative product lineup, particularly autonomous vehicles and the forthcoming robo-taxi launch. Institutional investors have actively increased positions, signaling long-term confidence in Tesla’s disruptive growth narrative. However, mixed profitability metrics and emerging competition in the global EV space keep valuations under scrutiny. Tesla’s price action around $325.31 suggests that the optimism surrounding potential catalysts outweighs near-term concerns, with technical momentum favoring further upside gains.
**Recent Performance:**
Tesla has demonstrated significant strength in recent trading sessions, successfully recovering from a minor pullback that aligned with broader market volatility. The stock climbed steadily from its $300 support level and has outperformed the broader tech sector during a period of overall market uncertainty. Heavy volume and speculative trading suggest strong engagement from both institutional and retail participants.
**Expert Analysis:**
Technical outlook for Tesla indicates bullish divergence on the daily Relative Strength Index (RSI) coupled with a successful retest of its 50-day moving average. These factors affirm that momentum remains firmly to the upside. Analysts highlight Tesla’s ability to set remarkable trends within the EV sector, backed by advancing autonomous technologies and renewable energy solutions. Near-term resistance sits at $335, where a breakout would likely trigger further upward movement toward $345.
**News Impact:**
Recent news regarding Tesla’s upcoming robo-taxi launch in June has considerably bolstered investor sentiment. Market participants view this innovation as a key milestone that could redefine Tesla’s growth trajectory. However, declining EV sales in Europe and the United States remain a concern, potentially capping excessive bullish momentum. Traders should watch for more clarity on macroeconomic factors influencing demand.
**Trading Recommendation:**
Tesla’s combination of technical strength and ground-breaking product developments underpins a favorable trading outlook. A long position with well-defined stops below $320 offers an attractive risk/reward setup, targeting $335 and $345 sequentially. While global sales trends warrant close monitoring, Tesla’s leadership within the EV and tech space supports a bullish thesis in the short term.