Tesla Drop to the downside update In this video I recap what happened in the latest drop on Tesla and how we anticipated this move some 4 days ago .
I cover whats possibly next for tesla looking forward .
This video also covers a HTF perspective on the direction of Tesla .
Any questions ask in comments
Thanks for your support
TL0 trade ideas

$TSLA - Time to BUY (F to sellers)When weak hands sell in fear, we proudly buy.
Tesla is at the perfect spot for buying right now, both from fundamental and technical sides. The recent fight between Elon & Trump granted so much needed correction to the chart. The price is resting on the $260 - $280 support now - ideal spot for buying before the massive blast off will happen.
A few technical factors: there is a HUGE ascending triangle with horizontal resistance ($415), the 3rd approach of this resistance should be final before the breakout happens! Moreover, the price is steadily forming a bullish pennant that will help in breaking the resistance up.
The overall trend is strictly bullish according to Fibo. The target of this upward movement is located in the $900 - $1000 zone which is x4 from current points. Not very often in our century you get such an opportunity.
You may have different opinions about Elon Musk, but you can't deny the fact he is brilliant businessman and entrepreneur. You can already see that "Tesla owners are scrambling to remove their anti Elon stickers from their car now that he is feuding with Trump" . Elon is a good-guy for liberals again, while republicans didn't change their positive attire regarding his company as well.
I tend to believe that all those news we witnessed yesterday (mean Elon&Trump fight) was just a part of a bigger plan , the outcome of which we will see later this year or even next year.

$BULLISH STRATEGY - SIMPLE BUT OFTEN USEFUL !This simple Strategy says when a trend has been shaped already the Second time which price hits the channel would be the most powerful wave can break even a static level !

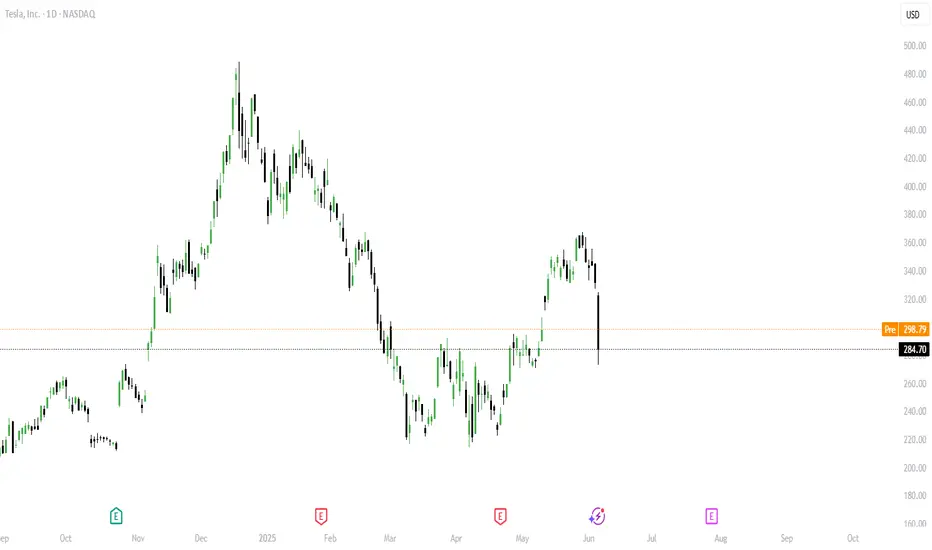
Will Tesla keep dropping?Tesla's stock experienced a significant decline of 14% yesterday, primarily due to a public feud between CEO Elon Musk and President Donald Trump. This dispute has raised concerns about potential government actions that could adversely affect Tesla's operations.
The conflict began when Musk criticized a proposed tax and spending bill, labeling it a "disgusting abomination." In response, President Trump threatened to terminate federal contracts with Musk's companies, including Tesla and SpaceX. This escalation led to a sharp drop in Tesla's stock price, erasing over $150 billion in market value and removing the company from the $1 trillion market capitalization club.
Technical analysis indicates that Tesla's stock broke below key support levels, including its 50- and 200-day moving averages, suggesting a potential continuation of the downtrend. Analysts have identified support levels at $265, $215, and $170, with resistance around $365.
Despite the recent turmoil, some analysts remain optimistic about Tesla's long-term prospects. Dan Ives of Wedbush Securities maintains a bullish outlook, citing upcoming innovations like Tesla's robotaxi service as potential growth drivers.
However, challenges persist. Tesla faces declining sales in Europe, increased competition from companies like BYD, and potential regulatory hurdles stemming from Musk's political engagements.
-Disclaimer: This analysis is for informational and educational purposes only and does not constitute financial advice, investment recommendation, or an offer to buy or sell any securities. Stock prices, valuations, and performance metrics are subject to change and may be outdated. Always conduct your own due diligence and consult with a licensed financial advisor before making investment decisions. The information presented may contain inaccuracies and should not be solely relied upon for financial decisions. I am not personally liable for your own losses, this is not financial advise.
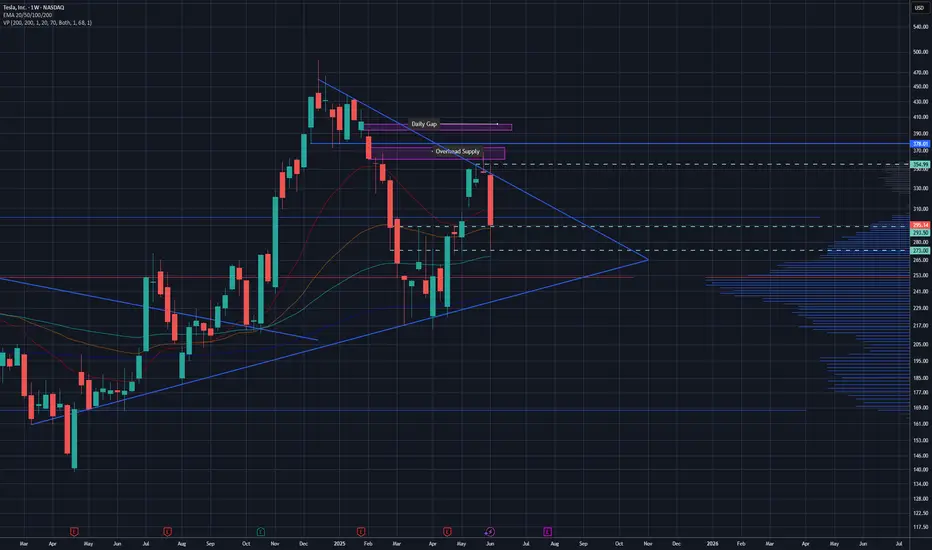
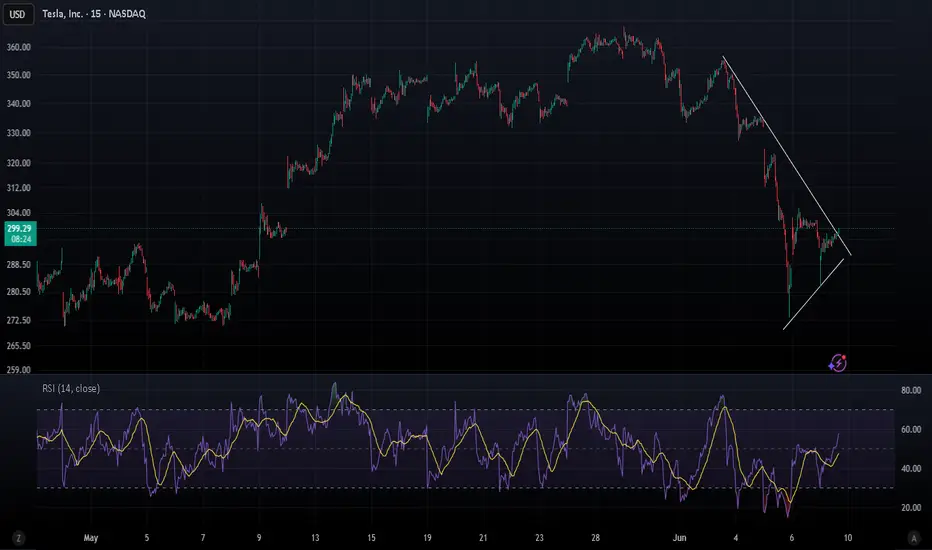
Tesla Update Longs and shorts At the start of the video I recap my previous video and then bring us up to date with the present price action .
In this video I cover Tesla from the higher time frame and breakdown both a long term bullish scenario as well as a local bearish scenario .
Both of these scenarios present longs and short entries for day trade opportunities and swing positions .
Tools used Fibs , TR pocket , Volume profile , Pivots , and vwap .
Any questions ask in the comments
Safe trading and Good luck

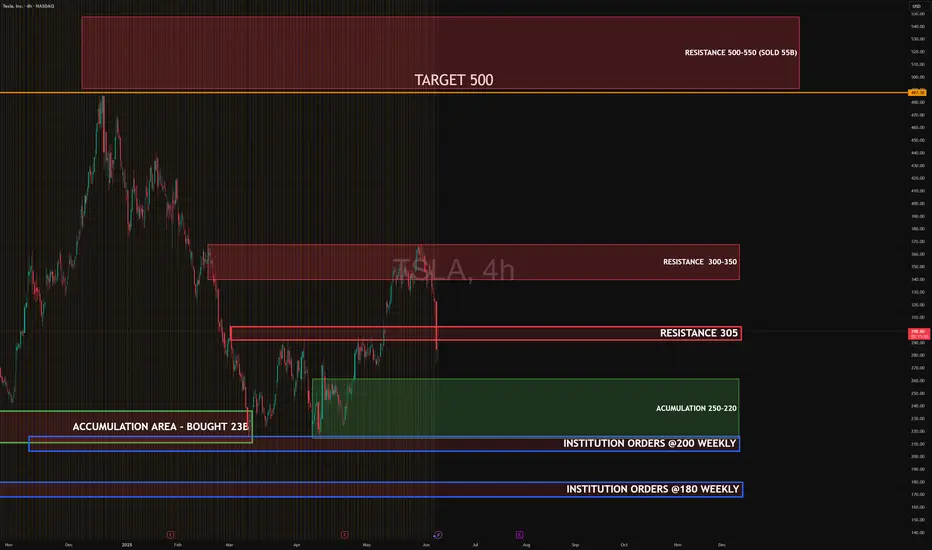
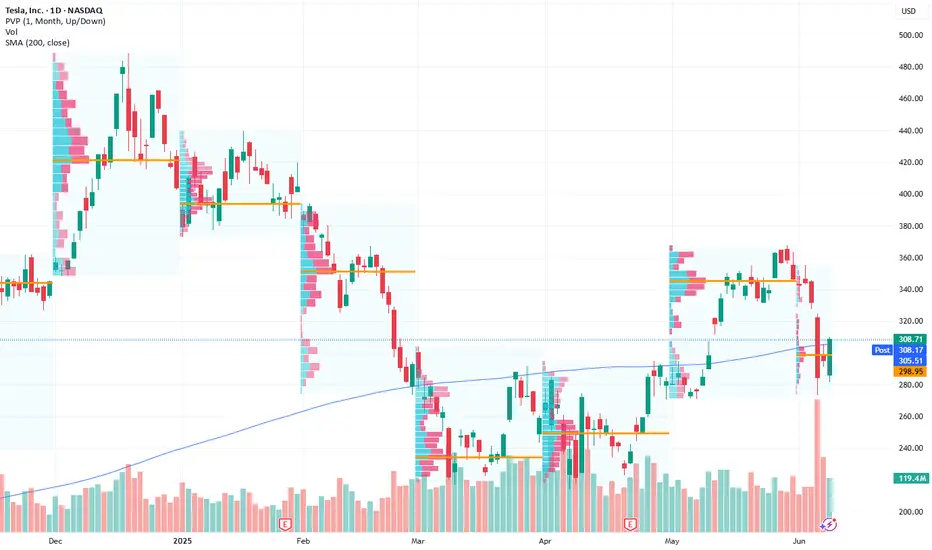
TESLA JUN 2025Tesla ( NASDAQ:TSLA ) rejected from the $305–$350 resistance zone after a strong rally.
Price is now testing the lower end of the previous breakout range, with potential for deeper retracement.
Below $305, the next key support lies in the $250–$220 accumulation zone, where $23B was previously bought.
If this level breaks, watch for possible institutional defense at $200 and $180 weekly, where large orders are sitting.
On the upside, a confirmed breakout above $350 could open the path toward the target zone at $500, although strong resistance is expected between $500–$550, where $55B was previously sold.
#TSLA #Tesla #StockMarket #Trading #VolumeProfile #TechnicalAnalysis #WallStreet
#globaltrade #investment #investing #stockmarket #wealth #realestate #markets #economy #finance #money #forex #trading #price #business #currency #blockchain #crypto #cryptocurrency #airdrop #btc #ethereum #ico #altcoin #cryptonews #Bitcoin #ipo
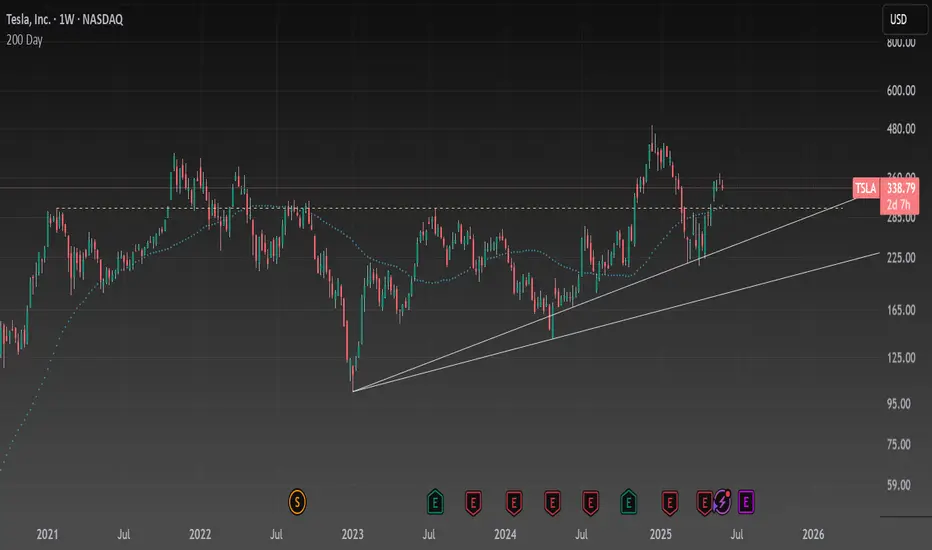
Tesla Monthly TF (Next Target —110-140)I will not bore you with too many details. I will do an analysis based on the moving averages to support my bias, bearish at this point.
April 2024 tests EMA89 as support and this support level holds. This results in a bullish impulse.
The impulse ends December 2024. On the drop, TSLA founds support at EMA55 monthly. There is bounce at this level and this bounce ends as a lower high.
» When this happens, the next moving average in line gets tested, in this case EMA89 or a minimum of 191 as the next target.
EMA55 monthly sits at 229.88 (230). This level will fail as support, why? Because the test of it in March and April led to a lower high and this lower high will be followed by a lower low.
If TSLA had moved higher than December 2024, then any drop or correction would not go below EMA55. Since the action is ending as a lower high, then the next drop which is already underway will break through this level.
The main level for the current move sits around 110-140 based on the long-term. These levels are close to the lows in January 2023 and December 2022.
Technical analysis can help you predict a move regardless of its cause. Don't believe me? See the 'related publications'.
Thanks a lot for your continued support.
Namaste.

Tesla Daily, Update (Bearish Trend Extends)Today TSLA produced the highest bearish volume session since July 2020. This high volume and strong sellers pressure shows up to break EMA55, EMA89 and MA200 daily as support. Needless to say, this is a very strong bearish development.
The break of this long-term support comes after a major lower high. May 2025 much lower compared to December 2024.
My point is to alert you of a much stronger correction than expected on this stock. Now that MA200 has been lost as support, with the highest volume in five years after a strong lower high, we can expect the continuation of the bearish trend.
I will look at Tesla on the monthly timeframe in a separate publication.
Thank you for reading.
Namaste.

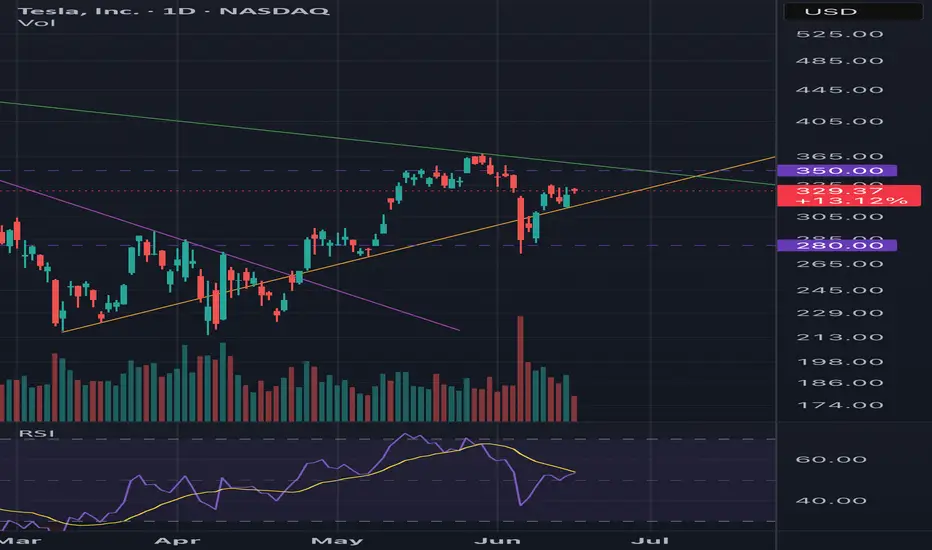
TSLA Bullish to $350I’m still bullish on TSLA. As long as it stays above the orange trend line I expect us to grind higher. RSI is not in overbought territory. $350 is the target.
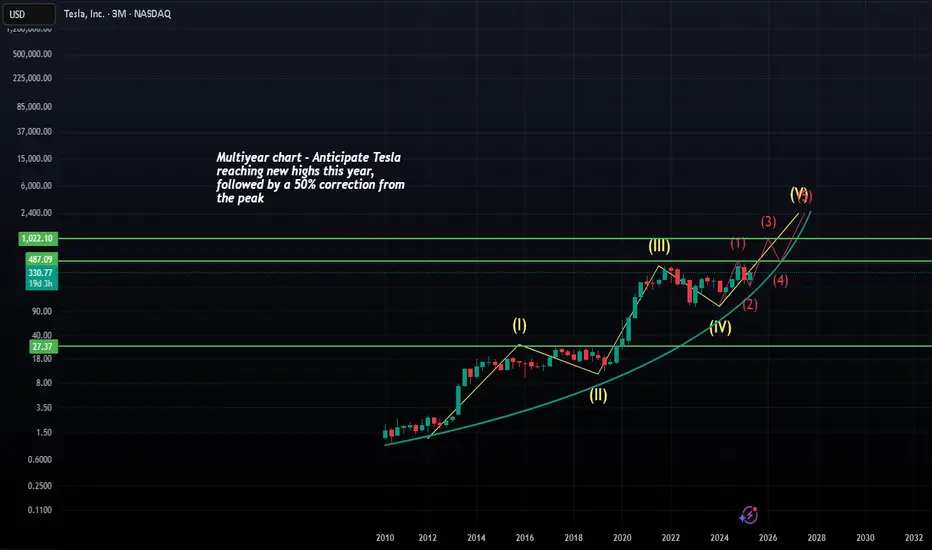
TESLA - Multiyear ChartI'm optimistic about Tesla's long-term prospects, viewing it as a multi-year investment. I anticipate Tesla reaching new highs this year, followed by a 50% correction from the peak to retest the breakout level. With patience, holding for years could yield strong returns.
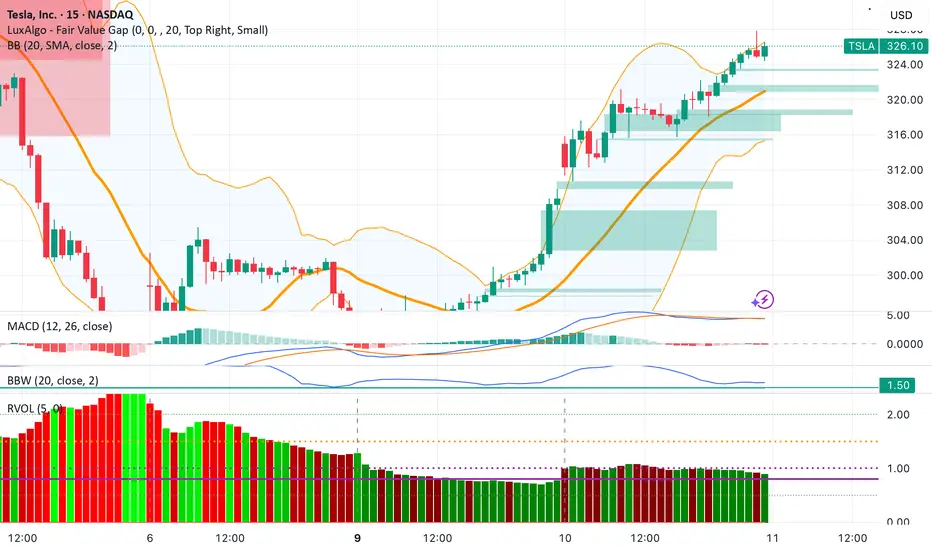
LONG entry @ $316.05 | 09:55am + LONG exit @ $321.05 | 11:20amToday goes to show what happens when you follow structure, and let mat and probability take care of the outcome. An exceptional day, remember... consistent green days are a reflection of discipline, not luck.
Some more pertinent details re price action today. I hit an algo entry at 9:55, MM's did a hard shake out of the weak hands, dropped the price significantly but there was no strong bearish FVG even though price dropped 3 points which gave me conviction to hold the position which paid off very well. There was no significant short move and the price rallied to a weekly high.
Polyanonymous.
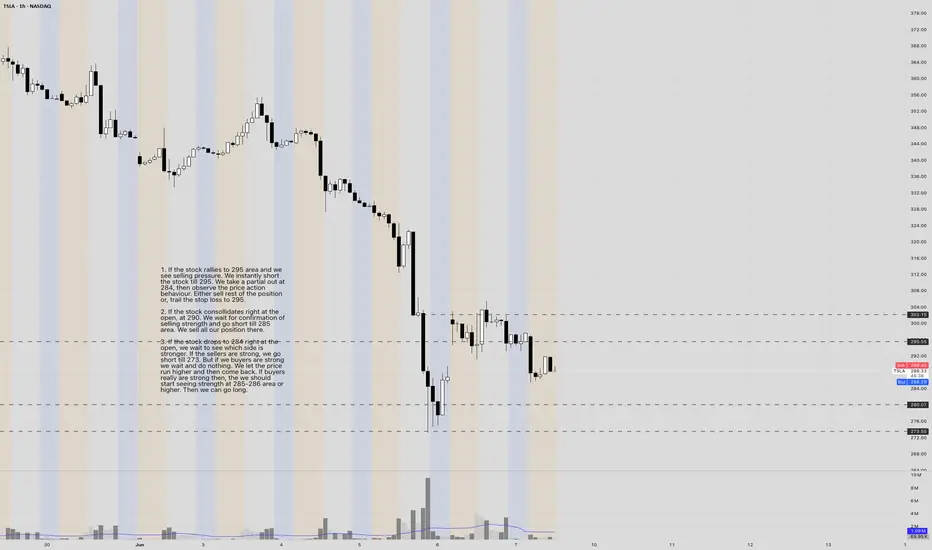
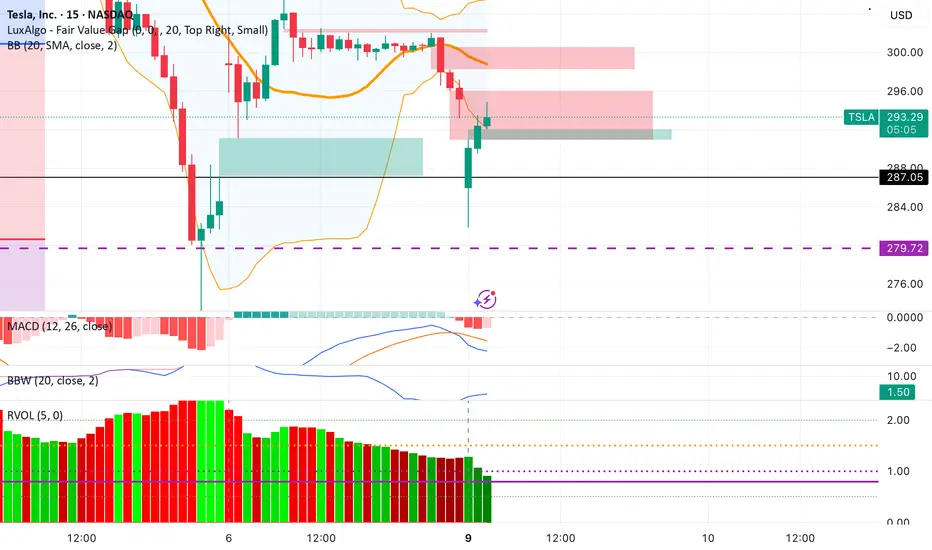
TSLA. SHORT @ 304. SHORT @ 295. LONG @ 284. LONG @ 273. INTRADAYOverview -
The economic calendar is light this week. The stocks previously have shown a trend of being affected a lot more by the news, compared to the economic data. Today, US-China are having talks regarding the trade. The volatility should come from the outcome of the trade discussion. We will not stay in the market for that long. We will only trade the predictable open and call it day.
INTRADAY PLAN -
1. If the stock rallies to 295 area and we see selling pressure. We instantly short the stock till 284. We take a partial out at 284, then observe the price action behavior. We can either sell rest of the position or, trail the stop loss to 273.
2. If the stock consolidates at the open, at 290. We wait for confirmation of selling strength and go short till 285 area. We sell all our position there.
3. If the stock drops to 284 right at the open, we wait to see which side is stronger. If the sellers are strong, we go short till 273. But if we buyers are strong we wait and do nothing. We let the price run higher and then come back. If buyers really are strong, then we should start seeing strength at 285-286 area or higher. Then we can go long.
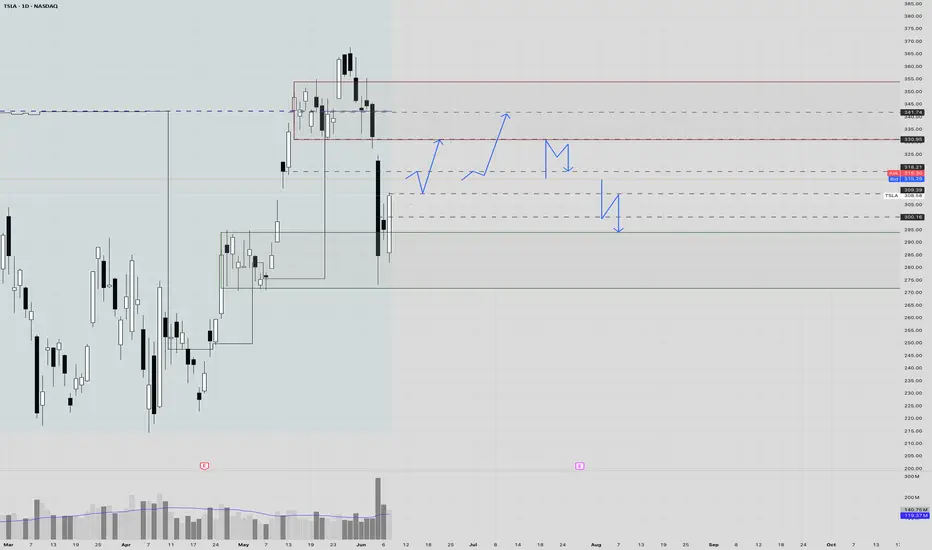
TSLA. LONG @ 309. SHORT @ 330. PIVOT @ 318. INTRADAY 1. If stock doesn't break the 312 level in the pre-market and ends up rallying to 318, where we see a little selling strength. We wait. We let the price come down and wait for the buyers to make the following moves.
If the buyers step in at 316+, we go long till 341.
If the buyers step in at 309+, we go long till 330.
2. If the stock blows past 318 and directly rallies to the 330 area, we wait for the sellers to show themselves. If the sellers starting showing desperation in the 330 area, we go short, till 318.
3. If the stock opens, 309 support fails and the stock directly drops to the 300 zone. We wait for a good entry at 309 zone and go short from there till 295.
TSLA: $300 is an important numberOver the past 5 years, $300 has been a very important price point -- both in support and resistance. Only once have we converged with the 200 day at $300 mark, and that was when we were hitting it as resistance. We are now in a position to do the same from the position of support. I think a similar yet opposite pattern should unfold if we move to this range.
Outside all that, we continue to maintain a cup and handle pattern. We are also maintaining higher lows.
Bullish signals and patterns outweigh the bearish in my eyes.
Best of luck.
The Trump & Musk Friends Again - Tesla RippingAnalysts attribute the recovery to cooling tensions between Elon Musk and President Donald Trump, which had previously weighed on investor sentiment.
Additionally, Tesla's upcoming robo-taxi launch on June 12 is generating excitement, with some analysts predicting it could be a major revenue driver. However, concerns remain about Tesla's valuation, as it trades at a price-to-earnings ratio of 192, significantly higher than traditional automakers.

Tesla's Bullish Momentum Points Towards $312 Target
Current Price: $295.14
Targets:
- T1 = $304.50
- T2 = $312.90
Stop Levels:
- S1 = $289.00
- S2 = $282.50
**Wisdom of Professional Traders:**
This analysis synthesizes insights from thousands of professional traders and market experts, leveraging collective intelligence to identify high-probability trade setups. The wisdom of crowds principle suggests that aggregated market perspectives from experienced professionals often outperform individual forecasts, reducing cognitive biases and highlighting consensus opportunities in Tesla.
**Key Insights:**
Tesla continues to demonstrate strong fundamentals backed by innovation in electric vehicles (EV) and sustainable energy solutions. Recent advancements in battery technology, coupled with expansion plans in international markets, are expected to drive significant growth over the next quarter. Technically, the stock shows consistent support levels formed during consolidation phases, suggesting a low-risk entry point for a bullish position. Market momentum indicators signal improving buyer strength, reinforcing the outlook for a continued rally.
**Recent Performance:**
Tesla's stock has shown resilience in the face of broader market volatility. Over the past two weeks, Tesla has moved within a tight range, suggesting accumulation by institutional investors. The recent stabilization around $290-$295 indicates that previous resistance levels have now turned into support, paving the way for further price movement towards higher targets.
**Expert Analysis:**
Analysts at major investment firms have reiterated confidence in Tesla's capacity to maintain its leadership in the EV market. Factors such as improved gross margins, strong quarterly delivery numbers, and strategic partnerships contribute to an optimistic outlook. From a technical standpoint, the stock's moving averages show bullish alignment, indicating sustained upward momentum. Volume analysis portrays strong buying activity, further validating bullish momentum.
**News Impact:**
Positive sentiment has surged following Tesla's announcement of doubling production capacity at its key Gigafactories, including its Nevada facility. Additionally, international regulatory approvals for Tesla's next-generation vehicles have fostered enthusiasm among investors. Broader sector movements, supported by potential shifts in Federal Reserve policy, also boost Tesla's trading outlook.
**Trading Recommendation:**
Tesla offers an attractive long setup for traders looking to capitalize on both fundamental and technical strength. A bullish position at current levels aligns with professional trading insights, with reasonable targets set at $304.50 and $312.90. Recommended stop levels are placed at $289 (S1) and $282.50 (S2), ensuring risk management while allowing room for volatility. With favorable macroeconomic factors improving the environment for growth stocks, Tesla remains a strong candidate for upside potential in the short-term.
Bulls FailedThe bulls seem to have not the power to bring the stock back up and to close the window of June 5th. The support zone seems to halt.
It is a very strong one lasting since March.
Tesla - Short Term Chart, Bullish BreakoutTesla is surging after a significant pullback. Could this be a turning point? I'm optimistic about Tesla's long-term potential and have been holding for the long haul, anticipating new highs in the future.
Todays Entry @ $288.45 @ 09:35am | Exit @ $293.03Pre Trade Prep:
EMOTIONAL STATE = 8
TIREDNESS = 7
Execute your edge with robot like consistency, let me the math win for you over the long term.
A surgeon doesn't not operate because his last patient died.
The battle is won before the opening bell rings.
Visualise winning and losing scenarios.
--------
1) Am i physically and mentally ready to trade?
2) Do I have clear plans for todays trades.
3) Am i prepared to walk away if there is no set up?
-------
Today, I will only trade what the system confirms.
Today, I will accept losses with composure.
Today, I will protect my emotional capital.
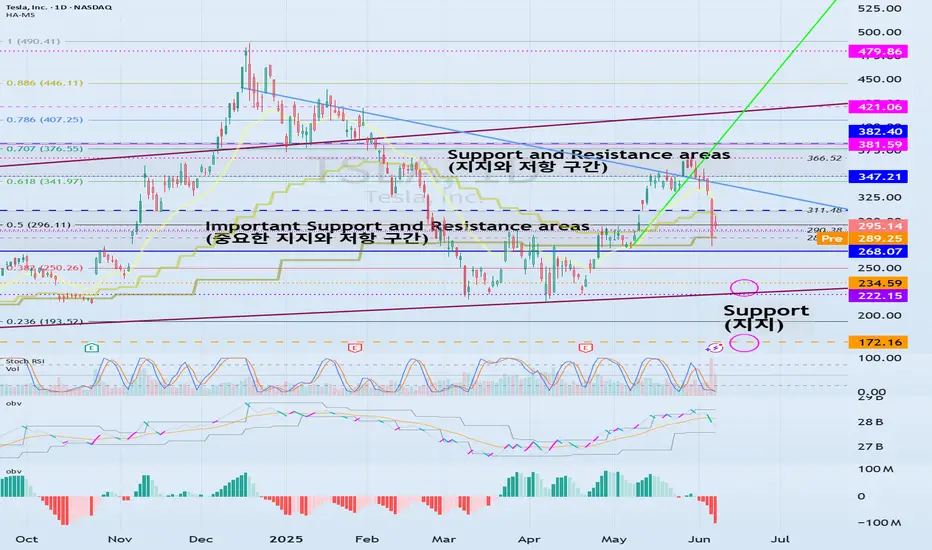
Important support and resistance sections: 267.07-311.48
Hello, traders.
If you "Follow", you can always get new information quickly.
Have a nice day today.
-------------------------------------
(TSLA 1D chart)
If you see support within the important support and resistance sections, it is a time to buy.
However, if a strong decline occurs, strong buying is expected around 172.6-234.59.
It is expected to be an important buying period for long-term investment.
-
Thank you for reading to the end.
I hope you have a successful transaction.
--------------------------------------------------
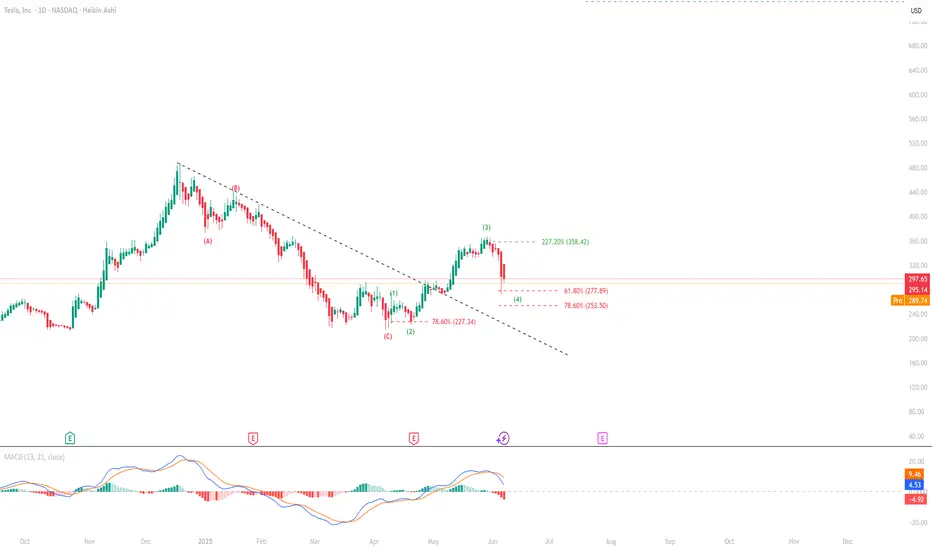
Nothing to Be Afraif Of!- Tesla has historically traded at high valuation multiples—and still does. But since its investor base is driven by excitement for the future and a love for innovation, it's unclear how much those valuation metrics really matter.
- After the first higher low structure following a corrective price wave, Tesla surged as much as 227.60%, before facing selling pressure. We're now tracking the second impulsive wave's retracement, particularly the 61.8% and 78.6% Fibonacci levels.
- Trying to catch the bottom at these levels is pointless. It's better to wait for 2–3 green Heikin Ashi candles and confirmation that these levels are holding.
- Current positions can be held. If you want to sell, go ahead—but remember this: No one has stayed optimistic about Tesla for more than two months. So, there's no need to panic.
Elon vs. Trump Drama, But the Chart Speaks LouderTesla closed at 300.63 with a strong 5.42% jump, but the rebound looks more technical than solid. RSI is at 43.90, still in bearish territory, and the stock hasn’t recovered from the recent drop from 360. The 305–310 zone is key — if it fails to break above that with volume, it might drop back to 280 or even 260.
On top of that, the growing tension between Trump and Elon Musk could weigh on market sentiment, especially with the upcoming election and possible regulatory concerns.
Bottom line: the move up doesn’t look convincing yet. Watch price action and volume closely in the next few days.
#TSLA #Tesla #TechnicalAnalysis #StockMarket #WallStreet

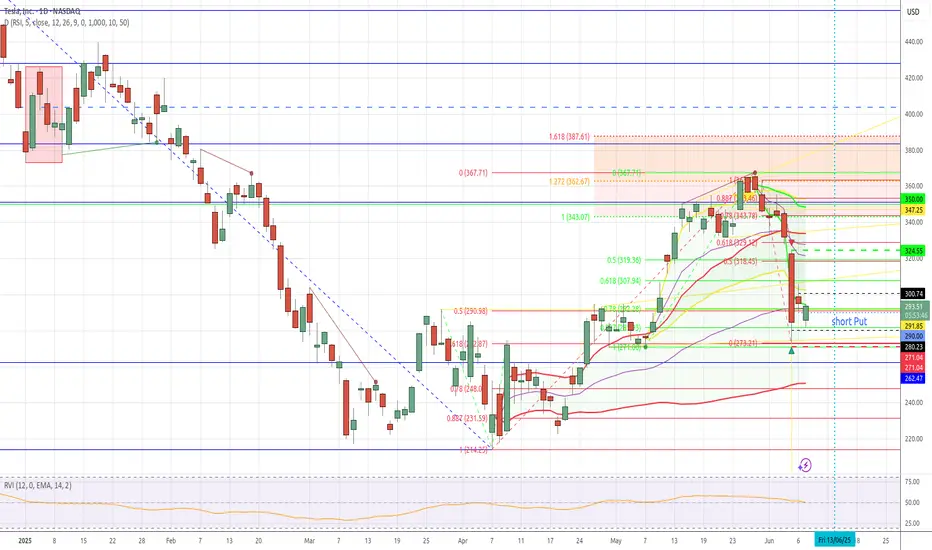
TSLA cup and handle INVALIDATEDThe TSLA cup and handle breakout case has been invalidated as of Thursday June 5th of this past week. The start of the week showed lack of conviction in the follow through to and over the 360 price level, where sellers stepped up. This indicated a slowdown in bullish momentum and a weakening trend early in the week. The ultimate catalyst that caused the breakdown for TSLA was, of course, the public breakup of Musk and DJT over social media platforms. This caused a "waterfall effect" of intense selling pressure through low volume zones from ~330 to the high volume node and put wall at the 280 level. Price ended up overshooting 280 but ended up reclaiming that level by the end of the session and bounced higher the following day. At this point, the weekly and daily charts are showing a short term wedge formation that may take some weeks to play out. There has not been signs of big institutional buying at the these levels as of now, and as such I suspect that there may be a bit more downside these coming weeks. My current idea is a short/put position under 293.5 to about 273, with a maximum target of 250. If price ends up at or near 250 levels, I would look to start a long position for a play back up to the 300 level.