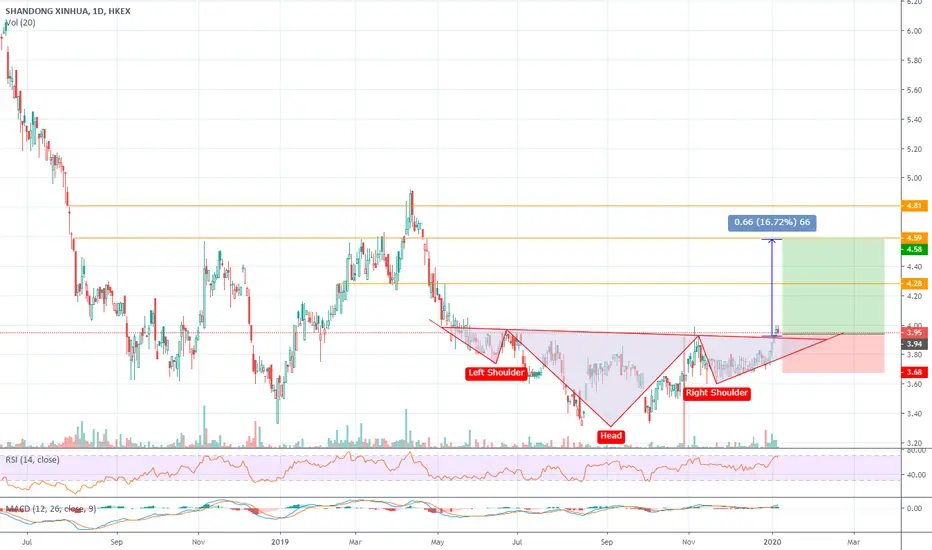
HKEX:719 Short term 20 days. Potential profit 16%HKEX:719 has a head and shoulder pattern. The target is near the previous resistance.
Buy in @3.94
Cut loss @3.68
Target @4.58
Next report date
—
Report period
—
EPS estimate
—
Revenue estimate
—
0.080 EUR
63.35 M EUR
1.13 B EUR
174.46 M
About SHANDONG XINHUA PH
Sector
Industry
CEO
Wen Hui Xu
Website
Headquarters
Zibo
Founded
1943
ISIN
CNE100000411
FIGI
BBG000CDQCM8
Shandong Xinhua Pharmaceutical Co., Ltd. engages in the development, production and sales of pharmaceutical and synthetic chemical products. It operates the business through the following segments: Bulk Pharmaceuticals, Preparations, Chemical and Other Products. The firm's products include analgin, caffeine, amidopyrine, ibuprofen, theophylline, aspirin, hydrocortisone and pipemidic acid. The company also sells pharmaceutical raw materials, preprations, antibiotic preparations, herbal medicine, biological products, medical appliances, chinese medicines and beauty products. Shandong Xinhua Pharmaceutical was founded in 1943 and is headquartered in Zibo, China.
Related stocks
Summarizing what the indicators are suggesting.
Oscillators
Neutral
SellBuy
Strong sellStrong buy
Strong sellSellNeutralBuyStrong buy
Oscillators
Neutral
SellBuy
Strong sellStrong buy
Strong sellSellNeutralBuyStrong buy
Summary
Neutral
SellBuy
Strong sellStrong buy
Strong sellSellNeutralBuyStrong buy
Summary
Neutral
SellBuy
Strong sellStrong buy
Strong sellSellNeutralBuyStrong buy
Summary
Neutral
SellBuy
Strong sellStrong buy
Strong sellSellNeutralBuyStrong buy
Moving Averages
Neutral
SellBuy
Strong sellStrong buy
Strong sellSellNeutralBuyStrong buy
Moving Averages
Neutral
SellBuy
Strong sellStrong buy
Strong sellSellNeutralBuyStrong buy
Displays a symbol's price movements over previous years to identify recurring trends.
Frequently Asked Questions
Depending on the exchange, the stock ticker may vary. For instance, on FWB exchange SHANDONG XINHUA PHA.H YC1 stocks are traded under the ticker XIN.
Yes, you can track SHANDONG XINHUA PHA.H YC1 financials in yearly and quarterly reports right on TradingView.
SHANDONG XINHUA PHA.H YC1 is going to release the next earnings report on Aug 22, 2025. Keep track of upcoming events with our Earnings Calendar.
XIN earnings for the last quarter are 0.02 EUR per share, whereas the estimation was 0.03 EUR resulting in a −44.44% surprise. The estimated earnings for the next quarter are 0.02 EUR per share. See more details about SHANDONG XINHUA PHA.H YC1 earnings.
XIN net income for the last quarter is 14.23 M EUR, while the quarter before that showed 16.93 M EUR of net income which accounts for −15.92% change. Track more SHANDONG XINHUA PHA.H YC1 financial stats to get the full picture.
SHANDONG XINHUA PHA.H YC1 dividend yield was 5.17% in 2024, and payout ratio reached 40.16%. The year before the numbers were 4.74% and 33.52% correspondingly. See high-dividend stocks and find more opportunities for your portfolio.
Like other stocks, XIN shares are traded on stock exchanges, e.g. Nasdaq, Nyse, Euronext, and the easiest way to buy them is through an online stock broker. To do this, you need to open an account and follow a broker's procedures, then start trading. You can trade SHANDONG XINHUA PHA.H YC1 stock right from TradingView charts — choose your broker and connect to your account.