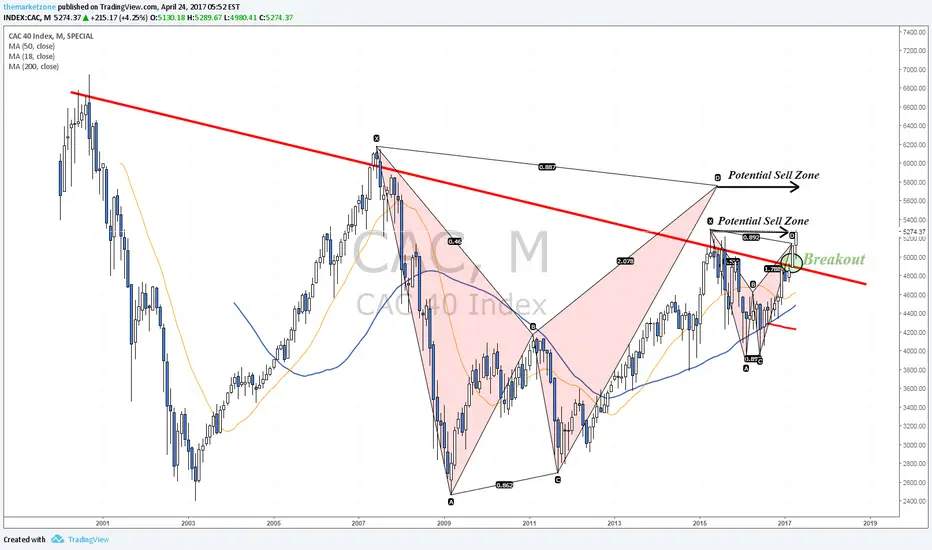
Testing weekly harmonic pattern - Is it heading to 6000? Even before yesterday's results, the French CAC40 provided a bullish long term signal when it broke above a monthly downtrend line.
The CAC40 is testing the X point of a bearish Bat pattern (similar to what we see in German DAX) and if it'll break and close above it, it can continue all the way up to 6000 to test a bigger PRZ.
FRA40 trade ideas
CAC40 Post French ElectionsCAC 40 went to its highest high since almost 2 years. Could that be potentially the top???

CAC 40 (1D) Bearish Bat or Weekly Bat?If the bulls break the 5100.0 zone then I'll re position to the weekly higher bear zone. I just want to sell when the price is high. Vive Le France

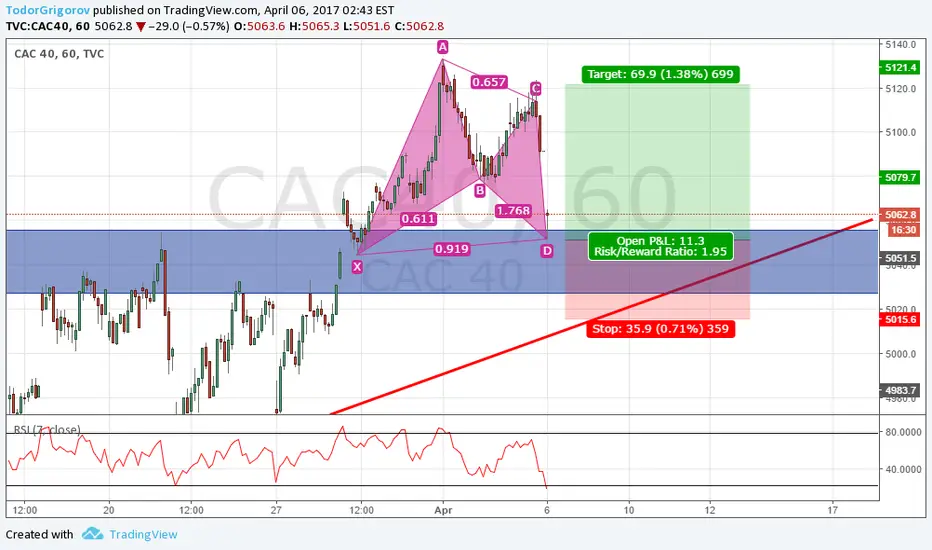
FRA40 just complete harmonic Bat patternFRA40 just complete harmonic Bat pattern.
Pay attention to 5000.
If price can not get support,you can keep to 4400

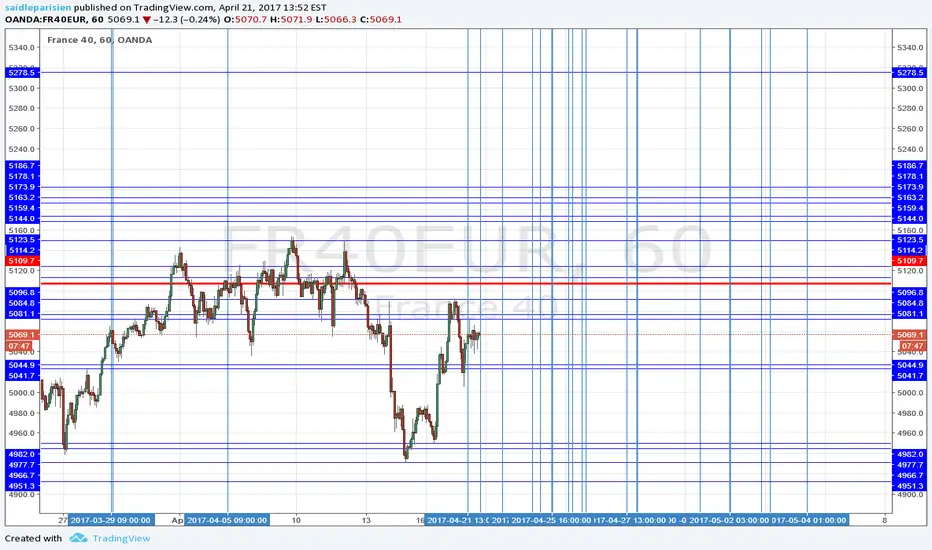
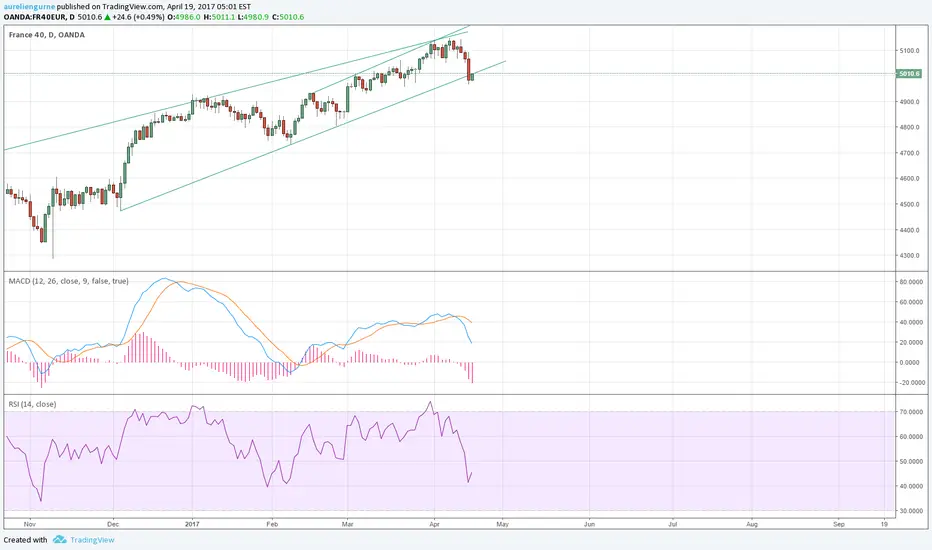
France 40Possibility to SHORT if breakdown of the trend line.
Possibility to LONG if no break down of the support line.
Possibility to go SHORT if reaches the resistance line.
I am a new trader, any thought on the current situation? :)
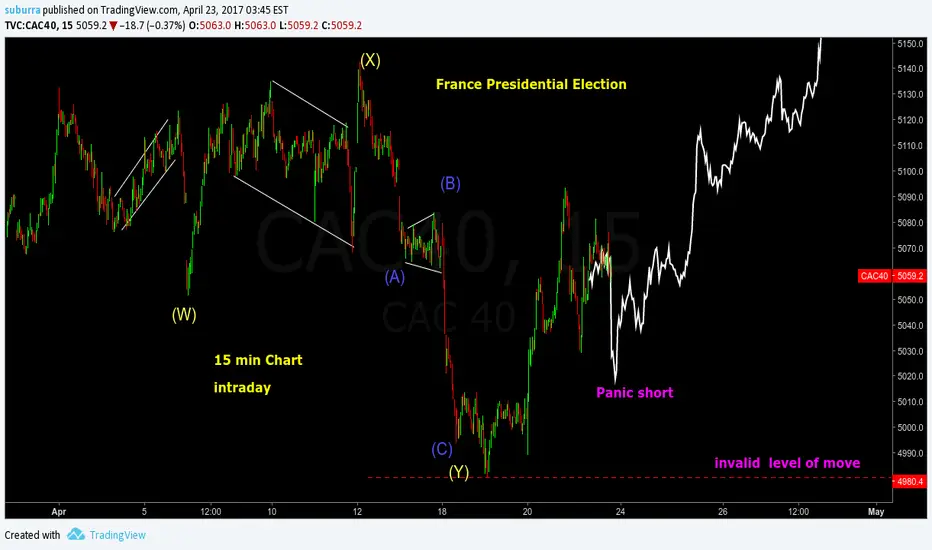
The French Election Is Going To Trigger The Next Major MoveThe upcomming french election is goint to trigger the next major move at least for all European Stockmarkets.
Technical Analysis can not predict in wich direction this move will go.
Yesterdays Charts can´t what will happen on Monday April 24th 2017 or on Monday 05/08/ 2017. The result of the France Election will be to powerfull and is going to trigger the next major move for global stockmarkets. Whoever is able to predict the result of the France Election will beat the markets.


LONG CAC40 gartley Nice Gartley setup on the CAC index. Reason for entry RSI oversold aswell we have some structure. I will wait for higher high close confirmation. Have in mind that on Weekly and Daily TF we have been oversold on RSI so there could be move downward. But as a whole i believe we will test previous highest highs soon and we are in a bullish trend
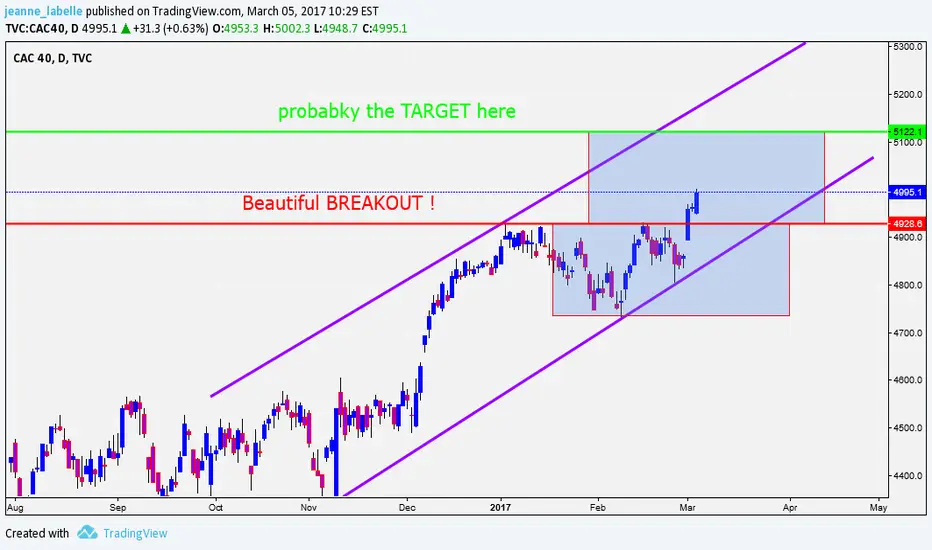
EUROPE - CAC40... BULL BULL...
Hello everybody,
Probably a bullish movement for CAC40.
Target about 5122.
Trade witn care of course
Bye
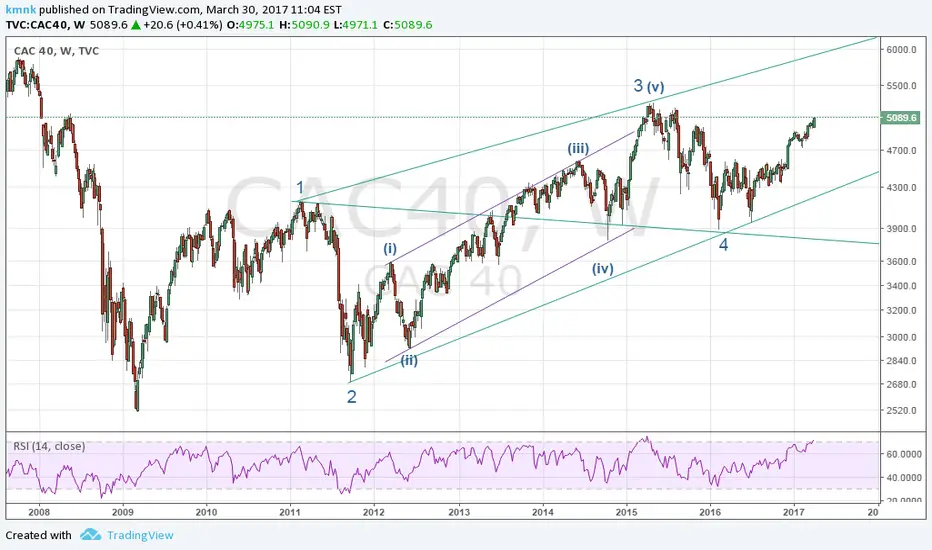
Is CAC40 Running to Final?Elliott Wave Princible says that CAC40 is about to complete the wave counting with a final wave 5.
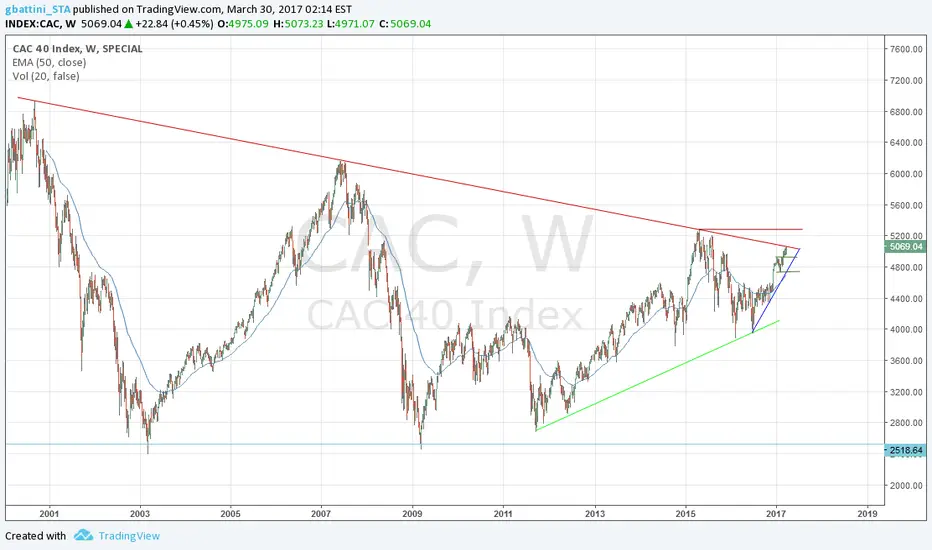
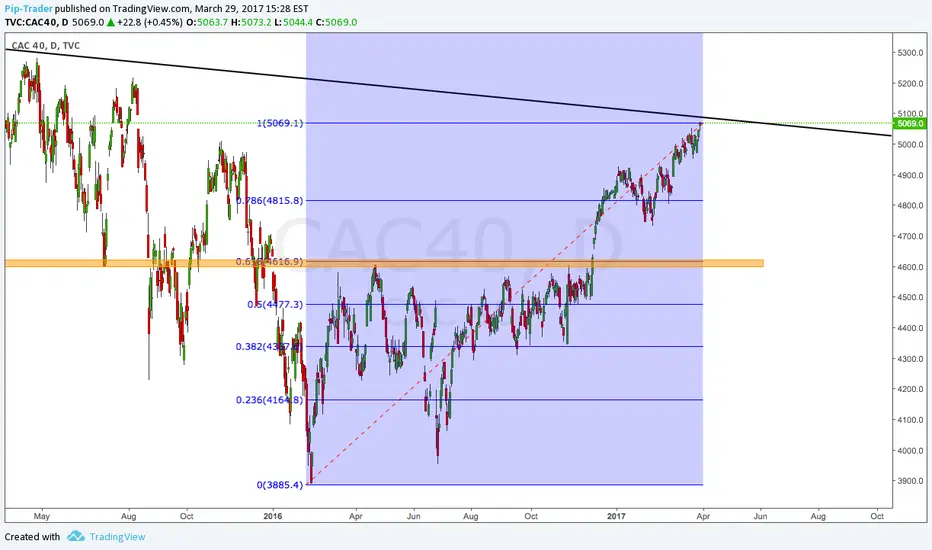
CAC 40 - Pivotal pointBy closing at 5069.04, the CAC reached its long term down trend and is now at a pivotal point.
Using weekly prices, the recent uptrend looks still solid with no sign of regression with any relevant indicators.
However, using daily prices, 2 keys indicators, momentum and RSI show a regression synonym of short term weakness which could prevent the index to go through and keep it in the current long term downtrend initiated in Sept 2000 and June 2007.
In case of breakout, the CAC the first resistance stands at 5283.
On the other hand, a return back to 4929 then 4733 will be on the cards. Anything below the latter would annihilate the current uptrend