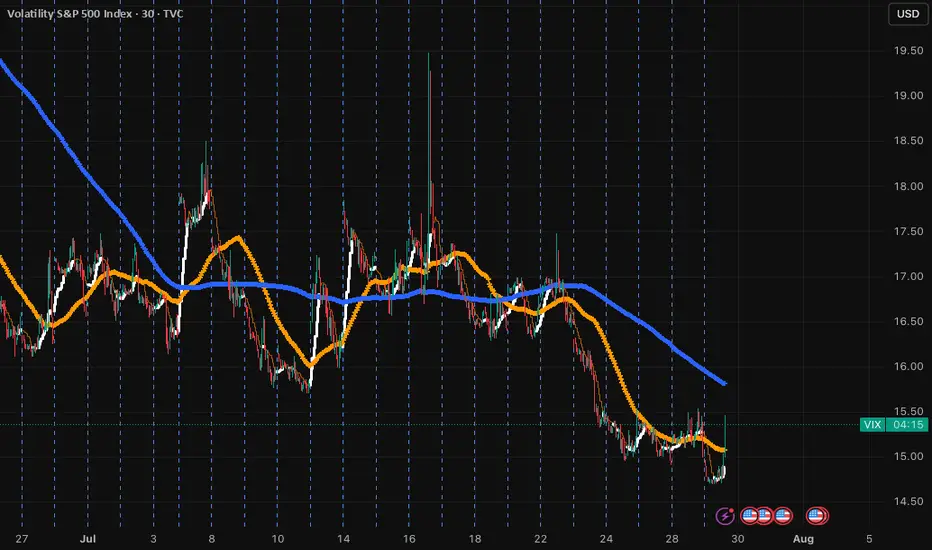
VIX Alarting !when VIX Reach Red Zone.
It consider as Extreeemeee Greeeed !!.
100% market will take U-Turn direction which will be Red in Up coming days !
although im day trading im good and never keep money in market after close.

I told you so....VIX is the golden goose! All this fake pump in the market was just not sustainable. It is very clear that there are holes and the money printing can't last forever. The S&P fake pumps, and artificial tariffs (which Americans pay 90%) are created out of thin air. The reality is that defaults are very high across the board fo
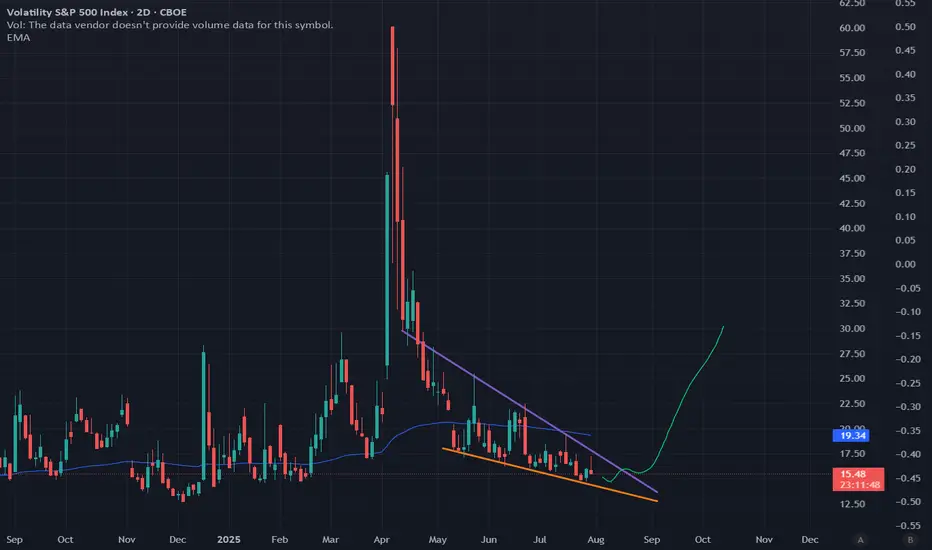
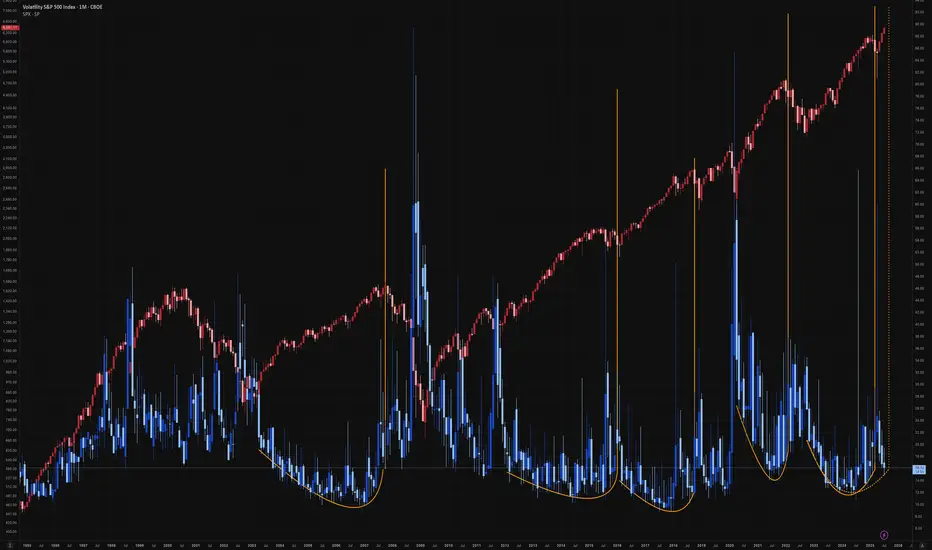
Unprecedented VOL suppression will lead to VIX October explosionAccording to my discussions with ChatGPT and analyzing various metrics we are currently in one of the longest periods, if not *the longest* period, of Vol suppression in the entire history of volatility.
Zooming out and looking at the current chart pattern VIX is very clearly in a falling wedge,
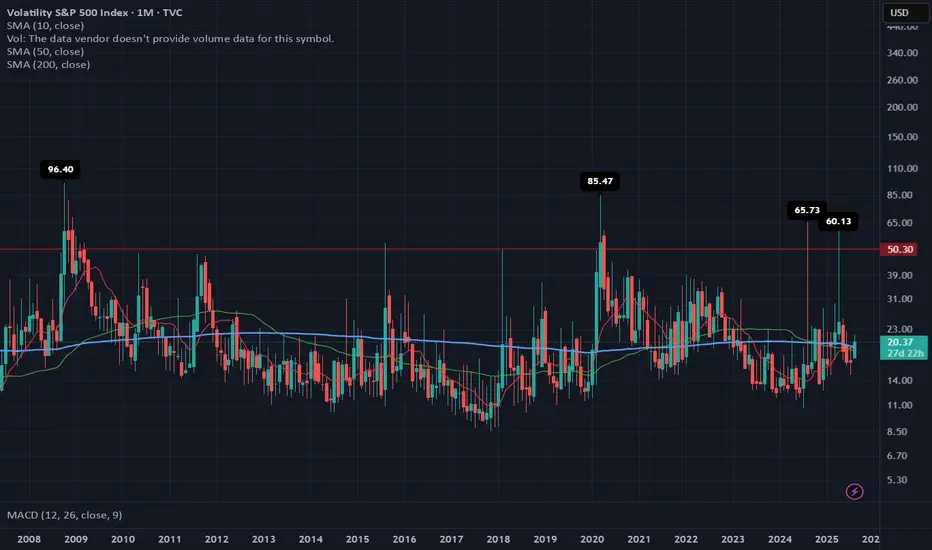
VIX: From “Calm Tension” to a ReboundWhy does a small uptick matter today… if we’ve already seen 60+ readings four times in the past 17 years?
The first week of August 2025 brought back a familiar market force: volatility.
The VIX, which tracks expected fluctuations in the S&P 500, jumped 21% in just a few days, rising from 17.4 to 20
VIX Crab VIX is likely to rise from $17.4 upon reaching it, positioned at the leg of the Crab Pattern, potentially advancing towards the targets (TP #1 - TP #3).
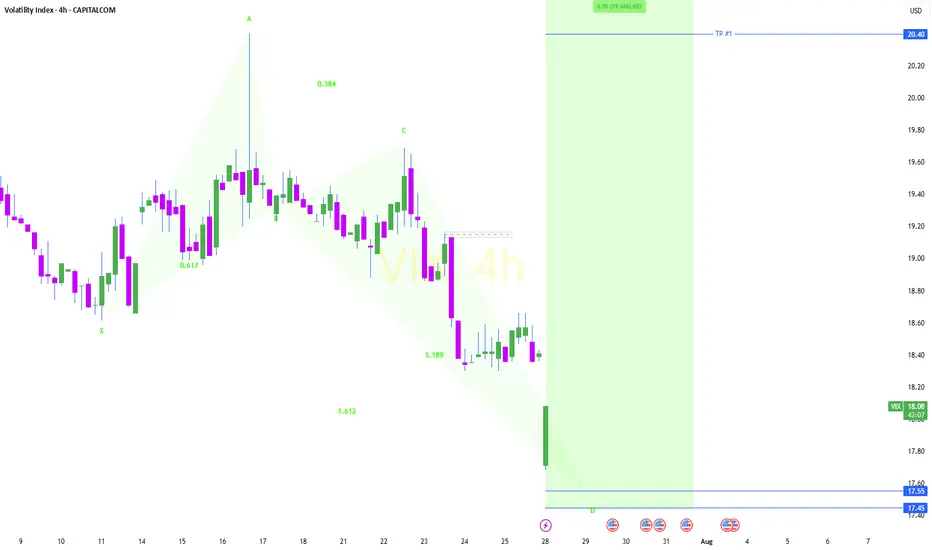
The VIX will be soon very positive.Fasten seatbelts!!!
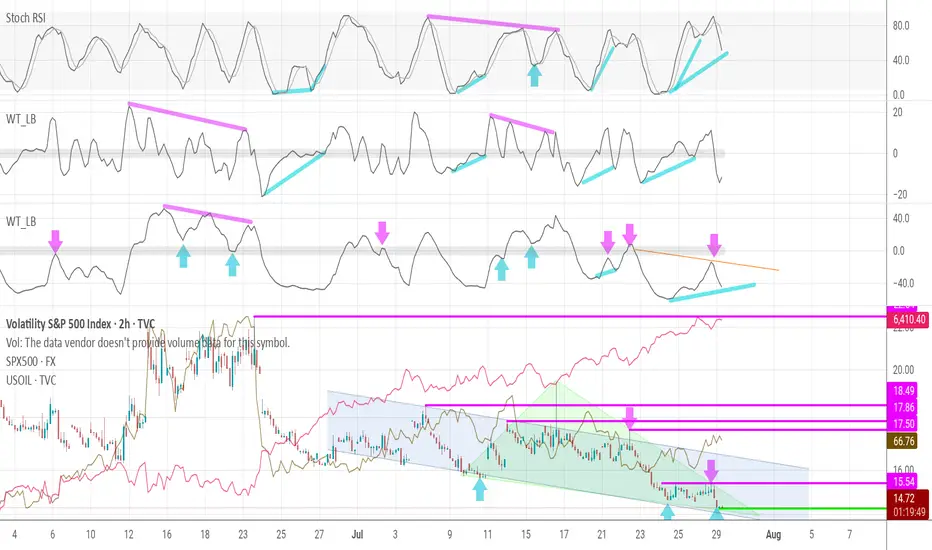
As you can see:
Triangle pattern.
Indikator divergencys.
Greed maxium.
15.40This channel is not providing individualized trading or investment advice, nor is it a banking service, brokerage service, trading service, investment service or money management service

Weekly Volatility ReadGood Evening --🌗 🌕🌓
I hope everyone is having a relaxing weekend with friends and family alike because soon we will be in the thick of the price action again -- and it may get spicy! Let't us dive in as we review what happened last week and we look towards the next to trade range or observe.
The
23This channel is not providing individualized trading or investment advice, nor is it a banking service, brokerage service, trading service, investment service or money management service

What will go down VIX or SPX?When SPX pushes fresh highs while the VIX floor makes higher lows, fragility rises.
This post is for informational/educational purposes only and is not investment advice or a solicitation to buy/sell any security. Past performance is not indicative of future results. I may hold positions related t
See all ideas
Displays a symbol's price movements over previous years to identify recurring trends.
Frequently Asked Questions
Volatility Index Future (VIX) reached its highest quote on Apr 7, 2025 — 45.760 USD. See more data on the Volatility Index Future (VIX) chart.
The lowest ever quote of Volatility Index Future (VIX) is 11.985 USD. It was reached on Dec 14, 2023. See more data on the Volatility Index Future (VIX) chart.
Volatility Index Future (VIX) is just a number that lets you track performance of the instruments comprising the index, so you can't invest in it directly. But you can buy Volatility Index Future (VIX) futures or funds or invest in its components.