DXY Just Broke Through the Lock… Where’s the Market Headed Now?🌅 Good Morning, Friends!
A few days ago, I marked 98.950 as a key threshold for the DXY index. As of today, that level has officially been broken—and the bullish momentum we anticipated is now kicking in. 📈
The next target? 101.000.
That said, it’s crucial to remember: DXY is heavily influenced b
NFP Volatility Ahead – Is the Dollar Ready to Break Higher?🟢 DXY Outlook – A Key Day for the Dollar Index
Yesterday’s monthly candle closed with strong bullish momentum, marking a powerful start to August. Today, on the first trading day of the month, we’re expecting three major U.S. economic releases:
NFP, Average Hourly Earnings (m/m), and the Unemployme
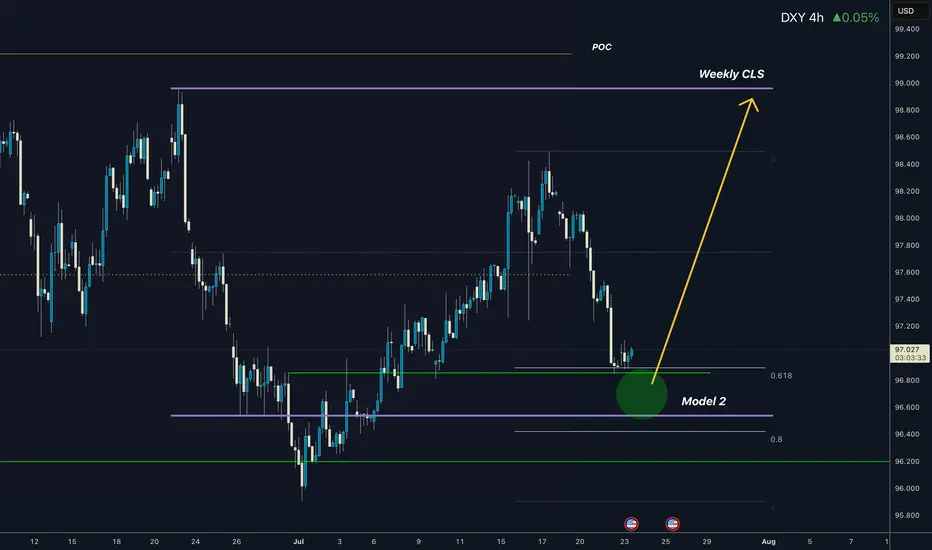
Dollar I Weekly CLS I Model 2 I Ready for pullbackYo Market Warriors ⚔️
Fresh outlook drop — if you’ve been riding with me, you already know:
🎯My system is 100% mechanical. No emotions. No trend lines. No subjective guessing. Just precision, structure, and sniper entries.
🧠 What’s CLS?
It’s the real smart money. The invisible hand behind $7T/d
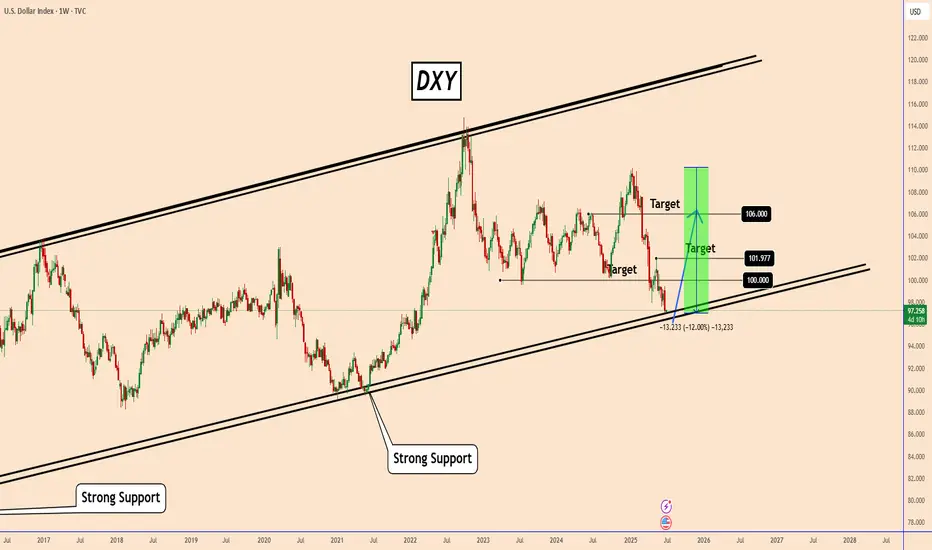
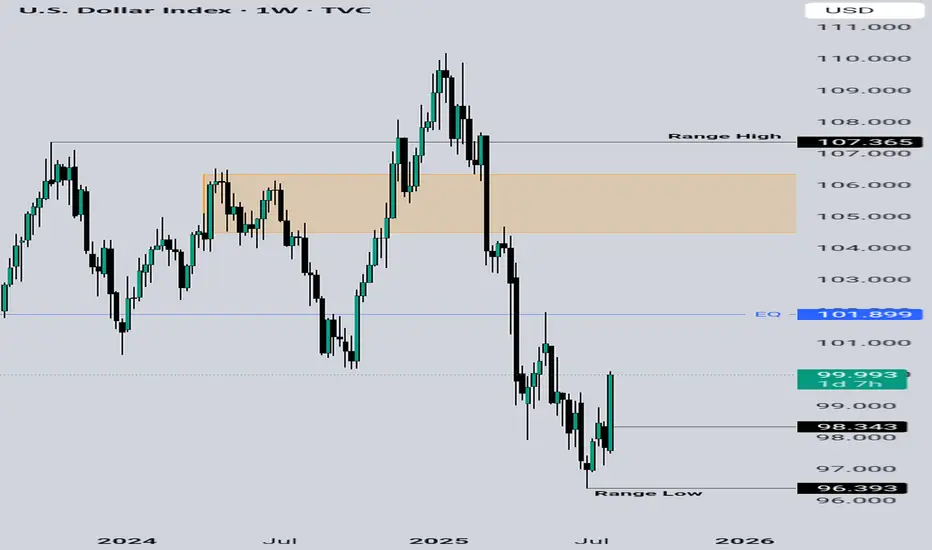
DXY: Weekly OutlookWeekly DXY Outlook
On the weekly chart, the US Dollar Index (DXY) has reached a critical zone that was last tested in February 2022.
While a rebound is not guaranteed, the fact that the DXY has declined nearly 12% over just six months—despite a resilient U.S. economy—suggests the potential for re
KOG - DXYDXY
As we can see here we've hit and breached the target level we gave a few weeks ago on the dollar. We're now at a red box level that can cause a temporary tap and bounce unless it's broken, so we'll keep an eye on this.
As always, trade safe.
KOG

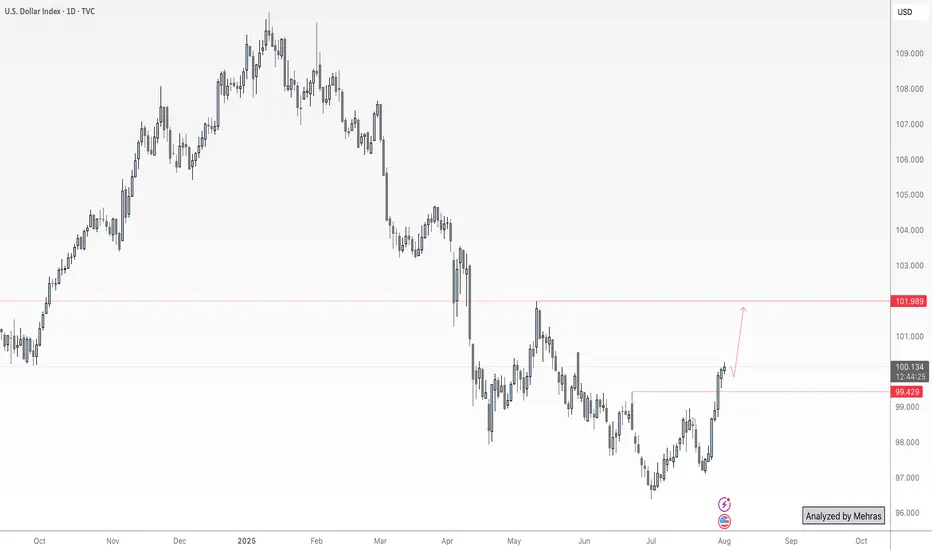
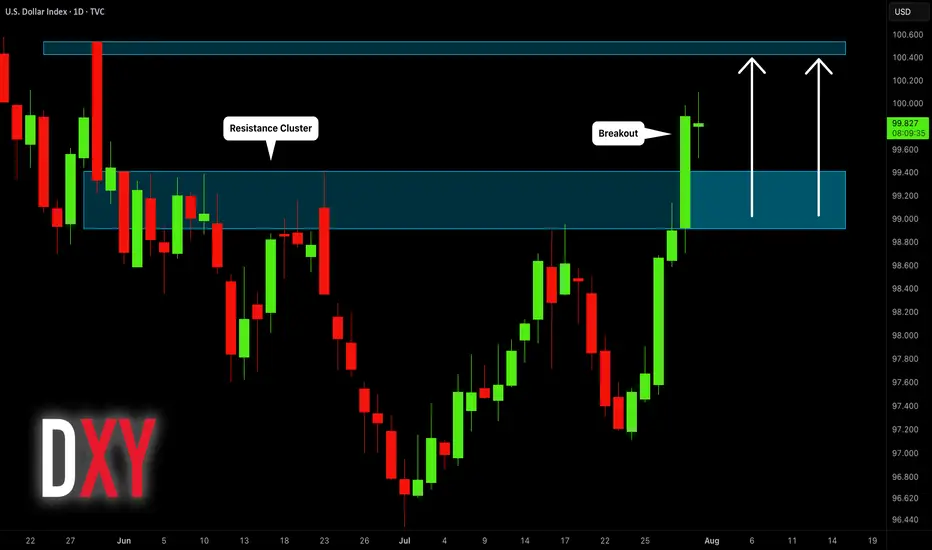
Dollar Index (DXY): Will It Rise More?!
Dollar Index is on its way to 100.4 resistance.
A breakout of a major supply cluster on a daily after FED meeting
yesterday indicates a strong bullish pressure.
I think that growth will continue soon.
❤️Please, support my work with like, thank you!❤️
3rd August 2025 Daily Analysis For DxyDAILY DXY ANALYSIS FOR 3RD AUGUST 2025. Looking to see this setup play out completely on DXY . Will be focused on selling Gu and EU when the DXY setup start playing out

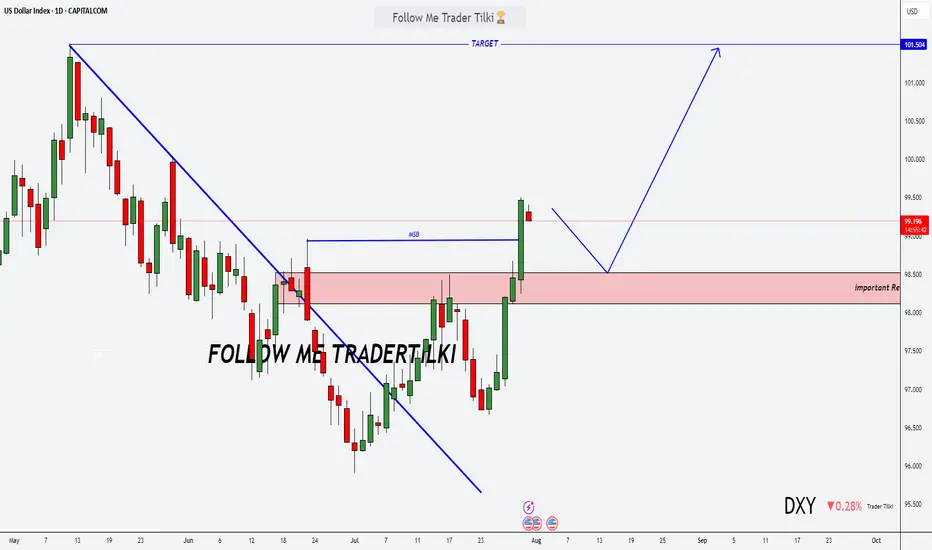
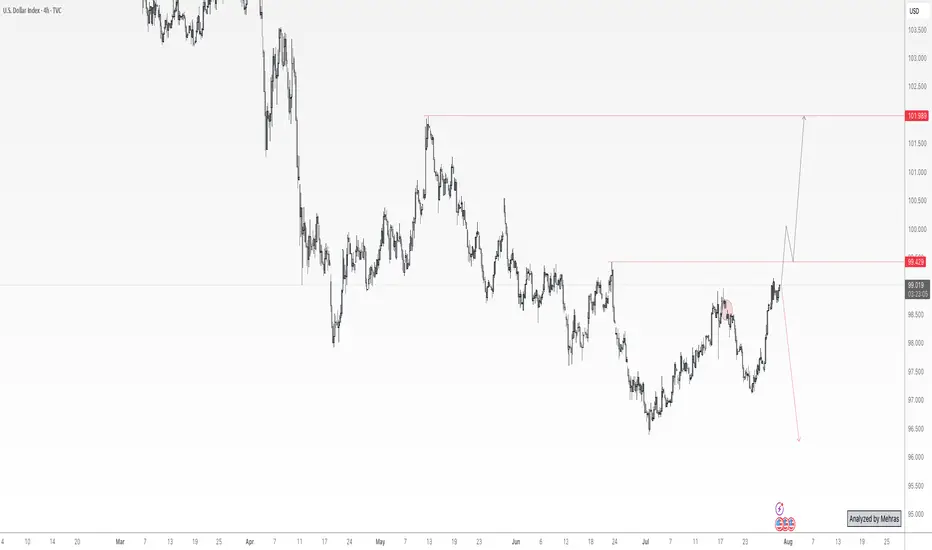
DXY Bulls Ready — Can Powell Spark the Rally?📊 DXY Pre-FOMC Outlook
In my previous analysis released on Monday, I expected the Dollar Index to fill the gap around the 98.60 zone and range below the key red line at 99.429.
Now, with less than 8 hours left until the highly anticipated FOMC rate decision, it’s time to take a closer look at tonig
Bullish on The US Dollar Currently short term bullish on the dollar until it gets to the orange box. A retracement lower to accelerate the move higher is permitted. Let's see how this unfolds in the coming weeks
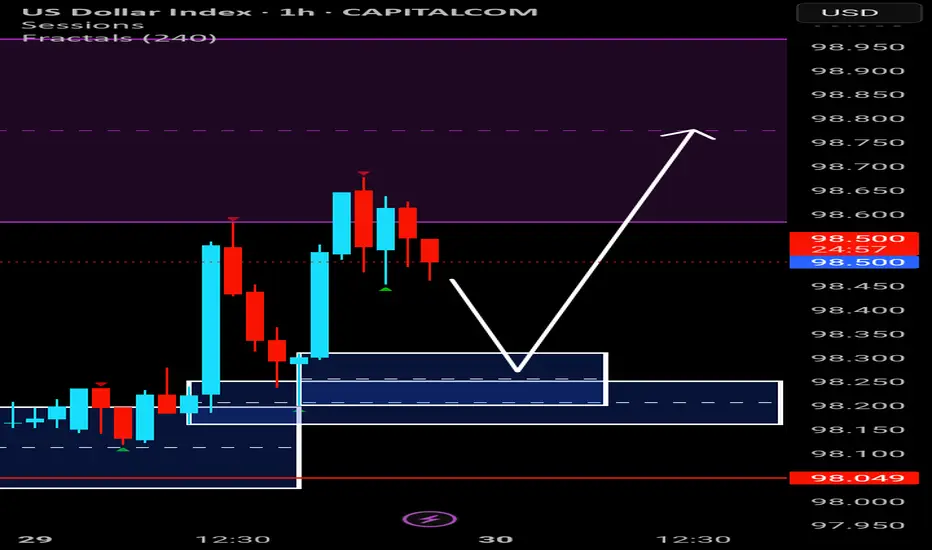
DXY Goes 98.200 and then Bullish The DXY GOES 98.200 IN 1H OB then we see again dxy is bullish and next target is 99 to 100.
See all ideas
Displays a symbol's price movements over previous years to identify recurring trends.
Frequently Asked Questions
US Dollar USDX Index (DXY) reached its highest quote on Sep 28, 2022 — 114.73 USD. See more data on the US Dollar USDX Index (DXY) chart.
The lowest ever quote of US Dollar USDX Index (DXY) is 89.16 USD. It was reached on Jan 6, 2021. See more data on the US Dollar USDX Index (DXY) chart.
US Dollar USDX Index (DXY) is just a number that lets you track performance of the instruments comprising the index, so you can't invest in it directly. But you can buy US Dollar USDX Index (DXY) futures or funds or invest in its components.