DXY Monthly Analysis | Smart Money Concept + CHoCH BreakdownPair: US Dollar Index (DXY)
Timeframe: 1M (Monthly)
Strategy: Smart Money Concept (SMC) + Market Structure + Demand/Supply Zones
Bias: Bearish (Mid to Long-Term)
Breakdown:
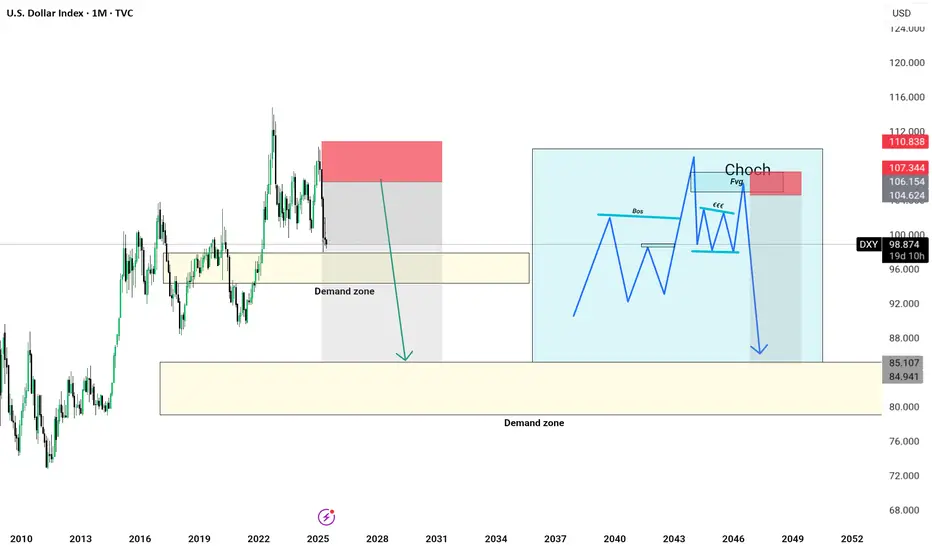
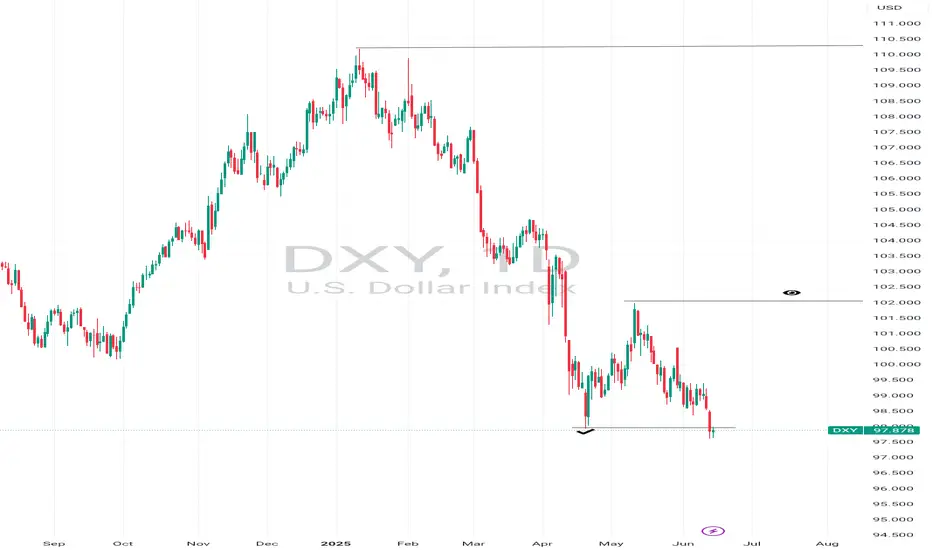
Price reacted strongly from the monthly supply zone (110–104), showing signs of exhaustion.
Clear CHoCH (Change of Character) visible at the top structure, confirming loss of bullish intent.
Internal structure printed a liquidity sweep + FVG (Fair Value Gap) ➝ BOS ➝ lower low.
Current PA (price action) is targeting the first demand zone near 92–94, but major interest lies at the macro demand zone (85.100–84.900).
This level aligns with unmitigated historical demand and potential long-term accumulation range.
---
📅 Projection:
Expecting a continuation to the downside after retesting minor imbalance zones.
Potential multi-year bearish leg forming Wave 3 (macro view).
Ideal accumulation/buy zone: 85.100–84.900 – if structure supports.
---
📌 Key Levels to Watch:
Supply Zone: 110.800 – 104.600
CHoCH Level: ~102.300
Short-Term Demand: 92.000 – 94.000
Long-Term Demand (Institutional Interest): 85.100 – 84.900
---
💡 Conclusion: Smart Money has exited from premium pricing, and the macro structure aligns with a bearish transition. As long as price respects current lower highs, we may see a deeper correction or possible trend reversal near 85 levels.
---
🧠 #DXY #SmartMoney #CHoCH #ForexAnalysis #SupplyAndDemand #PriceAction #Forex #Month
DXY trade ideas
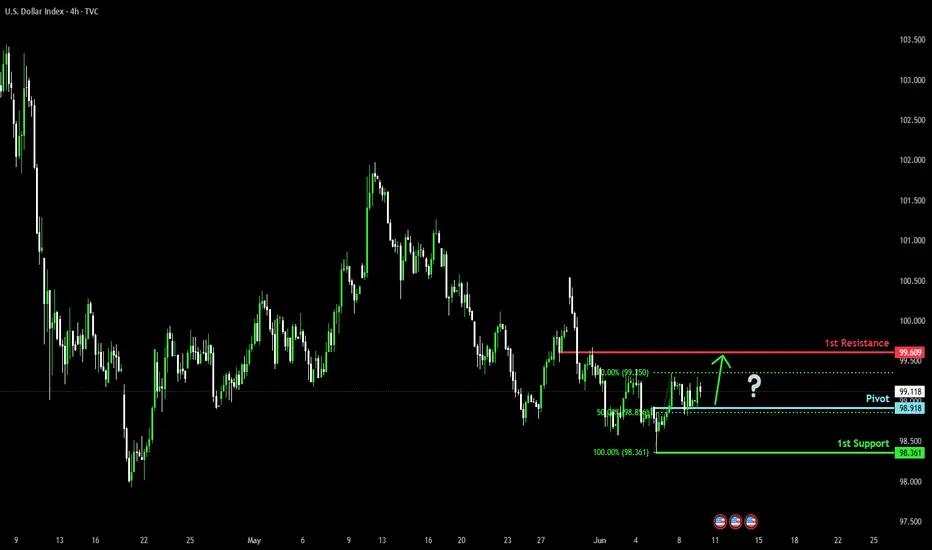
Bullish bounce?US Dollar Index (DXY) has bounced off the pivot which lines up with the 50% Fibonacci retracement and could rise to the 1st resistance.
Pivot: 98.91
1st Support: 98.36
1st Resistance: 99.60
Risk Warning:
Trading Forex and CFDs carries a high level of risk to your capital and you should only trade with money you can afford to lose. Trading Forex and CFDs may not be suitable for all investors, so please ensure that you fully understand the risks involved and seek independent advice if necessary.
Disclaimer:
The above opinions given constitute general market commentary, and do not constitute the opinion or advice of IC Markets or any form of personal or investment advice.
Any opinions, news, research, analyses, prices, other information, or links to third-party sites contained on this website are provided on an "as-is" basis, are intended only to be informative, is not an advice nor a recommendation, nor research, or a record of our trading prices, or an offer of, or solicitation for a transaction in any financial instrument and thus should not be treated as such. The information provided does not involve any specific investment objectives, financial situation and needs of any specific person who may receive it. Please be aware, that past performance is not a reliable indicator of future performance and/or results. Past Performance or Forward-looking scenarios based upon the reasonable beliefs of the third-party provider are not a guarantee of future performance. Actual results may differ materially from those anticipated in forward-looking or past performance statements. IC Markets makes no representation or warranty and assumes no liability as to the accuracy or completeness of the information provided, nor any loss arising from any investment based on a recommendation, forecast or any information supplied by any third-party.
USDX TEMPORAL UPSIDE??The DXY looks set to take out the immediate low — all eyes on that level. Once it’s cleared, we’ll watch for signs of a possible retracement or reversal to the upside. If no such move occurs, the DXY is likely to continue its decline."
Follow up on DXY Short post from 2022The DXY follows Fib levels quite accurately on macro movements using the monthly chart. Both on retracement and extension. It has recently tagged the .618 retrace of the last bullish wave 5 movement that started its decline.
I would suppose it is close to completion of wave A of a ABC correction that will play out over the next several months. As it tagged the .618 mentioned above, it has also tagged the .786 extension of what is likely the c wave of the abc structure (of the larger A).
B wave trade to the upside has good probability now in my opinion. I took the trade this morning with a 3-1 RR in place. It could fall to the trend line which is fine, but if it breaks in earnest and closes a few sessions below then my stop would be triggered.
There was a bullish divergence prior to the April lows on the Daily TF and one is developing at the current lows. A close above 99.40 would confirm.
Long term the dollar is likely still going to weaken and go much lower as QE inevitably comes back into the market picture. TP levels are at 99.40, 100.54, 101.25 and 101.76.

XAGUSD, XAUUSD, BTCUSD, ETHUSD & DXY Daily Trade SetupsIn this update we review the recent price action in Silver, Gold, Bitcoin, Ethereum & the Dollar Index and identify the next high-probability trading setups and price targets. To review today;s video analysis click here!

Bullish outlook Previous liquidity was taken , would be expecting a bullish move to ake out sell side
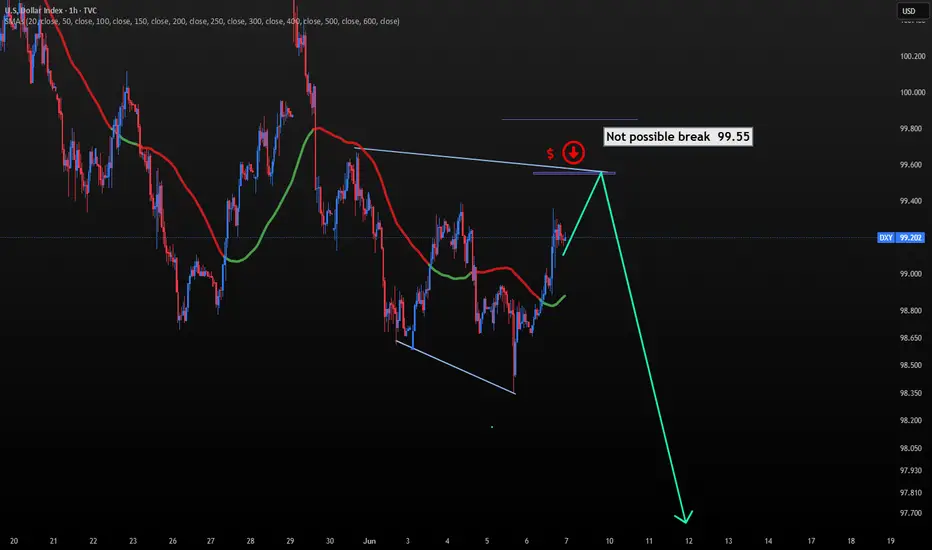
dxy 1hr chart analaysis The current bullish trend in the DXY is likely to face a strong rejection around the 99.55–99.65 zone. Unless there is major news that significantly shifts the market direction — such as a surprise policy announcement like the tariffs introduced during Trump's era — the dollar index is not expected to break above that level. That zone could act as a major turning point, and a bearish reversal is likely to emerge from there
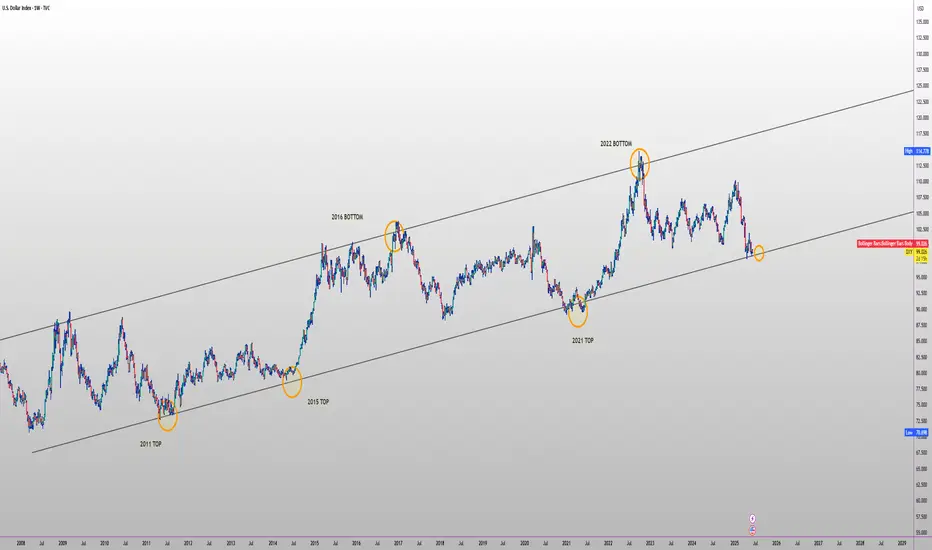
CRYPTO CORRELATION WITH DXYThe U.S. Dollar Index (DXY) is probing 99-100—the same lower-rail support of its 14-year ascending channel that caught the 2011, 2015 and 2021 inflection points and launched the 2016 and 2022 dollar surges
macrotrends.net
forex.com
. History shows that when the dollar sinks beneath this zone (April 2017 and June 2020) Bitcoin has ripped 10-fold or more within months
cointelegraph.com
, whereas a sharp bounce from here (September 2022 above 110) coincided with BTC’s plunge to the cycle low near $16 k
forex.com
coindesk.com
. The macro backdrop currently favours at least a reflex rally: the Fed’s latest survey and dot-plot point to “higher-for-longer” policy with only two cuts pencilled in for 2025
reuters.com
finance.yahoo.com
, 10-year Treasuries still yield about 4.7 %—a near-cycle high that supports dollar carry demand
wsj.com
, and U.S. growth has just been revised up to 2.7 % for 2025 while euro-area PMIs languish in contraction and the ECB is already easing
mdm.com
ecb.europa.eu
. Add in lingering negative BTC-DXY correlation metrics
coindesk.com
and the structural importance of the psychologically charged 100 level, and this pivot becomes a practical timing gauge: a sustained break below 99 would clear the way for the next broad crypto bull-phase, whereas a confirmed dollar rebound warns that any exuberance in digital assets could mark a cyclical top.
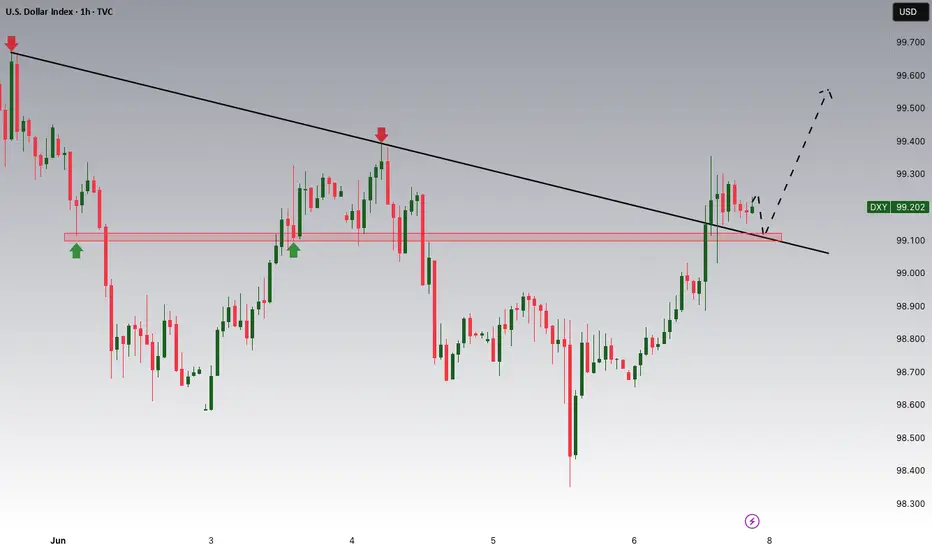
DXY Ready to Reload? Eyes on 99.100 as Tariff Tensions Ease!!Hey Traders, In tomorrow's trading session, we're closely monitoring the DXY for a potential buying opportunity around the 99.100 zone. After trending lower for a while, the dollar index has successfully broken out of its downtrend and is now entering a corrective phase.
We’re watching the 99.100 support/resistance area closely, as it aligns with a key retracement level making it a strong candidate for a bullish reaction.
On the fundamental side, Friday's NFP data came in slightly above expectations, which is typically USD-positive. In addition, recent Trump-led de-escalation in U.S.-China tariff tensions is another supportive factor for the dollar.
Trade safe, Joe.
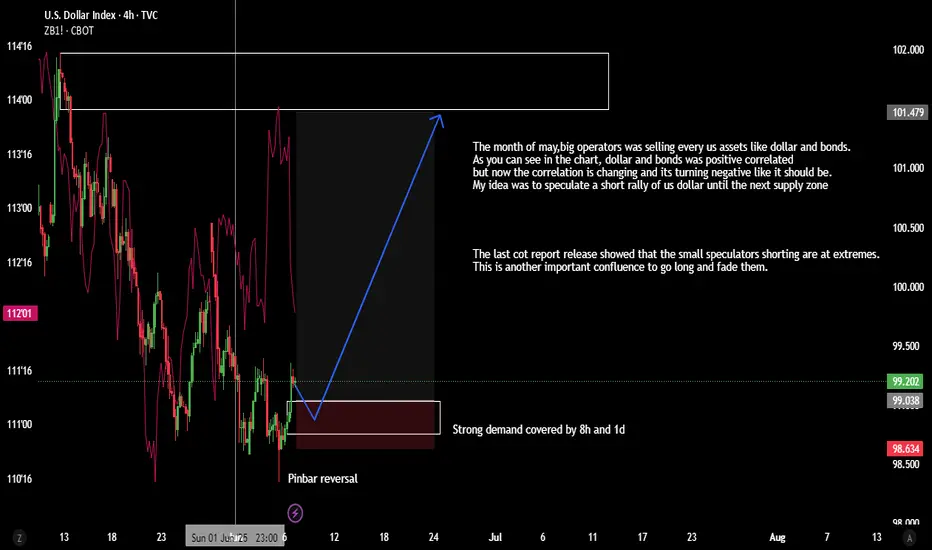
Buy Idea on Us Dollar Index (Dxy)Based on :
- Demand zone
- Pin bar Reversal
- Changing of correlation between dxy and zb1!
- cot report
DXY 4hr chart Analaysis It is possible that the DXY may retrace back to the 101.208 level, which previously marked the beginning of a bearish move. Alternatively, it could also resume a bearish trend from its current level or around the 99.80 zone. The market at this point requires heightened caution.
A potential bearish entry could be considered if DXY breaks below the 98.66 – 98.30 support area. A clear break of this level would confirm a fully established bearish trend, with a likely continuation towards the 94.00 – 93.00 range. From there, a bullish momentum may be anticipated.
Reversal pattern on DXYPrice entered into the 12 months Fair value gap the second time and took out the old low there. This is called stop hunt, which is particularly significant because it happened inside a Higher timeframe Fair value gap. After this stop hunt came an invalidation of a Fair value gap (BISI). This price signinature cause the reversal of price ultimately... it is noteworthy that price had spent more than a month in the 12 Month Fair value gap. It is worth trading

DXY Analysis - Framing TradesHere is a DXY analysis and more guidance on how to frame trades using ICT concepts, at least the way I use it.
-R2F Trading

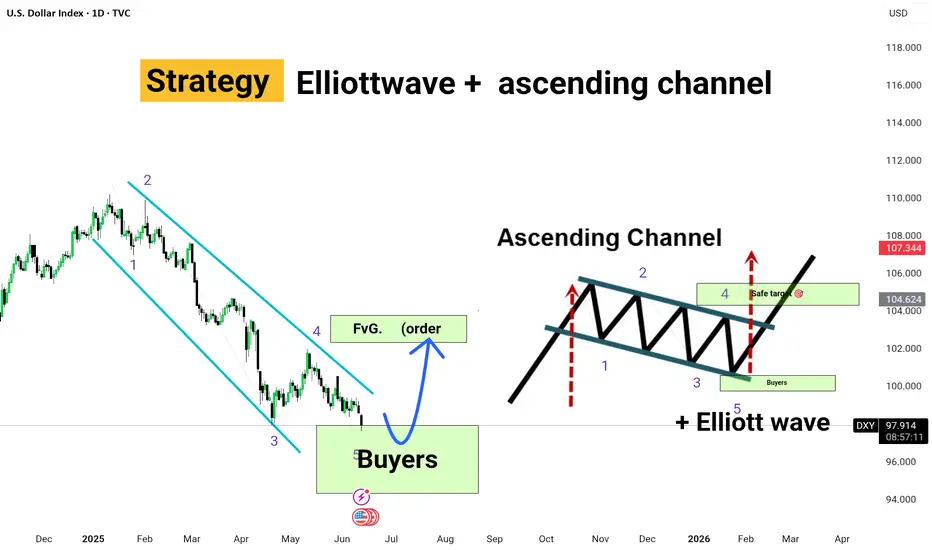
Dollar Falling Ends Soon? Look What Pattern Is Forming!”Asset: U.S. Dollar Index (DXY)
Timeframe: 1D (Daily Chart)
Methodology: Elliott Wave + FVG (Fair Value Gap) + Price Action
DXY has completed an impulsive 5-wave bearish structure, now entering a high-probability reversal zone marked by strong buyer interest around the Wave 5 bottom.
📌 Key Insights:
Wave 5 approaching demand zone (Buyers' area)
Price inside Fair Value Gap (FVG) – potential order block
Bullish reversal expected from here
Forecast: A breakout into an ascending channel, confirming reversal
💡 If Wave 5 holds, we may see a sharp upside rally aligning with smart money accumulation + Elliott Wave psychology.
🔔 Watch for bullish confirmations near 97.50–98.00 for a potential long setup targeting the 104–107 zone.
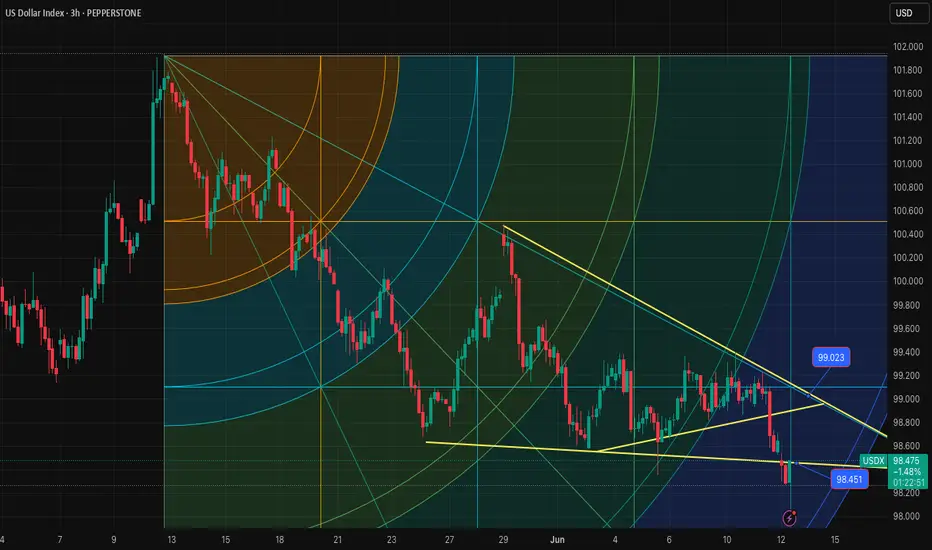
USDX-NEUTRAL BUY strategy 3 hourly GANN SQThe index is changing tune, but we should comfortably move beyond 98.60 before I feel we may have a chance to test 99.10 area. The chances are there, and perhaps this is start ofmit, but kindly wait and see a confirmation for it.
Strategy BUY @ 98.50-98.75 (on break) and take profit near 99.78 for now.
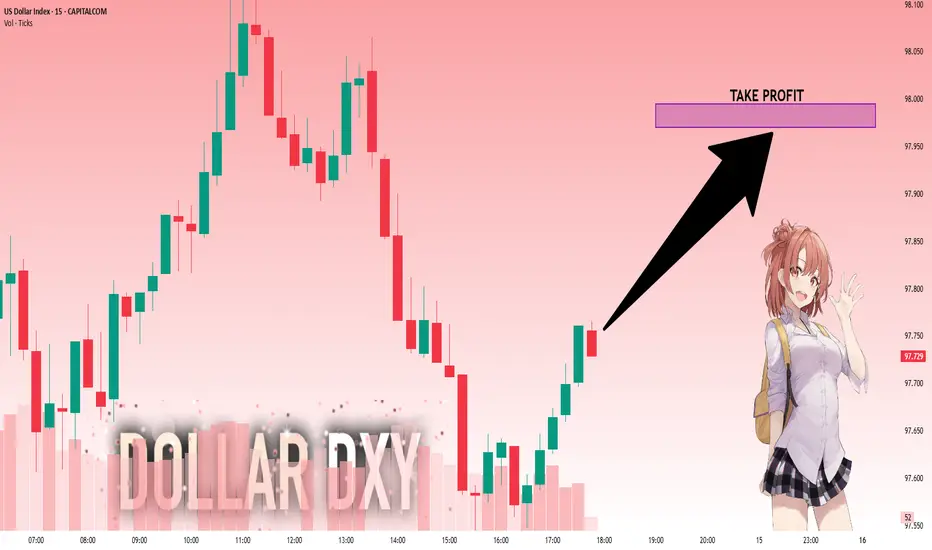
DXY: Local Bullish Bias! Long!
My dear friends,
Today we will analyse DXY together☺️
The market is at an inflection zone and price has now reached an area around 97.757 where previous reversals or breakouts have occurred.And a price reaction that we are seeing on multiple timeframes here could signal the next move up so we can enter on confirmation, and target the next key level of 97.970.Stop-loss is recommended beyond the inflection zone.
❤️Sending you lots of Love and Hugs❤️
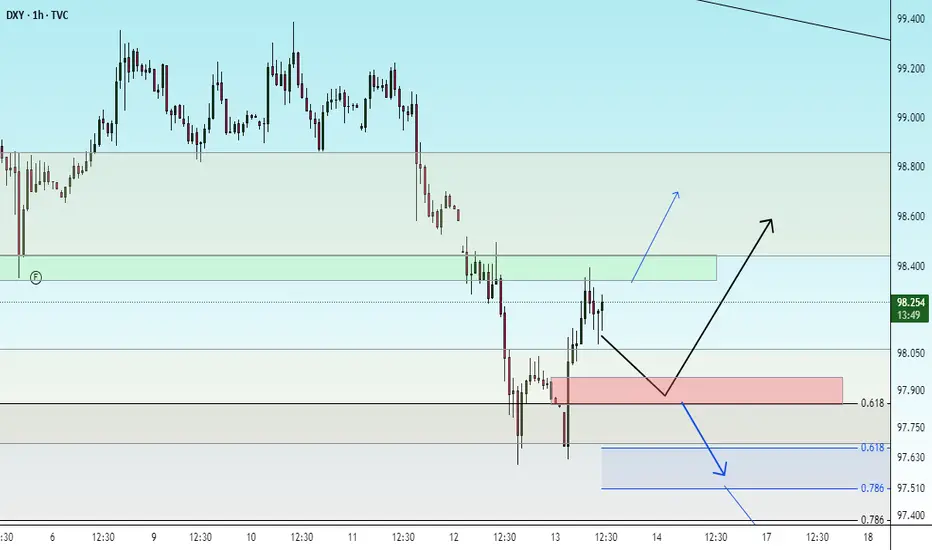
check the trendIt is expected that the correction trend will form up to the specified support zone, then there will be a possibility of a trend change. With the failure of the green resistance zone, confirmation of the bullish trend will be formed.
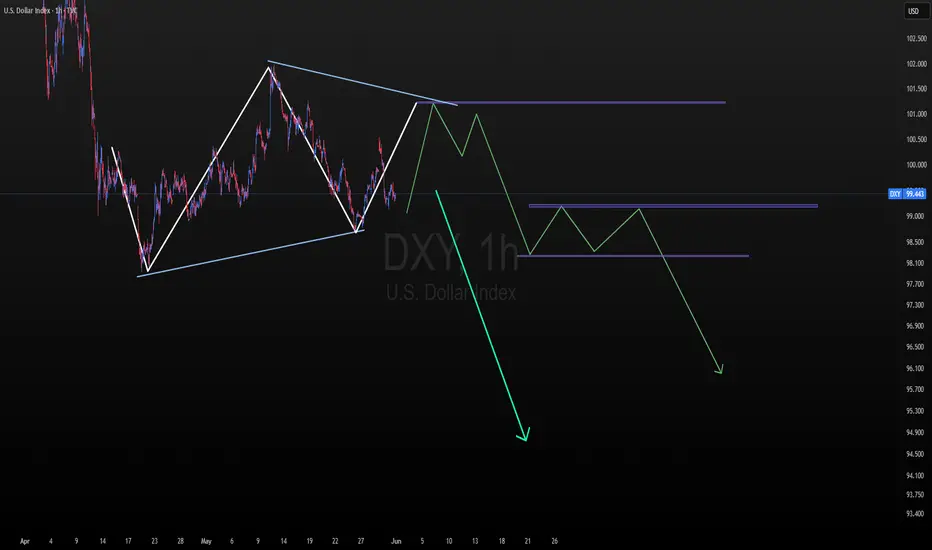
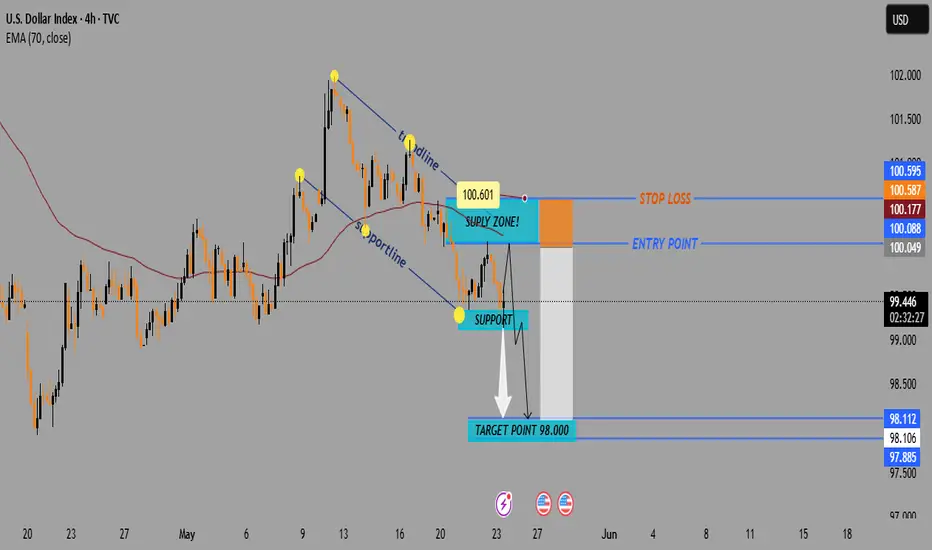
U.S. Dollar Index (DXY) Bearish Setup – Supply Zone Rejection & 🔹 Trend Overview
📊 Overall Trend: Bearish (Downtrend)
📉 Price is forming lower highs and lower lows within a descending channel.
🔻 Recently bounced off a support zone, now heading toward a potential pullback.
🔵 Supply Zone (Resistance Area)
📍 Zone Range: 100.049 – 100.601
🧱 Acts as a resistance block where sellers might step in.
📏 Confluent with EMA 70 at 100.178, strengthening its validity.
🔸 Trade Setup – Short Position
🟠 ENTRY POINT: 100.088
❌ STOP LOSS: 100.587 – 100.595 (Just above supply zone)
🎯 TARGET: 98.000 (With intermediate support levels)
📌 Support Levels
🔹 98.112 – First minor support
🔹 98.106 – Close-range confirmation
🔹 97.885 – Additional support zone
🟦 Main Target: 98.000
⚖️ Risk/Reward Ratio
🟧 Small risk above supply zone
🟩 Large reward to downside = Favorable R:R
📌 Summary
📈 Expecting a pullback into supply zone.
🧨 Look for bearish confirmation around 100.088.
🎯 Target the downside at 98.000 for profit.
dxy bearish ideadxy rejected from weekly fvg and expecting it to fall after tapping the volume imbalance which is also in the premium zone
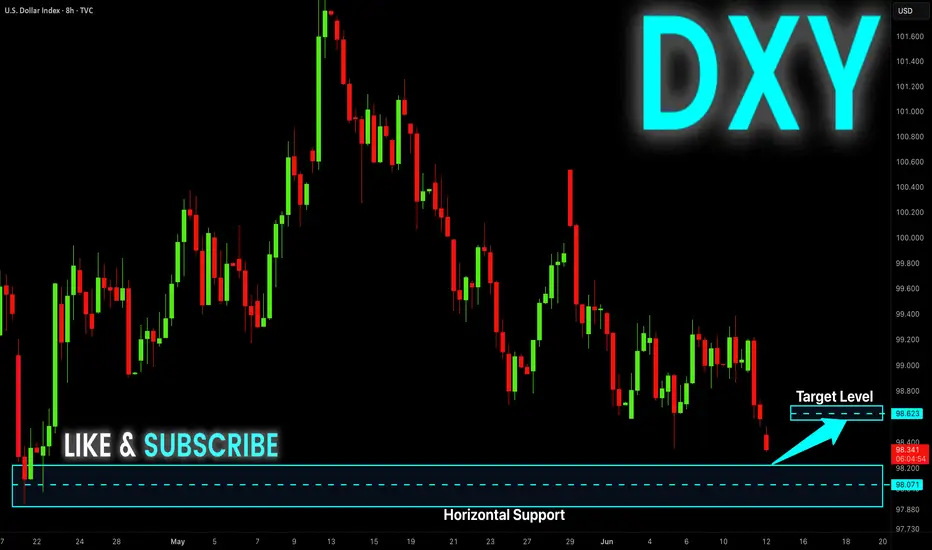
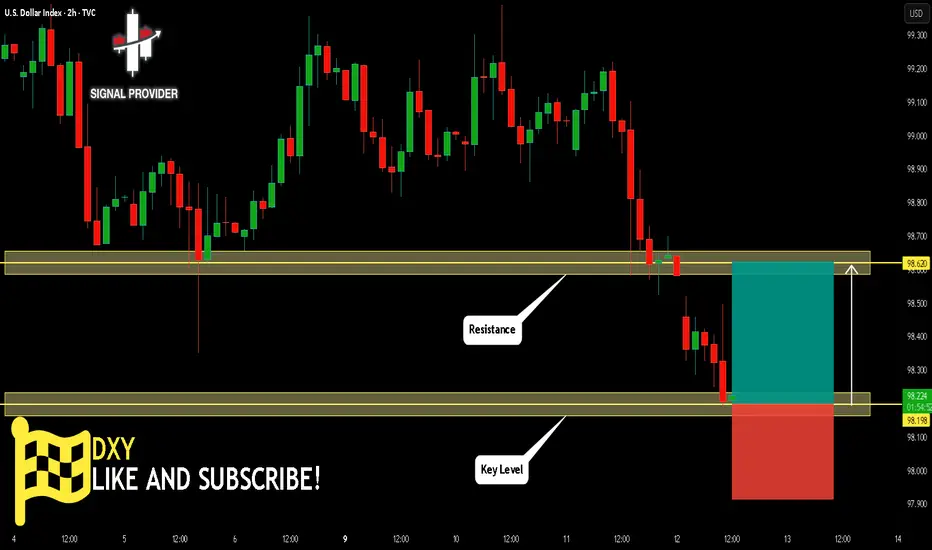
DXY Will Grow! Long!
Here is our detailed technical review for DXY.
Time Frame: 2h
Current Trend: Bullish
Sentiment: Oversold (based on 7-period RSI)
Forecast: Bullish
The market is trading around a solid horizontal structure 98.198.
The above observations make me that the market will inevitably achieve 98.620 level.
P.S
Please, note that an oversold/overbought condition can last for a long time, and therefore being oversold/overbought doesn't mean a price rally will come soon, or at all.
Disclosure: I am part of Trade Nation's Influencer program and receive a monthly fee for using their TradingView charts in my analysis.
Like and subscribe and comment my ideas if you enjoy them!
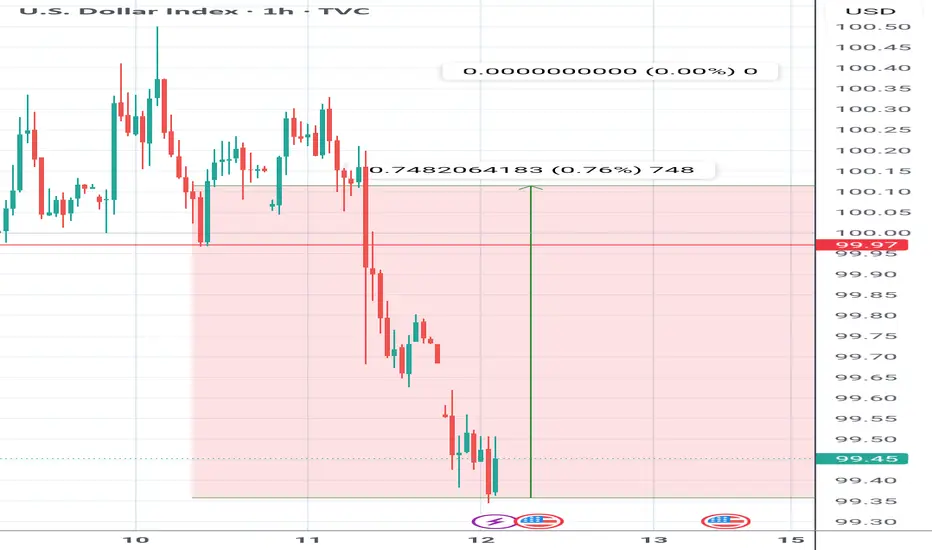
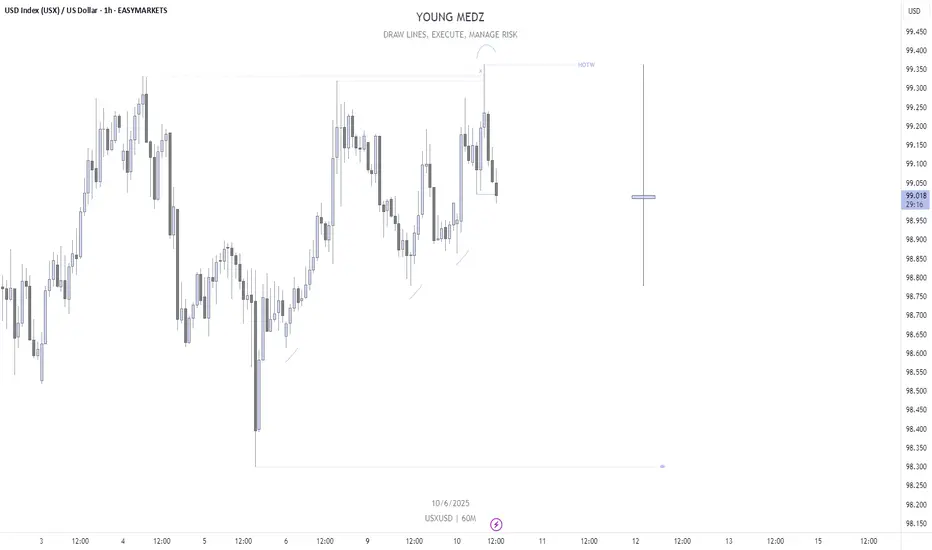
USXUSD Potential HOTWI would like to see a H4 BOS on USX.
IF we get the H4 BOS, I am looking at a CPI & PPI Delivery lower for DXY towards April Lows.
Let's see....
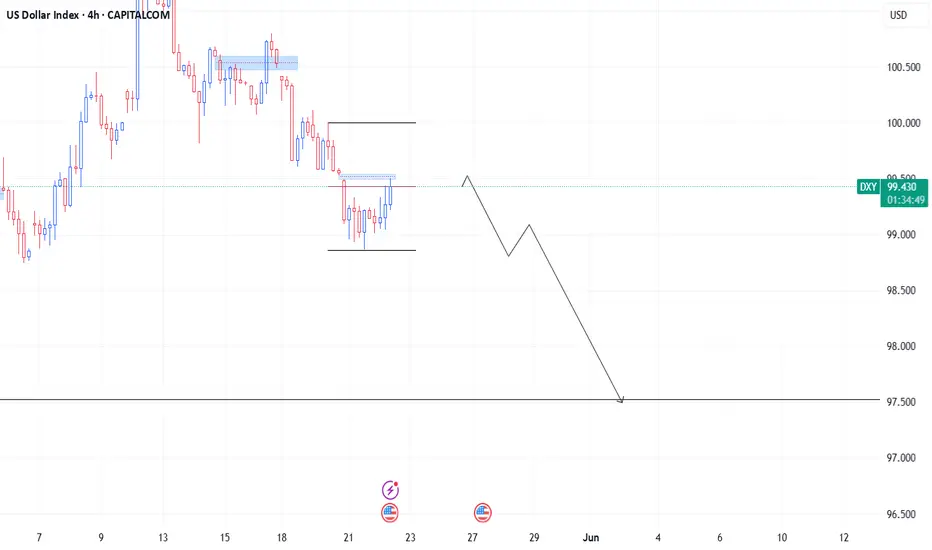
DXY Support Ahead! Buy!
Hello,Traders!
DXY keeps going down
But the strong horizontal
Support is ahead around 98.000
So after the price hit the level
We will be expecting a
Local rebound and a move up
Buy!
Comment and subscribe to help us grow!
Check out other forecasts below too!
Disclosure: I am part of Trade Nation's Influencer program and receive a monthly fee for using their TradingView charts in my analysis.