Price action Dxy broke structure above had to wait for this confirmation all that needed is sweep the liquidity above
DXY trade ideas
dxy bias ideaThe previously mentioned bias idea played out well. A pump was caused due to trump eu tariff situation.
Now if we get a weekly closing below this low we can see a further lower push. Amid current unclear fundamental situations this can be invalid.
DYOR this is just my pov (im a noob)

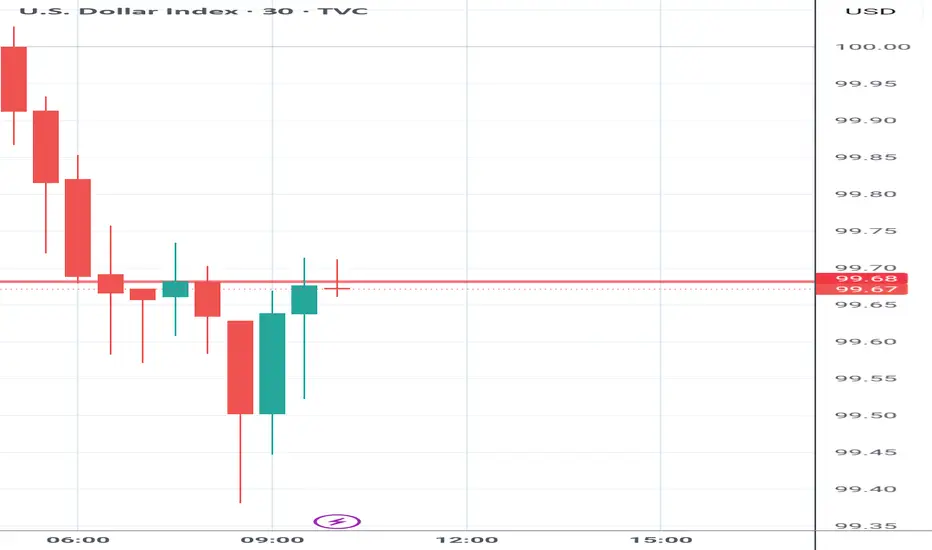
Price action If the 30 min candle close above the red line I'll resume selling Gbpusd currently sitting on my hands
DXY has lost it...Despite what the news have been telling us, price action is indicating that it's heavy on the sellside delivery. The news failure so far has supported the Bears. We may see continue weakness until proven otherwise.
DXY H4 – Dollar Weakens Ahead of PPI Release DXY H4 – Dollar Weakens Ahead of PPI Release | Is the Market Pricing in a Fed Pivot?
🌐 Macro & Fundamental Context
As we head into the New York session on June 12, the market’s attention shifts to one critical data point: the US PPI (Producer Price Index). Following the softer-than-expected CPI reading of 2.4% YoY (vs. 2.5% forecast), the Dollar Index (DXY) dropped sharply—signaling fading inflation pressure and reigniting rate cut expectations.
✅ Bearish Fundamentals Building for the USD:
CPI miss fuels Fed rate cut bets (currently ~65% chance for September per FedWatch Tool).
US Treasury yields are easing, reflecting the market’s pricing of a less aggressive Fed.
Risk assets rallying as capital flows rotate away from USD into gold, equities, and long-duration bonds.
If today’s PPI also comes in below forecast, it could confirm a deeper correction in DXY. Conversely, a surprise PPI upside might trigger a short-term pullback.
📉 Technical Analysis – H4 Timeframe
🔹 Overall Trend:
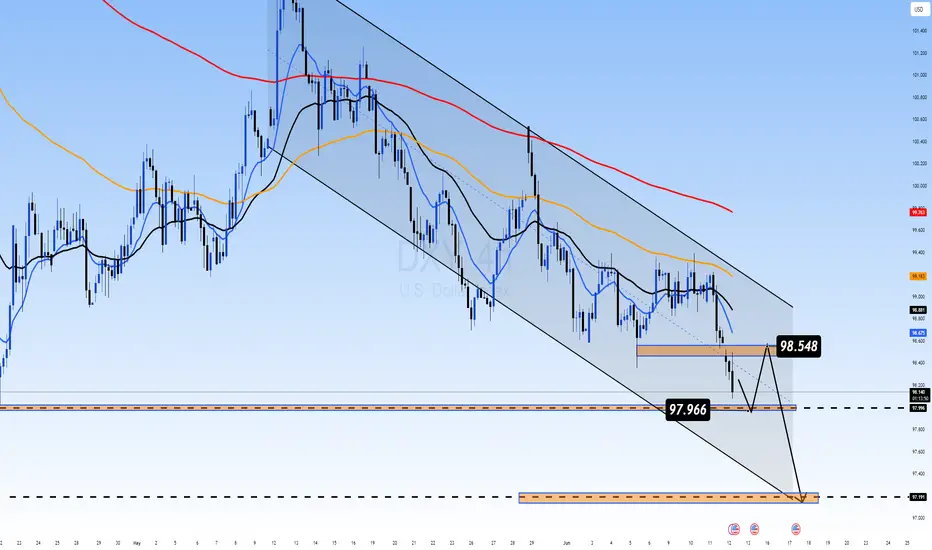
DXY is locked within a clearly defined descending channel, with a consistent Lower High – Lower Low structure holding since late May.
🔹 Key Technical Zones:
Short-term resistance: 98.548 – likely to act as a ceiling unless PPI surprises to the upside.
Immediate support: 97.966 – a break below opens the door toward the key support zone at 97.191, which aligns with previous FVG imbalance and multi-timeframe demand.
🔹 EMA Structure:
Price remains below all major EMAs (13 – 34 – 89 – 200), confirming persistent bearish pressure.
EMA13 is currently acting as dynamic resistance on H4, pressing down on price.
🧠 Market Sentiment & Flow Insight
Investors are rotating out of USD as inflation fears fade and Fed easing expectations increase.
Risk-on sentiment is returning, benefiting gold and stocks while weighing on DXY.
However, a hot PPI print could spook the market briefly, leading to a corrective bounce in the Dollar before the trend resumes.
🔍 Scenarios to Watch:
PPI comes in lower than expected:
DXY may retest 98.548 resistance and reject lower.
Next targets: 97.966 → 97.191
PPI surprises to the upside:
Technical bounce toward 98.5–98.8 possible.
But trend remains bearish unless price reclaims 99.2+ zone.
✅ Conclusion
DXY remains under pressure from both macro and technical angles. The PPI report will be the next catalyst that determines whether this is a short-term dip or the continuation of a broader USD downtrend.
🎯 Tactical view: Favour short positions on DXY if price bounces into resistance and PPI supports the disinflation narrative. Target: 97.1 and below.
DXY. Midterm Analysis of the US Dollar IndexHey traders and investors!
📍 Context
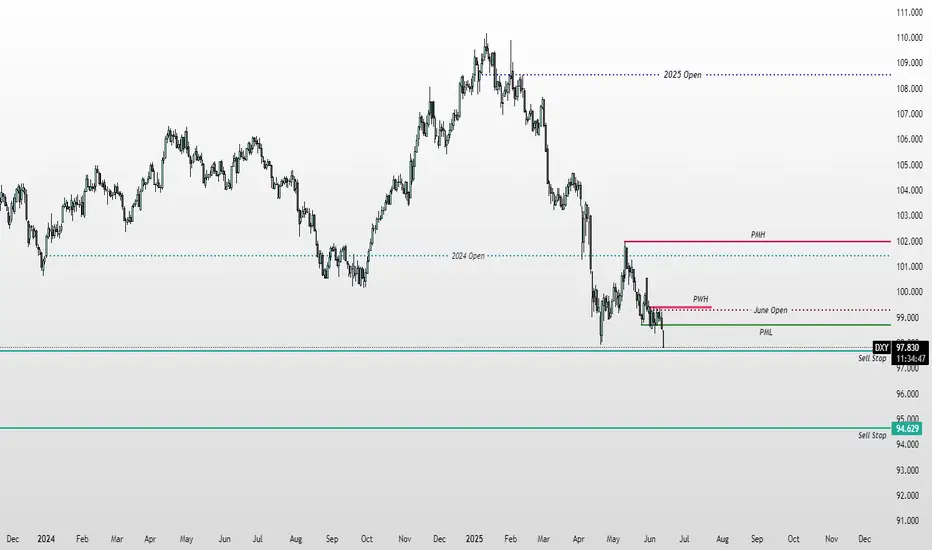
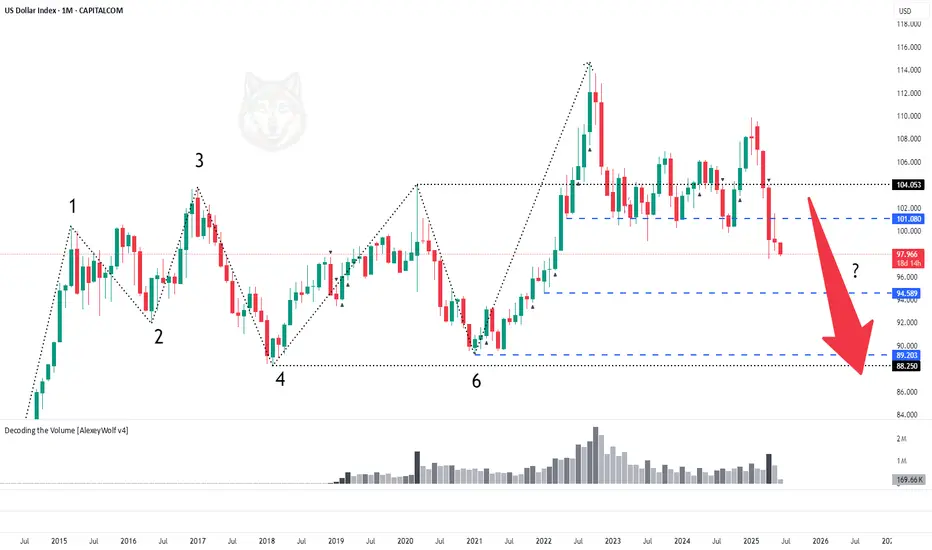
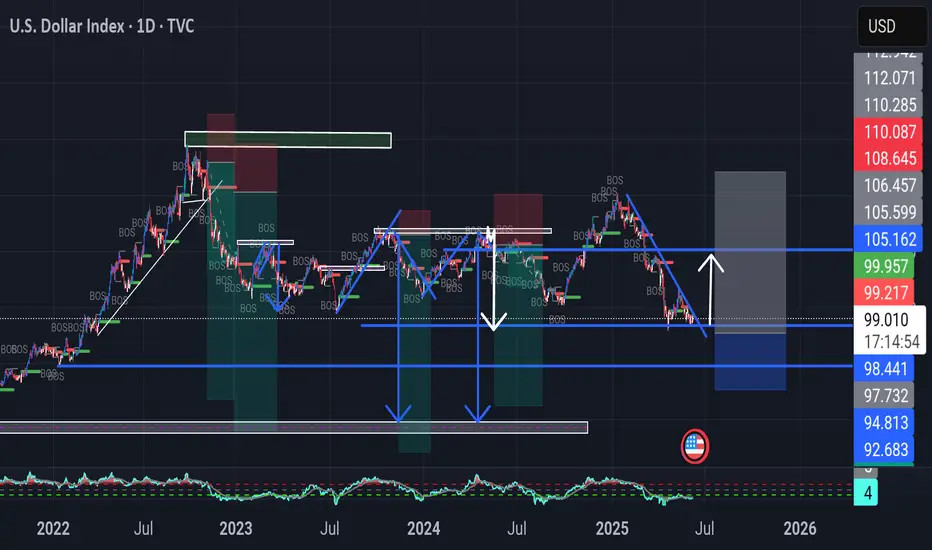
On the monthly timeframe, the market was in a range. The price broke above the upper boundary and was long supported around the 101.080 level. This level was repeatedly tested by sellers and now appears to have been broken.
📊 Monthly targets: 89.20 and 88.300.
🔎 Analysis
Why might the downward movement continue?
Daily TF
On the daily chart, we can see that on the day buyers returned to the 101.080 level, the main volume was accumulated in a buyer candle right at and slightly above the level. This suggests the level was defended by sellers. This indicates they are currently in control, and the decline may continue. Let’s look at the nearest potential buyer activity levels.
11-day TF
The price has once again broken downward out of the range. Below, there is a small consolidation area formed during the previous upward movement. Its boundaries are: upper boundary — 97.385, lower boundary — 94.589.
🎯 Trade Idea: Rebounds from the upper boundary at 97.385 are possible, but overall the priority remains with a move into this range and towards the 95.00–94.589 zone.
This analysis is based on the Initiative Analysis concept (IA).
Wishing you profitable trades!
Dollar - Slowly Drifting downQuick video on Yesterdays/Todays price action in relation to our target

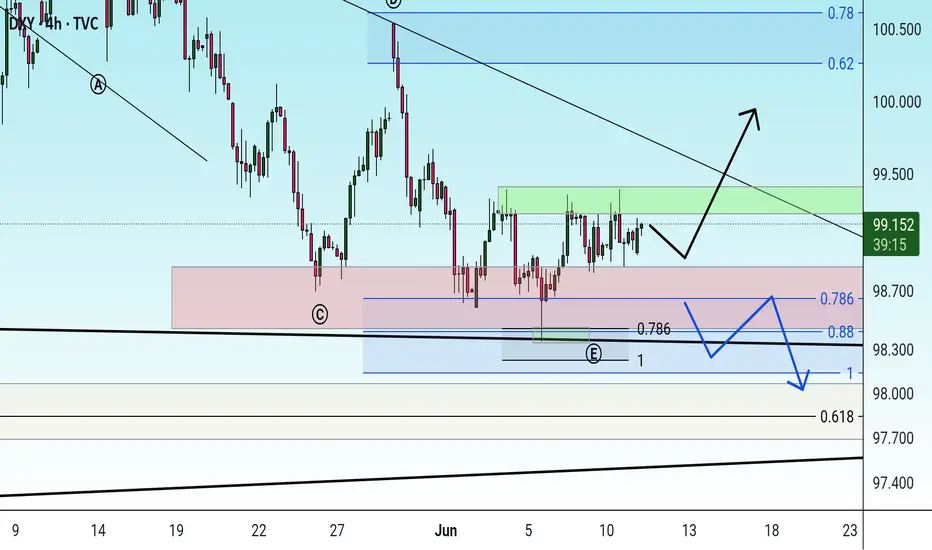
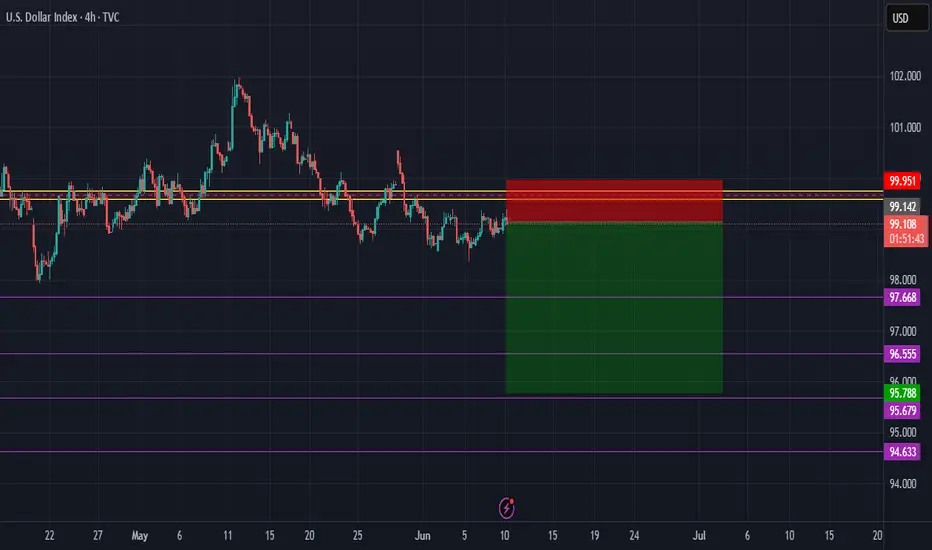
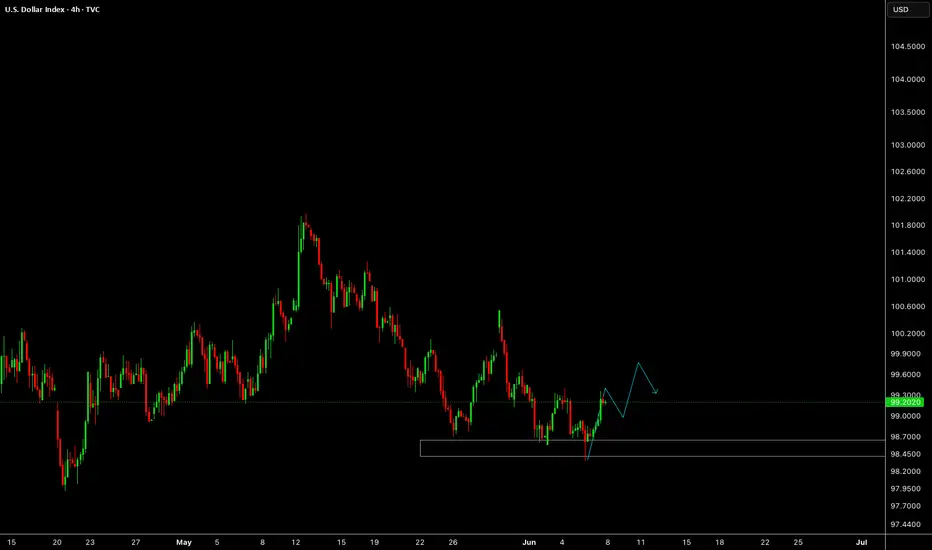
Possibility of uptrend It is expected that after some fluctuation and correction in the support area, a trend change will take place and we will witness the start of an upward trend. A break of the green resistance area will be a confirmation of the upward trend. Otherwise, the continuation of the corrective trend to the support areas will be possible.
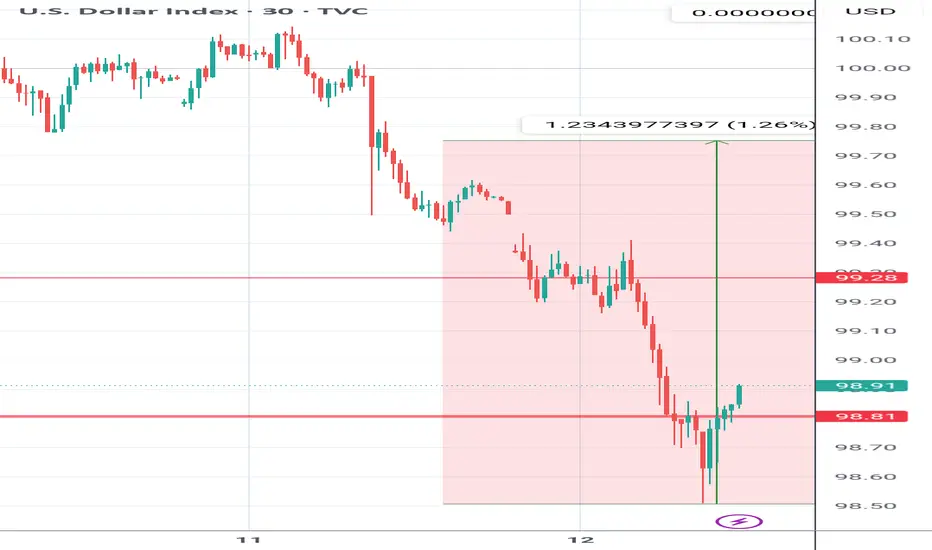
DXY Asia delivery to London Delivery Analysis DXY
Asia delivery to London Delivery Analysis
JUNE 10 FRAMEWORK
*Monday was a sell off
*Current range is premium
*Previous range is a discount
*Minor buy side taken in dealer range
*Sell side liquidity was taken at open of Asia
Is today a raid the equal lows and a buy day?
*Asia expanded rallied to equal highs
*Retraced to the session .618 and consolidated
*Previous session discount coming into London
*I suspect that dxy might make a high of the week today and attack the major buy side
Great analysis and great delivery. This is builds my confidence. Where I struggle to trust it when it comes time to react and make the trade I see rather than the noise I get stuck in.
Very happy price played out to the Asia expansion and the highs I felt at 5 am I suspected for price to take. Celebrate what you can and keep going.

check the trendThe downtrend is expected to end at the current support level and an uptrend will begin. Otherwise, if the support level is broken, the downtrend could continue to the next support level.

Dollar - Still going for TargetAs mentioned in the video on Friday 2 min before NFP. We could run higher on the dollar and i didnt want it to take out the 4 hour candle as shown here.
Go back and see the video for reference. Link below
We should head towards the Target now and im still bearish dollar. Very Bearish

Eur, Gbp & DXY Dynamics: We have reached fair valueWith equilibrium being established we are stuck in an internal liquidity range. We do expect the trending targets to be hit although we are seeing a preliminary shift in structure.
If there was anything I missed in this analysis please let me know. Share this with anyone who may be interested 🙏🏾

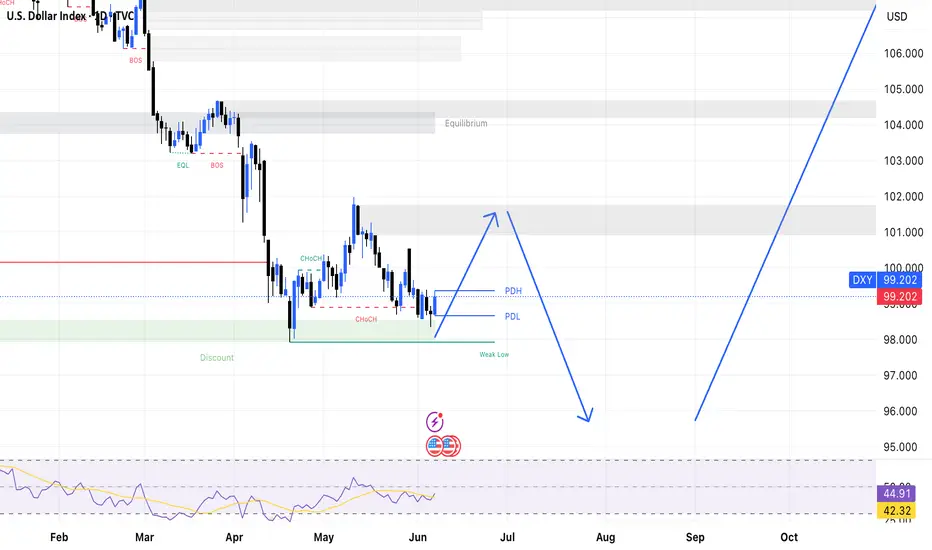
DXY next trading set upHi traders I decided to share with you DXY n next possible move that can take place anytime as you can see we've been dropping and it's most about time for recovery in order to simple follow my set up don't play short games and be controlled by small move that's why you fail,you cant come with H1 N H4 analysis while am showing a big picture of the trend the reason why I don't loose trade easily is because I follow right trend not spikes or short move,that's why I laugh sometimes wen I see horrible graphs in short time frames but I've realized that they cant see what am seeing and I must just leave them in peace until they understand how market moves,I did 5 ninets n 25 minets all less than daily but they always wrong n just change meaning they are weak n fake, real shit daily n weekly you are following right trend the only way is to generate liquidity into position and they will give you right point of your entries,if you are addicted into gambling it might take you years to realize how easy it is to follow the trend,first identify the trend you want to trade know if it's uptrend or down trend or range check how it moves in bigger time frame,am not gonna entertain 5 minets trade while am using weekly n monthly time frame we are not seeing the samething,just start to position yourselfs from here until 96 if possible but is likely to gain in few days but that double buttom it looks nasty n not strong soo a bit manipulation n you'll see dxy raising again this is not a gambling my friends were you get money by mistakes you get it by knowing how to follow the system I wish you all profitable week,I will never give you entries soo that you can learn to generate liquidity into positions I do not control the market soo telling you straight point what if market won't reach those point it's useless,soo best is to shows point of interest you counter them n jump in why should I supposed to lie n talk many things that it won't even happen lols,traders I wishy you all the best n profitable week be blessed.
Bearish continuation?US Dollar Index (DXY) is rising towards the pivot and could drop to the 1st support.
Pivot: 100.54
1st Support: 98.32
1st Resistance: 101.78
Risk Warning:
Trading Forex and CFDs carries a high level of risk to your capital and you should only trade with money you can afford to lose. Trading Forex and CFDs may not be suitable for all investors, so please ensure that you fully understand the risks involved and seek independent advice if necessary.
Disclaimer:
The above opinions given constitute general market commentary, and do not constitute the opinion or advice of IC Markets or any form of personal or investment advice.
Any opinions, news, research, analyses, prices, other information, or links to third-party sites contained on this website are provided on an "as-is" basis, are intended only to be informative, is not an advice nor a recommendation, nor research, or a record of our trading prices, or an offer of, or solicitation for a transaction in any financial instrument and thus should not be treated as such. The information provided does not involve any specific investment objectives, financial situation and needs of any specific person who may receive it. Please be aware, that past performance is not a reliable indicator of future performance and/or results. Past Performance or Forward-looking scenarios based upon the reasonable beliefs of the third-party provider are not a guarantee of future performance. Actual results may differ materially from those anticipated in forward-looking or past performance statements. IC Markets makes no representation or warranty and assumes no liability as to the accuracy or completeness of the information provided, nor any loss arising from any investment based on a recommendation, forecast or any information supplied by any third-party.

DXYWe are expecting Dollar strength this week short term.
Disclosure: We are part of Trade Nation's Influencer program and receive a monthly fee for using their TradingView charts in our analysis.
DXY NPF delivery and Week Ahead IdeasDXY NPF delivery and Week Ahead Ideas
F DELIVERY RETRACE
Sell side taken expected buy day to which price delivered
*20:00 expands from equilibrium to minor buy side
*22:40 judus swing fake to the down side
*0:00 expands to session equal highs, previous session equal highs, and FVG
*5:00 small retrace
*7:30 expansion to take equal highs liquidity
*8:30 ND sell side and buy side scoop
*8:35 expansion to buy side
*small retrace
*9:00 expansion to buy side take buy side liquidity
*10:00 silver bullet retraces to .70 taking session equal lows
*10:30 reverses to buy side and rebalance a FVG
consolidates
*11:20 retraces to .618 bounces off
consolidates on the 50
*1:00 expansion and then a back and forth as price moves narrowly into a consolidation to close NY
JUNE 9 Ideas
*Price takes key equal highs in NY
*Parent bias is bear -this week bias is looking for higher prices over all
*possible target for the week is the 50 at price 99.474
*Price is delivering to a premium previous session
*I would expect an expansion to seek sell side liquidity in noted equal lows Monday’s delivering, if Sunday consolidates?
I will watch for reactions at the session 50 just below the equal lows and go from there.
Remember this can all change with Sundays delivery.

DXY Analysis Next Week After Market OpenUS tariff policy is becoming a key variable affecting the Fed's interest rate policy. Current tax policies are facing negative reactions and declining support rates, creating pressure on the US government to promote trade agreements and implement tax cuts to stabilize the economy.
At the FOMC monetary policy meeting in May, the Fed kept interest rates unchanged, showing a cautious stance on inflation risks and low unemployment rates. The latest employment figures show that the possibility of the Fed keeping interest rates unchanged at the June meeting is very high.
As inventory accumulation can increase inflation, the Fed will wait for a clearer assessment of the impact of tax policies before making a decision. Accordingly, the possibility of the Fed cutting interest rates up to 3 times in the second half of the year is low.
The US dollar is expected to continue to decline to adjust
Best regards StarrOne !!!
DXY IS GRADUALLY SHIFTING TO THE UPSIDE!!DXY slightly shifted to the bullish side after the testing the low. from H4 timeframe, i expect a bullish reversal soon. Also, from the fundamental standpoint, the "better than expected outcome" on last NFP report will help foster the strength of USD

bullish sentiment on dxy likey as early as mondaywe are likely to see bullish price action next week on dxy, as we are at a great area of support with a good notice of small weekly candles that have lost down ward momentum, 4hr showing strong bullish action as two previous liquidity has been swept

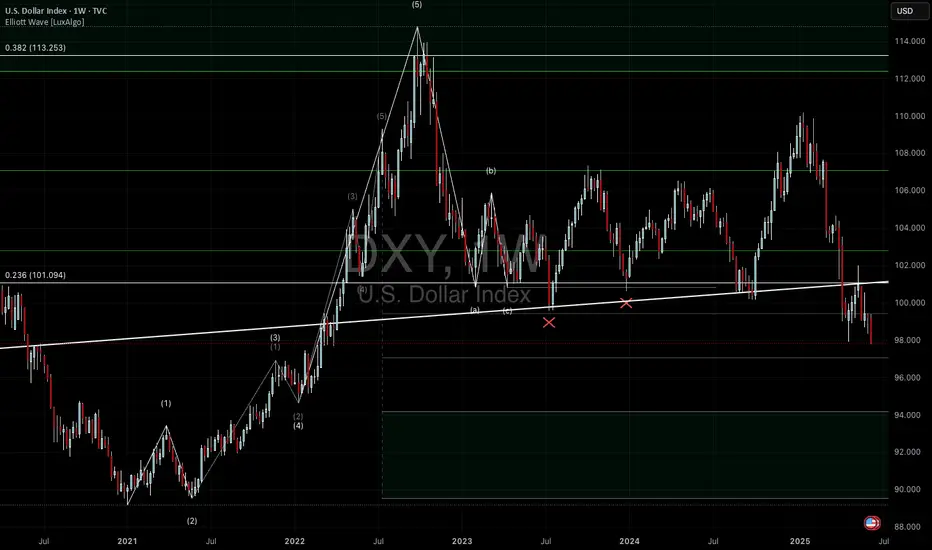
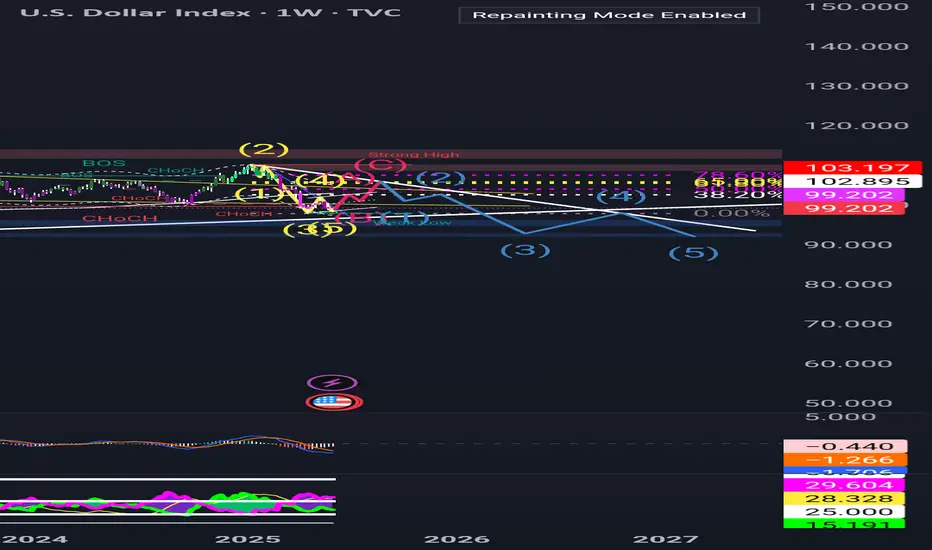
Bearish dxy outlookwave 1 is finished.
An ABC correction follows
Than wave 3 to brake 25 year trend line
Short term Bullish DollarExpecting a short term bullish dollar this month
watchin the market for next week