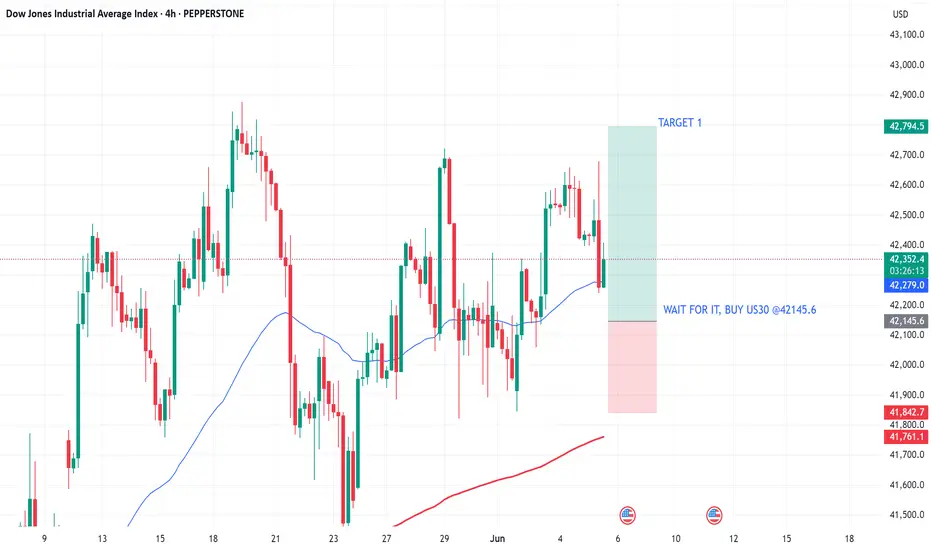
Dow Jones eyes new highs after NFP surpriseNFP came in at 139k vs 130k expected. Unemployment steady. Bad data earlier this week had markets spooked:
* ISM Services: 49.9 vs 52.4 expected
* ISM and Fairclaim: 48.5 vs 49.5
* Jobless claims hit 2025 highs
But today’s jobs report calms the panic.
Dow Jones could still climb, with potential setups offering 2.2 to 5.3 risk-reward. Watch the video to learn more.
This content is not directed to residents of the EU or UK. Any opinions, news, research, analyses, prices or other information contained on this website is provided as general market commentary and does not constitute investment advice. ThinkMarkets will not accept liability for any loss or damage including, without limitation, to any loss of profit which may arise directly or indirectly from use of or reliance on such information.
WS30M trade ideas

Us30Daily rejection to the downside h4 rejection and h1 rejection this might be a potential huge bearish reversal
US30 Set to Break Records? Bulls Eyeing 46K–52K US30 Weekly Chart Outlook – Eyes on New Highs
Technical Outlook — June 6, 2025
Current Market Condition:
US30 (Dow Jones Industrial Average) is showing strong bullish momentum on the weekly chart after rebounding from the key 38,000–39,000 support zone. Price is now trading above the 50 EMA and maintaining distance from the 200 MA, indicating sustained strength in trend structure.
Key Technical Highlights:
Price bounced from the strong demand zone around 38,500.
Sustained recovery above EMA 50 (blue) and holding above short-term swing highs.
Weekly stochastic has crossed bullishly from oversold territory, supporting continued upward movement.
Price currently aims for retesting previous highs around 46,000.
If bullish momentum sustains, the next resistance levels are at 48,000 and 52,000.
Possible Scenarios:
🔸 Bullish Case:
If the current weekly structure holds and no major reversal signs appear, US30 could rally toward 46,000 in the coming weeks. A breakout above that could open the way to 48,000 and eventually 52,000.
🔸 Bearish Case:
Any strong rejection around 46,000 paired with a break back below 41,000 could expose the 38,000 support zone again.
Important Note:
NFP and major U.S. inflation data are due in the upcoming week. Watch out for volatility, especially near key resistance zones.
If you found this analysis valuable, kindly consider boosting and following for more updates.
Disclaimer: This content is intended for educational purposes only and does not constitute financial advice.

Double Top Pattern Signals Bearish Reversal (Short Trade ActiveThe Dow Jones Industrial Average Index (DJI) on the 4H chart has formed a Double Top pattern, indicating potential trend exhaustion and bearish reversal. The price was rejected near 42,900 twice and has now broken below the neckline, triggering a short trade setup.
🔹 Pattern: Double Top
🔹 Resistance Zone: 42,900 – 43,000
🔹 Neckline Break: ~42,450
🔹 Target Area: 40,878 based on pattern projection
🔹 Fundamental Context: Profit-taking and market uncertainty post recent highs
Bearish momentum active – trade remains valid unless price reclaims and holds above 42,950. Short setup is technically and structurally supported. 📉🧭
Note : If you found this helpful, like and follow for more trade ideas!
Share My Idea With Your Firends Mention Your Feed back Comment Section
This is not financial advice. Please conduct your own research and manage risk accordingly.

#US30 Buy 42493.6#US30 Buy 42493.6
SL 42433.6
TP 4251 3.6
TP 4259 3.6
TP 4273 3.6
Trade at your own risk
Protect your capital
The Wizard 🧙♂️ SWFX

US30: Target Is Up! Long!
My dear friends,
Today we will analyse US30 together☺️
The price is near a wide key level
and the pair is approaching a significant decision level of 42.596.9 Therefore, a strong bullish reaction here could determine the next move up.We will watch for a confirmation candle, and then target the next key level of 42.690.5. Recommend Stop-loss is beyond the current level.
❤️Sending you lots of Love and Hugs❤️

US30 - Potential BuyHi traders,
We are looking to BUY CMCMARKETS:US30
Stay tuned :)
Price Action:
Short-term sell bias toward 41,700 zone based on lower high and projected weakness.
Watch reaction at 41,700—if buyers return strong with a new higher low, it resumes uptrend.
Invalidation: If price breaks above 42,800 with strength and closes above, sellers are overwhelmed—trend continues.
Good Luck :)
Study, Study, Study! Lorenzo Tarati

SHORT ON US30US30 Has given us a change of character to the downside with a nice retest creating a lower high.
I will be selling us30 to the next demand zone looking to catch 500-1000 points.
US30 Potential Rebound from Key Support Zone
US30 Potential Rebound from Key Support Zone 🚀📊
📉 Analysis Overview:
The US30 (Dow Jones Index) is currently testing a major support zone near the 41,800–41,900 range, a level that has held firm multiple times in the past (highlighted with green arrows and orange circles). This area has acted as a demand zone, leading to strong bullish reactions previously.
🔍 Key Technical Highlights:
🔸 Support Zone: Clearly respected at ~41,800. Price is once again bouncing here.
🔸 Resistance Zone: Around 43,250–43,500. This area has acted as a ceiling, where price struggled to break through.
🟢 Reversal Indicators: Multiple successful defenses of the support zone suggest accumulation and possible bullish reversal.
📈 Target Projection: If support holds, the price may rally toward the target zone near 43,496.4, as shown by the purple arrow.
📌 Conclusion:
As long as the 41,800 support holds, US30 shows bullish potential toward the 43,500 resistance. A break below this zone would invalidate the bullish scenario and shift focus back to the lower support near 41,250.
🛑 Risk Management Tip: Watch for confirmation candles and volume before entering long positions. Always set a stop-loss below the support zone.

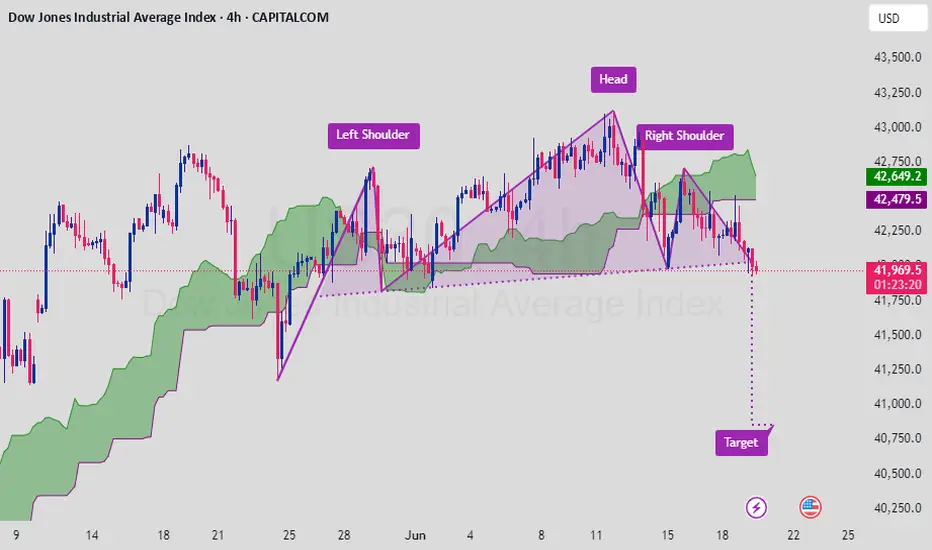
US30 – Head and Shoulders Pattern Signals Bearish Reversal SetupThe Dow Jones Industrial Average (DJIA) is displaying a classic Head and Shoulders formation on the 4H chart, suggesting a potential trend reversal. Price has broken below the neckline and is trading below the Ichimoku cloud, signaling growing downside pressure.
🔹 Pattern: Head and Shoulders
🔹 Current Price: ~$41,966
🔹 Breakdown Confirmation Level: ~$42,200 (neckline)
🔹 Target: ~$41,000 based on measured move
🔹 Technical Outlook: Bearish momentum building below neckline and cloud
🔹 Fundamentals: Market cautious ahead of macro data and Fed policy signals
Bearish scenario developing – sustained price action below neckline could accelerate downside move toward target. 📉⚠️
Note :If you found this helpful, like and follow for more trade ideas!
Share My Idea With Your Firends Mention Your Feed back Comment Section
This is not financial advice. Please conduct your own research and manage risk accordingly.
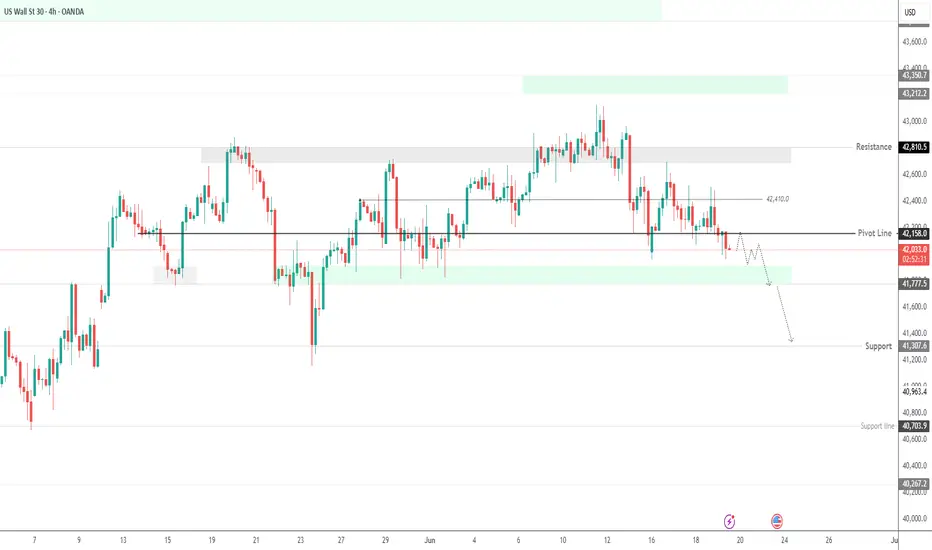
US30 Breaks Key Support as Geopolitical Risk Weighs on SentimentUS30 – Technical Overview
Amid rising Middle East tensions, the indices market remains under bearish pressure, with risk-off sentiment dominating.
US30 dropped to the 42160 level, as previously forecasted, and has now broken below it.
As long as the price trades below 42160, the bearish trend is expected to continue toward 41780, and potentially 41310 if that level fails to hold.
Key Levels:
• Pivot: 42160
• Support: 41900 / 41780 / 41310
• Resistance: 42310 / 42410 / 42580
US30 Under Pressure: Possible Short Setup Brewing on the 4HI'm currently eyeing the US30 (Dow Jones Index) for a potential short opportunity based on multi-timeframe structure 📊.
🔍 Weekly Overview:
The weekly chart continues to show sustained pressure, with this week and last week both closing bearish. The sellers are clearly in control at the macro level. 🔻
📆 Daily & 4H Structure:
Drilling down to the daily and 4-hour charts, we can clearly see a break of structure (BOS). The 4H specifically is showing textbook signs of a bearish trend with lower highs and lower lows forming consecutively 🪜🔽.
🎯 Trade Plan:
I'm watching for a pullback into equilibrium, ideally near the 50% level of the recent Fibonacci range. If price revisits that zone, I’ll be looking for short confirmations to ride the momentum back toward the previous lows, as marked on the chart. 🧠💸.

US30 next target releasedNo comment needed. All information is in the chart analysis.
Steps to follow:
Analyze yourself.
Take the position with SL and Take Profits.
Wait, it may take a couple of days, so take a break and step away from the screen from time to time, just like I do :)
Get the result.
I will update the trade every day.
Like, comment with your good mood or viewpoint, share with your circle. It’s together that we get stronger!
Good trades, Traders!
The golden bear
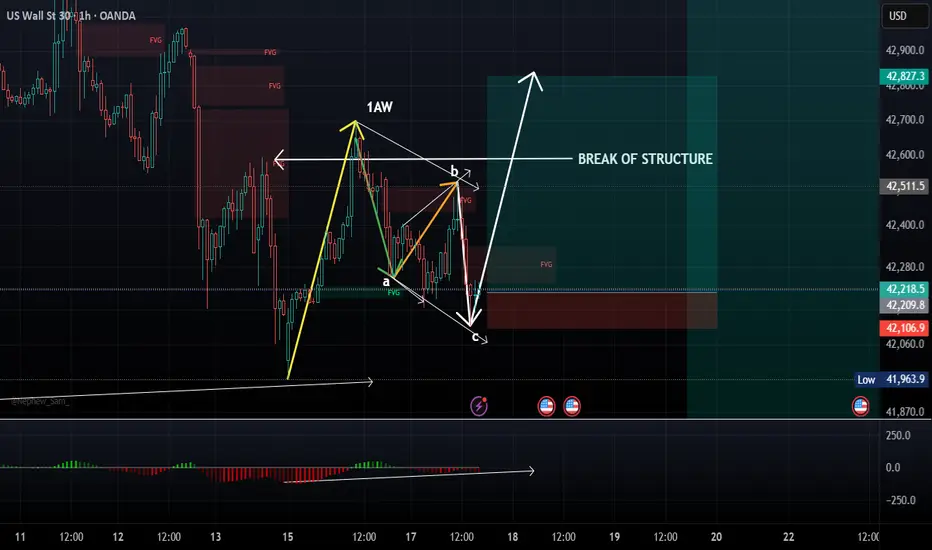
US30/DJ30 Long/buy 1:6Reason for buy:
VERY SIMILAR STRUCTURE TO GOLD!!!!!
1. Break of structure
2. Regular flat in play with a complete corrective structure (a,b,c)
3. NO MACD divergence shows strong moment upwards
4. Impulsive move (1AW) indicates a strong move upwards will continue
5. Liquidity at the top (TP area)
Entry: CMP (Current market price)
Stop loss :42086
Take Profit: At own discretion...OPEN!
Strategy/ies: Engulfing candle on 15/1HR TF
Losses are part of the game...don't be too hard on yourself!
US30US‑30 (Dow Jones) – Bullish Setup Based on COT
Large speculators added +1,319 contracts to net long exposure in mini futures, now at +7,114. Consolidated DJIA futures show similar sentiment at +5,795 net long, above recent averages. This indicates sustained bullish bias.

SMC 1-10Let's see if this trade goes well.
Testing the Luxalgo SMC indicator.
We now have the highest and lowest CHoCH for buys.
2 ob for buys.
DowJones resistance retest at 42880Key Support and Resistance Levels
Resistance Level 1: 42880
Resistance Level 2: 43540
Resistance Level 3: 42940
Support Level 1: 41800
Support Level 2: 41400
Support Level 3: 41100
This communication is for informational purposes only and should not be viewed as any form of recommendation as to a particular course of action or as investment advice. It is not intended as an offer or solicitation for the purchase or sale of any financial instrument or as an official confirmation of any transaction. Opinions, estimates and assumptions expressed herein are made as of the date of this communication and are subject to change without notice. This communication has been prepared based upon information, including market prices, data and other information, believed to be reliable; however, Trade Nation does not warrant its completeness or accuracy. All market prices and market data contained in or attached to this communication are indicative and subject to change without notice.
US30 Technical Overview – 06/17/2025📍 US30 Technical Overview – 06/17/2025
The Dow is consolidating below resistance after failing to reclaim the 42,424 EMA zone. Sellers are defending this level, while 42,102 remains a key support.
🧠 Key Observations:
EMA rejection near 42,424 🔄
Lower highs forming = short-term bearish bias
Demand still holding at 42,102
📊 Price Zones:
🔼 Resistance: 42,424 → 42,605
🔽 Support: 42,102 → 41,947
📈 Trade Setup Ideas:
🔹 Long Bias:
Break and hold above 42,424
→ Target: 42,605 → 42,793
🔻 Short Bias:
Break below 42,102
→ Target: 41,947 → 41,894
🎯 Price is currently between key levels—wait for a breakout before committing to direction!

SHORTS - GOTTA LOVE IT!📊 Multi-Market Signal Alignment: US30 & NAS100 (15-Min)
📍 Both indices triggered clean SELL signals at their highs using the ELFIEDT – X-REVERSION indicator.
The signal printed at the close of the strongest bullish bar, which often marks exhaustion — and price quickly rejected from that level.
✅ US30 printed two stacked 'DOWN' signals — the first entry bar was perfect.
✅ NAS100 printed a nearly identical signal at the same time — showing excellent intermarket confluence.
🧠 Why this setup worked:
Price extended far above mean structure
RSI was stretched and reversed immediately after
Signal printed on a bullish candle before reversal — allowing you to catch the high
Both assets signaled at the same time — strengthening the conviction
📌 Pro Tip: When multiple correlated instruments print reversal signals at the same time (especially indices or FX pairs), it often confirms institutional rotation. These trades offer great risk-reward if you stick to the plan.
US30 17 JUNE 2025 TRADE IDEA Based on the current US30 (Dow Jones Industrial Average Index) chart, the price action shows a strong bullish trend within a well-defined ascending channel that spans from mid-2023 through 2025. The index recently bounced off the mid-range zone near the 41,185 – 41,940 support levels and is now approaching a potential continuation move toward the upper resistance zone between 44,472 and 44,620. This area represents a key supply zone where price previously rejected, suggesting potential hesitation or reversal upon retest. The recent higher lows and breakout from a corrective phase indicate strong bullish structure, supported by institutional order flow—possibly driven by buy-side liquidity targeting previous highs. If the price maintains above 41,681 and creates a successful retest (break and retest confirmation), it offers a compelling opportunity for long positions aiming toward the channel top or key resistance.
From a Smart Money Concept (SMC) perspective, the market structure shifted bullish after sweeping liquidity below April's low followed by a clear Change of Character (ChoCH) and Break of Structure (BOS) to the upside. This shows strong accumulation by institutions. The demand zone formed around 41,185 – 41,681 can be considered a reaccumulation block and a potential entry point for buys on retracement.
Fundamental Context:
This week's movement must also be interpreted in light of broader geopolitical tensions, particularly the ongoing conflict between Iran and Israel, which has implications on investor sentiment and global market volatility. Heightened tensions in the Middle East typically cause oil prices to spike and introduce risk-off sentiment. However, the Dow’s resilience suggests that U.S. investors may currently be pricing in confidence in the U.S. economy, strong corporate earnings, or the expectation that the Fed will maintain or cut interest rates if geopolitical shocks affect global demand. If tensions escalate further into military confrontation or affect major oil supply chains, we could see a temporary pullback or risk aversion across equities—including US30.
Trade Idea:
Bias: Bullish continuation (if current structure holds).
Entry Zone: Around 41,940–42,100 on a retest with bullish confirmation.
Stop Loss: Below 41,185 (structure invalidation).
Take Profit: First TP at 44,472; extended TP at 44,620 or channel top.
Invalidation: Break below 41,185 with a daily close.
In conclusion, unless the conflict between Iran and Israel leads to a sharp risk-off move, US30 appears poised for bullish continuation driven by technical momentum, strong market structure, and medium-term economic optimism. However, traders should monitor headlines closely, as escalation in the Middle East could introduce significant volatility.
