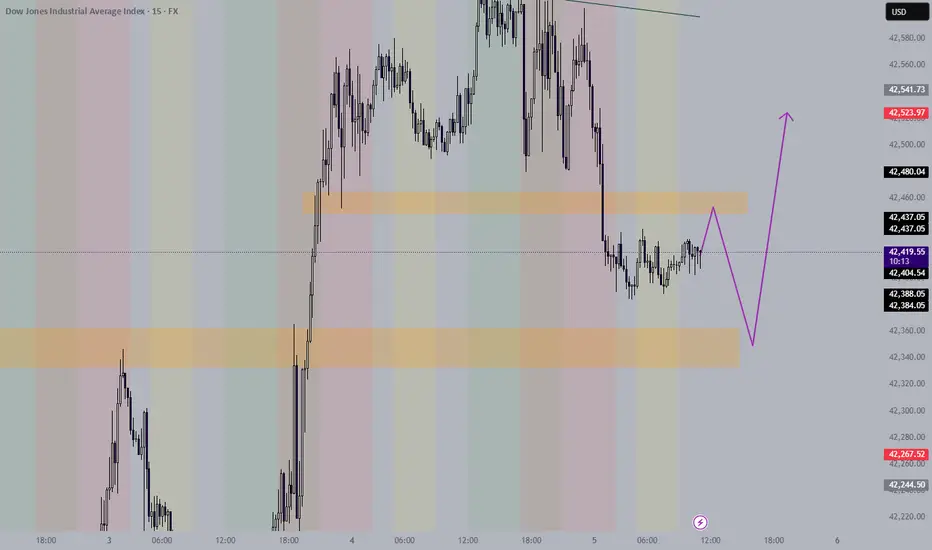
Major US30 sell setup 5 June 2025We chOch on H4 had a major pullback then shifted structure on the extreme supply
WS30M trade ideas

US30 Trade Update – 06/05/2025🚨 US30 Trade Update – 06/05/2025 🚨
📊 Market Structure & Key Levels
US30 continues to respect bullish structure, trading above the 42,400 zone and reclaiming strength after consolidating around key support levels. Buyers are holding control with price now at 42,480+.
🔍 Key Observations:
✅ Still holding above 41,947 structure zone
✅ Higher lows intact – bullish continuation likely
🔼 Resistance in focus: 42,700 → 42,900
🎯 Trade Plan:
🔹 Long Setup:
Buy on pullbacks to 42,300–42,400
→ Target: 42,700 – 42,900
🔻 Short Setup:
Only valid on break & close below 41,947
→ Target: 41,261 – 40,983
⚠️ Trend remains bullish – follow momentum but watch for exhaustion near resistance!


US30 I Bearish Reversal Based on the M30 chart, the price is rising toward our sell entry level at 42,481.32, a pullback resistance that aligns with the 38.2% Fib retracement.
Our take profit is set at 42,326.96, a pullback support that aligns closely with the 50% Fib retracement.
The stop loss is set at 42,646.90, a swing high resistance.
High Risk Investment Warning
Trading Forex/CFDs on margin carries a high level of risk and may not be suitable for all investors. Leverage can work against you.
Stratos Markets Limited (tradu.com ):
CFDs are complex instruments and come with a high risk of losing money rapidly due to leverage. 63% of retail investor accounts lose money when trading CFDs with this provider. You should consider whether you understand how CFDs work and whether you can afford to take the high risk of losing your money.
Stratos Europe Ltd (tradu.com ):
CFDs are complex instruments and come with a high risk of losing money rapidly due to leverage. 63% of retail investor accounts lose money when trading CFDs with this provider. You should consider whether you understand how CFDs work and whether you can afford to take the high risk of losing your money.
Stratos Global LLC (tradu.com ):
Losses can exceed deposits.
Please be advised that the information presented on TradingView is provided to Tradu (‘Company’, ‘we’) by a third-party provider (‘TFA Global Pte Ltd’). Please be reminded that you are solely responsible for the trading decisions on your account. There is a very high degree of risk involved in trading. Any information and/or content is intended entirely for research, educational and informational purposes only and does not constitute investment or consultation advice or investment strategy. The information is not tailored to the investment needs of any specific person and therefore does not involve a consideration of any of the investment objectives, financial situation or needs of any viewer that may receive it. Kindly also note that past performance is not a reliable indicator of future results. Actual results may differ materially from those anticipated in forward-looking or past performance statements. We assume no liability as to the accuracy or completeness of any of the information and/or content provided herein and the Company cannot be held responsible for any omission, mistake nor for any loss or damage including without limitation to any loss of profit which may arise from reliance on any information supplied by TFA Global Pte Ltd.
The speaker(s) is neither an employee, agent nor representative of Tradu and is therefore acting independently. The opinions given are their own, constitute general market commentary, and do not constitute the opinion or advice of Tradu or any form of personal or investment advice. Tradu neither endorses nor guarantees offerings of third-party speakers, nor is Tradu responsible for the content, veracity or opinions of third-party speakers, presenters or participants.

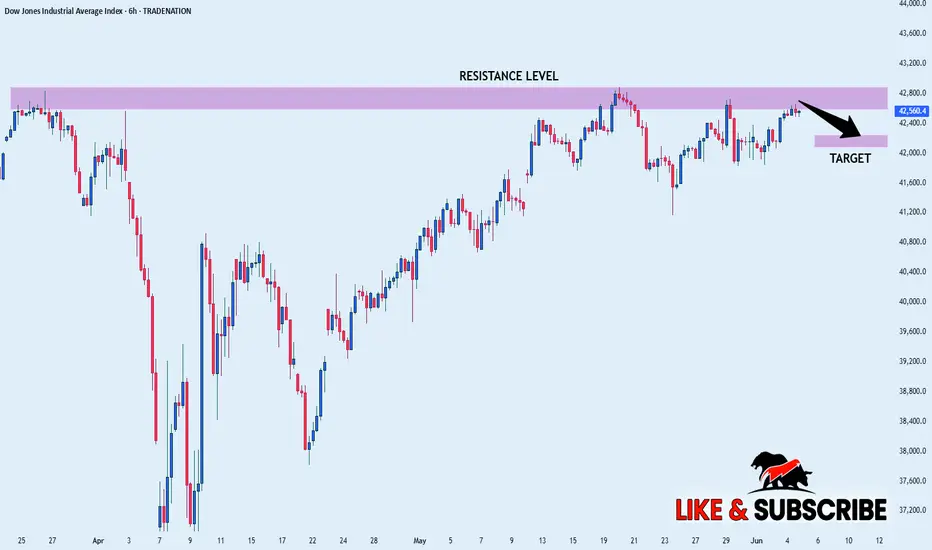
US30 WILL FALL|SHORT|
✅DOW JONES is going up now
But a strong resistance level is ahead at 42,800
Thus I am expecting a pullback
And a move down towards the target of 42,241
SHORT🔥
✅Like and subscribe to never miss a new idea!✅
Disclosure: I am part of Trade Nation's Influencer program and receive a monthly fee for using their TradingView charts in my analysis.
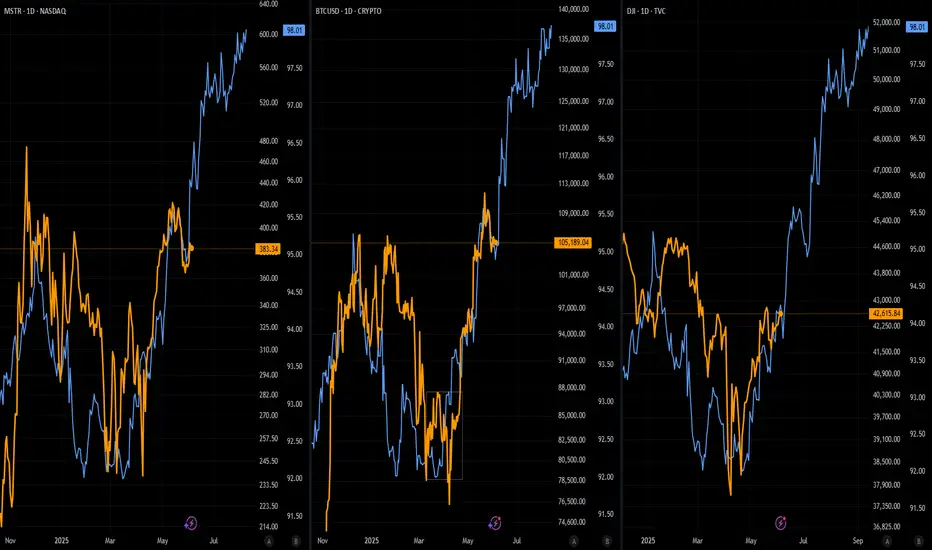
M2 FractalFriends... MSTR, BTC and DJI are all tracking M2 beautifully. Should this fractal continue to prove as reliable, we should see big moves in the coming weeks. Limit you exposure to leverage, it's just not worth it! Stay in MSTR stock and BTC spot.
Market Heist in Progress! US30/DJI Long Trade – Ride or Escape?🔥 "The US30/DJI Heist: Bullish Loot & Escape Before the Trap!" 🔥
🌟 Hi! Hola! Ola! Bonjour! Hallo! Marhaba! 🌟
Dear Money Makers & Market Robbers, 🤑💰💸✈️
Based on the 🔥Thief Trading Style🔥 (technical + fundamental analysis), here’s our master plan to heist the US30/DJI (Dow Jones Industrial Average). Follow the strategy on the chart—long entry is the play! Aim to escape near the high-risk RED Zone (overbought, consolidation, potential reversal). The bears are lurking, so take profits and treat yourself—you’ve earned it! 💪🏆🎉
🚀Entry (The Vault is Open!)
"Swipe the bullish loot at any price!"
For precision, place buy limit orders within 15-30min timeframe (recent swing lows/highs).
Set alerts! Don’t miss the heist.
🛑 Stop Loss (Safety Net)
Thief-style SL at nearest swing low (3H timeframe) → 41,400 (adjust based on risk/lot size).
🏴☠️ Target 🎯: 44,200.00
Bullish momentum is fueling this heist—ride the wave but exit before the trap!
📰 Fundamental Backing (Why This Heist Works)
Macroeconomic trends, COT data, geopolitics, and sentiment align for bullish moves.
Full analysis? Check our bio0 linkk! 👉🔗🌎
⚠️ Trading Alerts (News & Risk Mgmt)
Avoid new trades during high-impact news (volatility = danger).
Use trailing stops to lock profits and dodge sudden reversals.
💥 Boost This Heist!
Hit 👍 (Boost Button) to strengthen our robbery squad!
More heists = More profits—stay tuned for the next steal! 🚀🤑
See you soon, fellow thieves! 🤝🎉

NFP Setups: Dow Breakout or USDJPY Breakdown?Big moves ahead? Friday’s Non-Farm Payrolls could be the trigger. ADP came in weak, jobless claims spiked, and ISM data disappointed. Now all eyes are on the Dow Jones and USDJPY. A strong NFP could send the Dow to new highs, while a weak one may sink USDJPY toward the 2025 low.
Watch the full breakdown and share your take in the comments.
This content is not directed to residents of the EU or UK. Any opinions, news, research, analyses, prices or other information contained on this website is provided as general market commentary and does not constitute investment advice. ThinkMarkets will not accept liability for any loss or damage including, without limitation, to any loss of profit which may arise directly or indirectly from use of or reliance on such information.

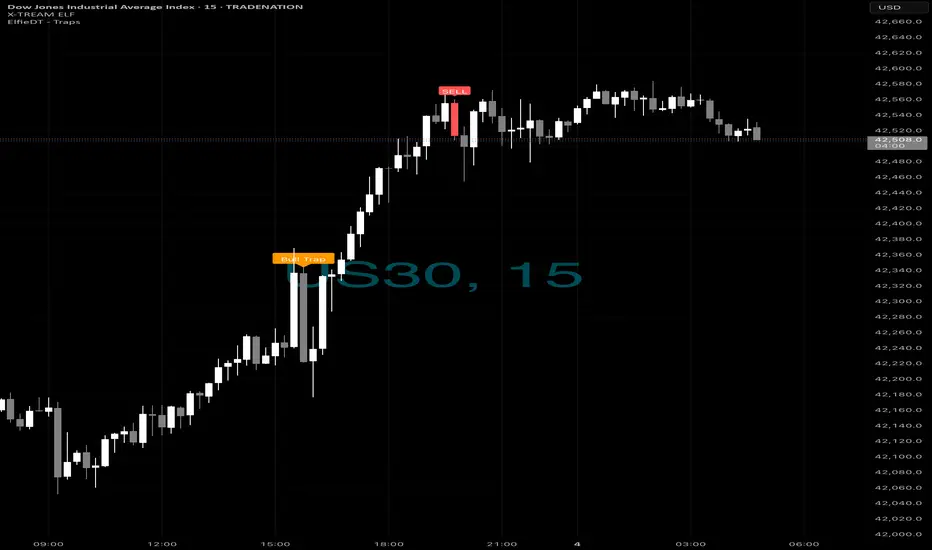
US30 SELL OPPORTUNITY (Trade what you see on not what you feel)Everything explained on the picture.
1. 3rd Touch
2. FVG
3. Possible break of TL
1 + 2 + 3 = Sell

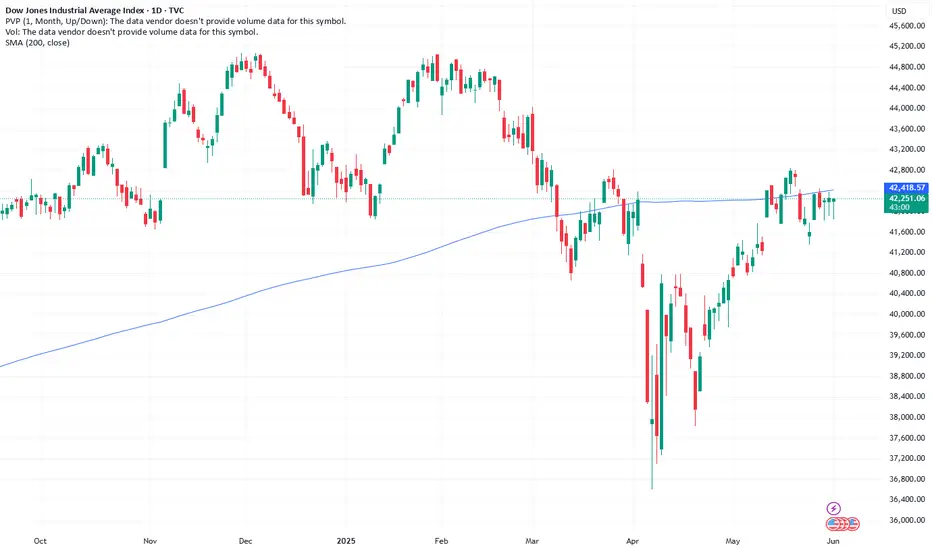
DOW JONES starting the new Bullish Leg.Dow Jones (DJI) is rallying off its 4H MA50 (blue trend-line), shortly after making a new Higher Low on its 6-week Channel Up. Technically that is the start of its new Bullish Leg.
With the 4H RSI being identical to the Bullish Leg at the start of the Channel Up, we expect it to again rise by +4.30% and touch the 2.0 Fibonacci extension. Target 43600.
-------------------------------------------------------------------------------
** Please LIKE 👍, FOLLOW ✅, SHARE 🙌 and COMMENT ✍ if you enjoy this idea! Also share your ideas and charts in the comments section below! This is best way to keep it relevant, support us, keep the content here free and allow the idea to reach as many people as possible. **
-------------------------------------------------------------------------------
Disclosure: I am part of Trade Nation's Influencer program and receive a monthly fee for using their TradingView charts in my analysis.
💸💸💸💸💸💸
👇 👇 👇 👇 👇 👇

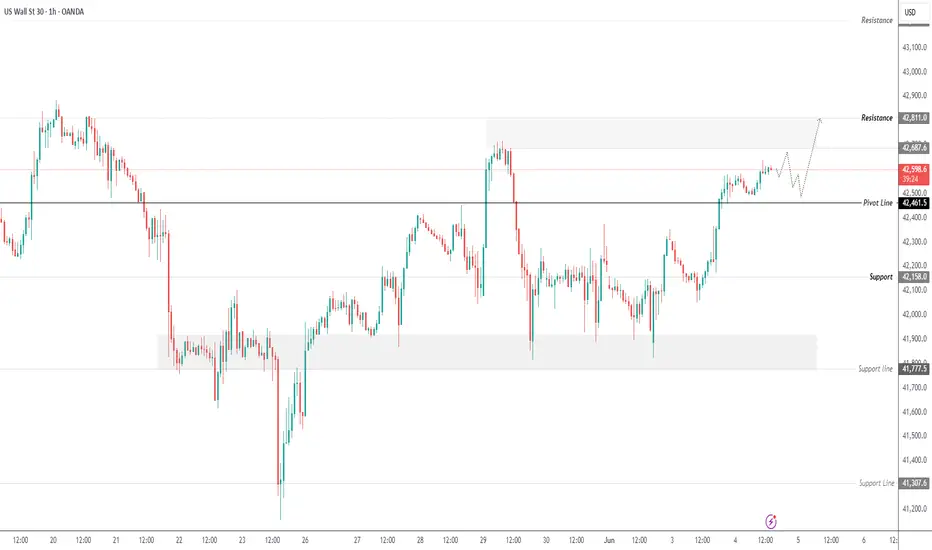
US30 – Key Resistance at 42690 Ahead of ADP-Driven VolatilityUS30
The indices market is expected to be highly volatile today due to upcoming data releases, especially the ADP employment report.
Dow Jones (US30) appears to be continuing its bullish scenario toward 42690.
A break above 42690 may push the price further toward 42810, and if momentum holds, toward 43200.
However, stability below 42690 could trigger a strong correction toward 42460.
A sustained move below the pivot line at 42570 would shift the trend to bearish.
Resistance: 42690, 42810, 43200
Support: 42460, 42260, 42080
USA30 trading I deaHi traders is mpho again this is my trading plan for dow it's a clear set up, however fundamentals can violate set up as.we are trading under tarrrif territory but am encouraging you to stick in the trend n counter tarrif n not overthink n quickly take a decision to change the directions make sure you have confirmations before jump into any trends,as always nothing much analysis speak for it selfs more than words can,I wish you all the best 👍

DOW SHORTS?what do you think?
Reasy for the drop?
When tou use our indicators - you can have a view from all timeframes,,,,,
Multi-Time Frame Analysis (MTF) — Explained SimplyWant to level up your trading decisions? Mastering Multi-Time Frame Analysis helps you see the market more clearly and align your trades with the bigger picture.
Here’s how to break it down:
🔹 What is MTF Analysis?
It’s the process of analyzing a chart using different time frames to understand market direction and behavior more clearly.
👉 Example: You spot a trade setup on the 15m chart, but you confirm trend and structure using the 1H and Daily charts.
🔹 Why Use It?
✅ Avoids tunnel vision
✅ Aligns your trades with the larger trend
✅ Confirms or filters out weak setups
✅ Helps you find strong support/resistance zones across time frames
🔹 The 3-Level MTF Framework
Use this to structure your chart analysis effectively:
Higher Time Frame (HTF) → Trend Direction & Key Levels
📅 (e.g., Daily or Weekly)
Mid Time Frame (MTF) → Structure & Confirmation
🕐 (e.g., 4H or 1H)
Lower Time Frame (LTF) → Entry Timing
⏱ (e.g., 15m or 5m)
🚀 If you’re not using MTF analysis, you might be missing critical market signals. Start implementing it into your strategy and notice the clarity it brings.
💬 Drop a comment if you want to see live trade examples using this method!

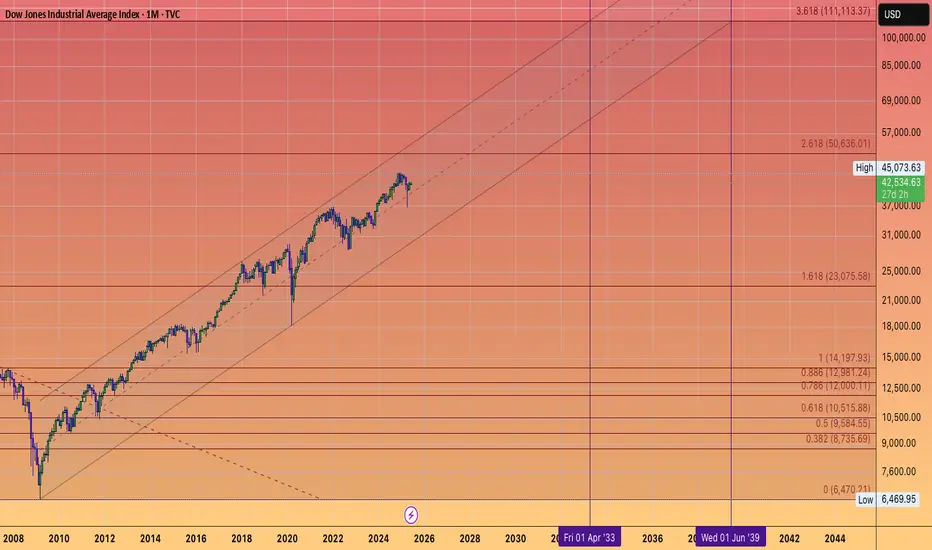
DOW JONES TO 111 THOUSAND..in the the 2030's.
as an investor you must be thinking 2 decades down the line.
NOT 2 quarters.
They can not
stop
printing #FIAT
it's in the code.
A 8% compound rate puts the Dow Jones at 85,000 in 2034.
I'm long forever.
US30: Next Move Is Down! Short!
My dear friends,
Today we will analyse US30 together☺️
The recent price action suggests a shift in mid-term momentum. A break below the current local range around 42,499.2 will confirm the new direction downwards with the target being the next key level of 42,320.2.and a reconvened placement of a stop-loss beyond the range.
❤️Sending you lots of Love and Hugs❤️
DowJones INTRADAY broader concern over global trade headwindsTrade Tensions: US-China, US-Europe
Trump and Xi May Speak This Week: The call—if it happens—comes amid rising tensions over critical mineral exports, crucial for electronics and clean tech.
Market Implication: Ongoing uncertainty in US-China trade could pressure tech, EVs, and semiconductors, which rely on these materials. Watch for volatility in those sectors.
Europe Talks Stalling: Trade negotiations with Europe are also breaking down, with new tariff threats emerging.
Trading Angle: Defensive positioning in multinationals and exporters may be prudent. Currency pairs like EUR/USD could see movement on headline risk.
Corporate Layoffs: Disney, Microsoft
Disney & Microsoft Cut Jobs: Hundreds of layoffs in media and tech highlight continued weakness in entertainment and enterprise software demand.
Trading Relevance: Signals profit-margin pressure and shifting labor costs. Potential bearish signal for media ETFs and tech sector if layoff trend broadens.
China E-Commerce Firms Shift to Europe
Strategic Pivot: Chinese platforms are diversifying away from US markets due to tariffs and restrictions.
Market Watch: Could benefit European retail and logistics stocks. May also impact Chinese ADRs traded in the U.S.
Elon Musk’s xAI Debt Sale
$5B Debt Offering: Musk is raising capital for his AI venture, xAI Corp., while stepping back from politics.
Investor Focus: Watch Tesla and other Musk-related equities for capital allocation impacts. The move could dilute attention and increase risk premiums on his companies.
Harvard Legal Battle
Free Speech Lawsuit: Harvard pushes back on a Trump-era funding freeze.
Trading Impact: Limited direct effect, but feeds into broader political noise. May influence education sector stocks or legal/regulatory sentiment.
Wall Street Trade Idea (Nomura)
Strategy: Short S&P 500 on Trump trade threats, cover 5 days later → yielded 12% since February.
Application: Suggests short-term tactical trades can exploit volatility driven by political rhetoric. Useful for active traders focused on news-driven momentum.
Market Outlook
Futures Lower Today: Reflects broader concern over global trade headwinds.
Key Sectors to Watch: Tech (semis, EVs), Media, Chinese ADRs, European exporters, and AI-related plays.
Key Support and Resistance Levels
Resistance Level 1: 42920
Resistance Level 2: 43300
Resistance Level 3: 43620
Support Level 1: 41470
Support Level 2: 41160
Support Level 3: 40890
This communication is for informational purposes only and should not be viewed as any form of recommendation as to a particular course of action or as investment advice. It is not intended as an offer or solicitation for the purchase or sale of any financial instrument or as an official confirmation of any transaction. Opinions, estimates and assumptions expressed herein are made as of the date of this communication and are subject to change without notice. This communication has been prepared based upon information, including market prices, data and other information, believed to be reliable; however, Trade Nation does not warrant its completeness or accuracy. All market prices and market data contained in or attached to this communication are indicative and subject to change without notice.

DOWJ- US30 1hr FVG Inverted, orders filled, continuation to 41,812 once close below 42,172.
... thoughts?.

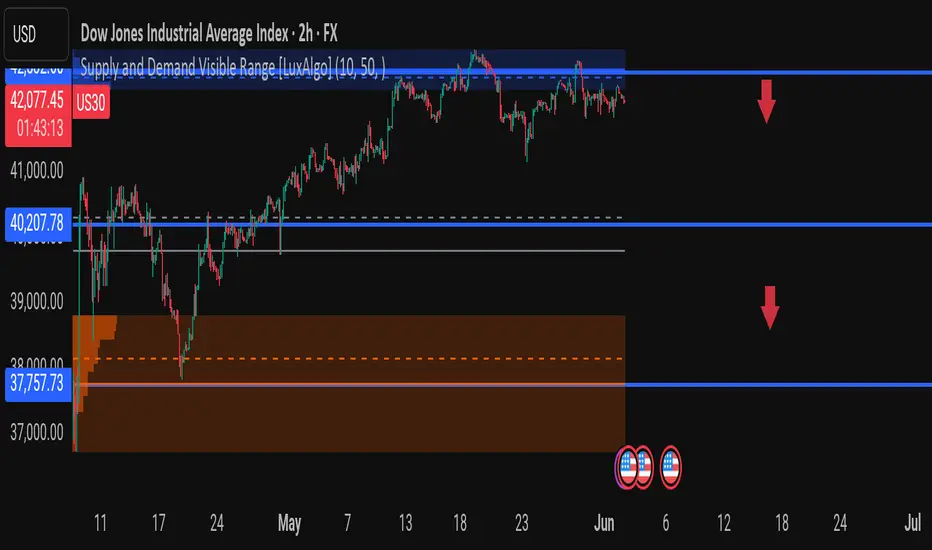
US30 (Dow Jones) – Major Supply Zone Rejection! 🔵 Key Zones in Focus:
42,082.00 – Major Supply Zone (price struggling here for days – exhaustion signs)
40,207.78 – Support level with potential for short-term bounce
37,757.73 – High Volume Node / Demand Zone, strong buyer reaction area from May
---
📌 Technical Breakdown:
Price is facing heavy resistance at the upper blue zone (Supply) – no breakout yet!
Multiple failed attempts to break above = distribution in progress?
Volume dropping near highs → early warning of trend exhaustion
Clean downside structure setup with two clear bearish targets
---
🎯 Trade Idea:
📉 Sell Bias unless price breaks and closes above 42,100 with volume
First Target: 40,207
Second Target: 37,757 (Demand Cluster)
---
📢 What’s your move on US30? 📊 Are you shorting this Supply Zone too or expecting a breakout?
💬 Share your setup below – let's compare strategies!
👍 Like if this was useful
🔁 Repost to help others catch this move
📈 Follow for weekly market setups & clean charts!
#US30 #DowJones #TradingView #SupplyAndDemand #BearishReversal #PriceActionTrading #VolumeProfile #SmartMoney #ForexSignals #TechnicalAnalysis #DayTrading #SwingTradeSetups
US30 Falling Wedge Breakout – Bullish Reversal ConfirmedPrice formed a classic falling wedge pattern, often considered a bullish reversal signal. The breakout above resistance confirms bullish momentum.
✅ Breakout above resistance
🔁 Retest of the breakout zone near 42,100
🎯 Targeting next resistance at 42,400–42,600
🛑 Stop-loss below 42,000

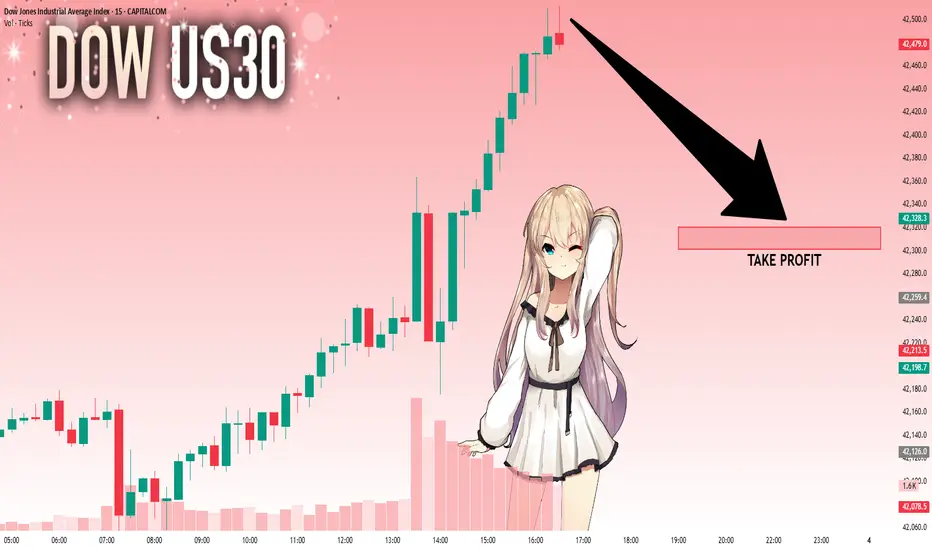
[Scalping] Long US30 (June 2, 2025)Entry was 42274.1
TP is 42298.15
SL is 42258.03
RR is 1:1.5-2
This is just record purpose with new method to trade.
Please allow this test period.
**I use only session indicator.
Other than that I do not use any indicators
New method can be used only for manual trading.

Dow Jones Signals Two Key Levels for Upside Gains Targets:
- T1 = $43200
- T2 = $43800
Stop Levels:
- S1 = $41600
- S2 = $40400
**Wisdom of Professional Traders:**
This analysis synthesizes insights from thousands of professional traders and market experts, leveraging collective intelligence to identify high-probability trade setups. The wisdom of crowds principle suggests that aggregated market perspectives from experienced professionals often outperform individual forecasts, reducing cognitive biases and highlighting consensus opportunities in Dow Jones.
**Key Insights:**
Traders should watch for short-term volatility driven by mixed technical patterns and geopolitical risks. Indicators signal potential upward momentum but require confirmation near resistance zones. Medium-term sentiment remains cautious due to inflationary pressures and fiscal concerns.
**Recent Performance:**
The Dow Jones gained 1.60% last week, showcasing resilience amid uncertain global conditions. Volatility has decreased slightly but remains a key driver of short-term fluctuations. Industrial and energy sectors supported gains, while healthcare lagged behind.
**Expert Analysis:**
Short-term RSI and MACD readings suggest ongoing bullish momentum, but stochastic signals introduce caution. Geopolitical factors, particularly U.S.-China trade policy concerns and elevated bond yields, pose risks to market stability. Long-term indicators maintain more favorable sentiment.
**News Impact:**
Declining inflation eases long-term fears, while escalating trade tensions weigh on export-heavy Dow components. Key domestic events, including reduced consumer spending, reflect slowing demand in sectors like airlines and retail. Meanwhile, international market weakness dampens sentiment, particularly in Asia as the Hang Seng Index declines.
**Trading Recommendation:**
With mixed technical signals and moderate risks, a cautiously optimistic LONG position is recommended for Dow Jones. The asset is positioned for gains if price action maintains strength above $42,270. Tight stop levels ensure risk management, targeting $43,200 initially and extending to $43,800 under favorable conditions.