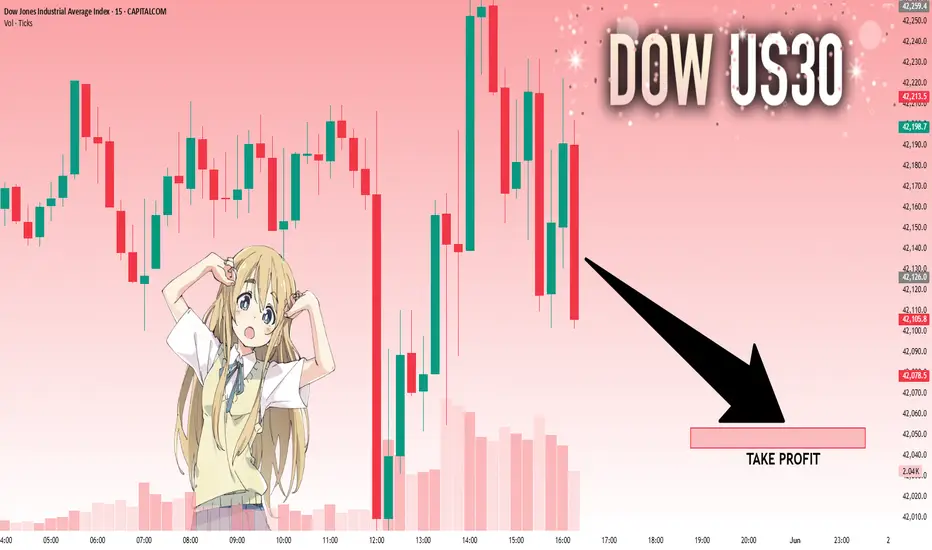
SELL US30 - SELLERS STEPPING INFlag pattern. Sellers stepping in. Selling opportunity. Back to the basics!
WS30M trade ideas
DOW JONES: Inverse Head and Shoulders looking for a breakout.Dow Jones is marginally bullish on its 1D technical outlook (RSI = 55.600, MACD = 267.860, ADX = 21.901) as just now it is attempting to be detached from the 4H MA50. Technically this could be the attempt to break towards the 2.0 Fibonacci extension, after having formed the RS of an Inverse head and Shoulders pattern. With the 4H MACD close to a Bullish Cross, we are bullish, TP = 44,250.
## If you like our free content follow our profile to get more daily ideas. ##
## Comments and likes are greatly appreciated. ##

US30 SELLING ON DIPS !!HELLO TRADERS
AS I CAN SEE US30 is fail to break resistence zone after making a ATH its time to retrace as we can see bad econmy of US and GDP investors will pull money from stocks and invest in Safe haven so our Risk reward is great for us it is just a trade idea share ur thoughts stay tuned for more updates

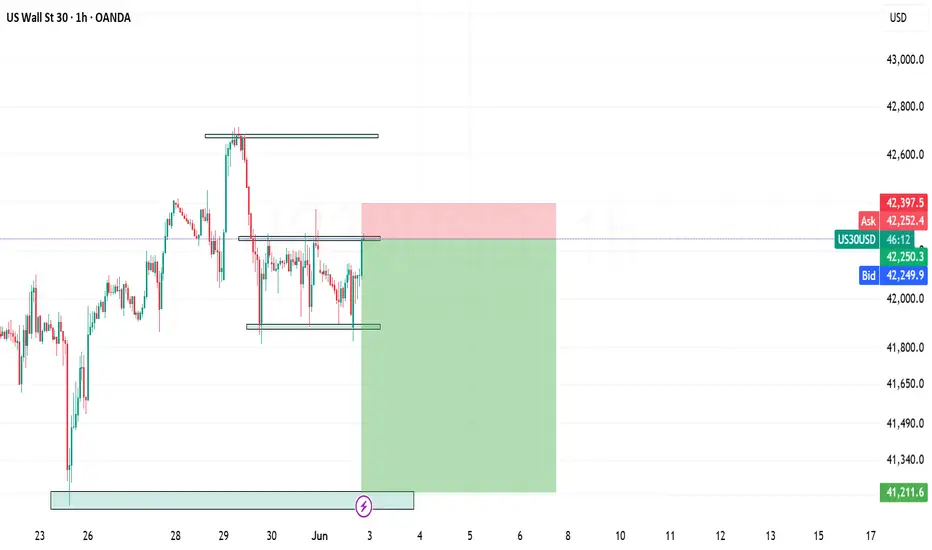
US30 JUNE 2What did the Buffalo say to his son when he left home? Bison...
Anyway, let's get to work. Price is looking very messy. So instead of trading it I'm going to draw a box around the consolidation and wait for price to break and retest the ends of the boxes.
Like always I'll wait for the 1m for price to break and retest before I enter the trade.
NEVER Trade Consolidation, it gets messy quickly.
Anywho... Have fun trading and be patient.
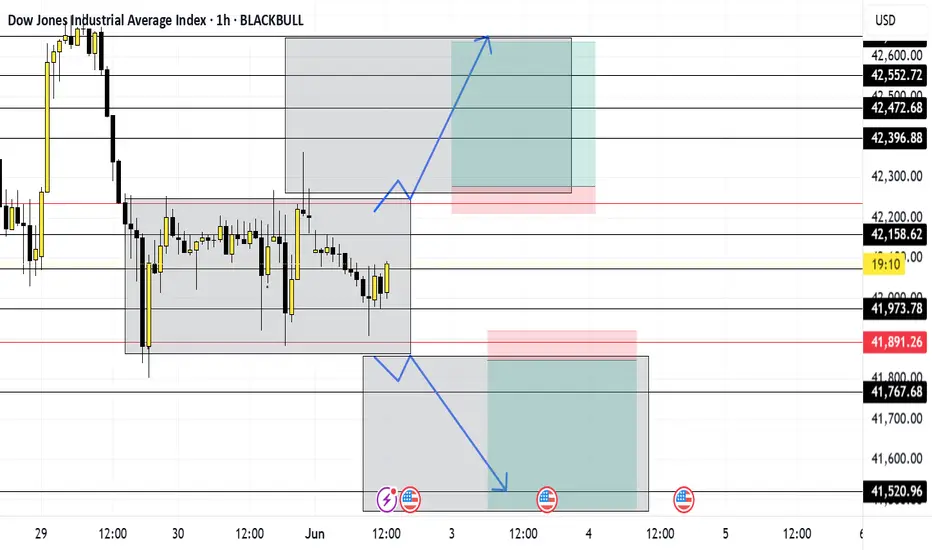
possibility of uptrendIt is expected that after some fluctuation and correction, a trend change will occur and an upward trend will begin.
If the index breaks through the support area, a continuation of the downward trend to the specified support levels will be possible.

US30 Bearish Rejection at Resistance – Potential Drop Ahead📉 US30 Bearish Rejection at Resistance – Potential Drop Ahead 🚨
The US30 (Dow Jones Industrial Average) is exhibiting signs of bearish weakness after rejecting a strong resistance zone around 42,898.9 - 43,800.8. Here's a breakdown of the current market structure and outlook:
🔍 Technical Analysis
📌 Resistance Zone (Sell Pressure)
Price has failed to break above the marked resistance area multiple times.
Strong wicks and rejections indicate seller dominance near the top.
A short-term bounce into the resistance is anticipated before a likely reversal.
📌 Support Zone (Buy Interest)
The key support is at 39,396.2 - 39,585.5.
This zone has previously served as a strong demand area, with multiple bullish reversals in the past.
📌 Bearish Projection Path
Chart shows a potential rejection pattern playing out.
Price is expected to retest the resistance, then decline towards the support zone.
Intermediate support levels:
41,225.0
40,630.2
🔄 Outlook
🛑 Scenario A (Likely):
Price tests the upper resistance again and forms a double top or shooting star before declining toward the 39.5k support zone.
✅ Scenario B (Invalidation):
If price closes above 43,800 with strong volume, bearish bias will be invalidated, and a bullish continuation can be expected.
🧭 Trade Idea (Not Financial Advice)
🔹 Entry: Short near 42,800–43,000 (after confirmation)
🔹 Target 1: 41,225
🔹 Target 2: 40,630
🔹 Final Target: 39,585
🔹 Stop Loss: Above 43,800
Conclusion:
⚠️ The chart indicates a high-probability short setup unless bulls manage a strong breakout above resistance. Eyes on the price action near resistance for confirmation. 📉📊

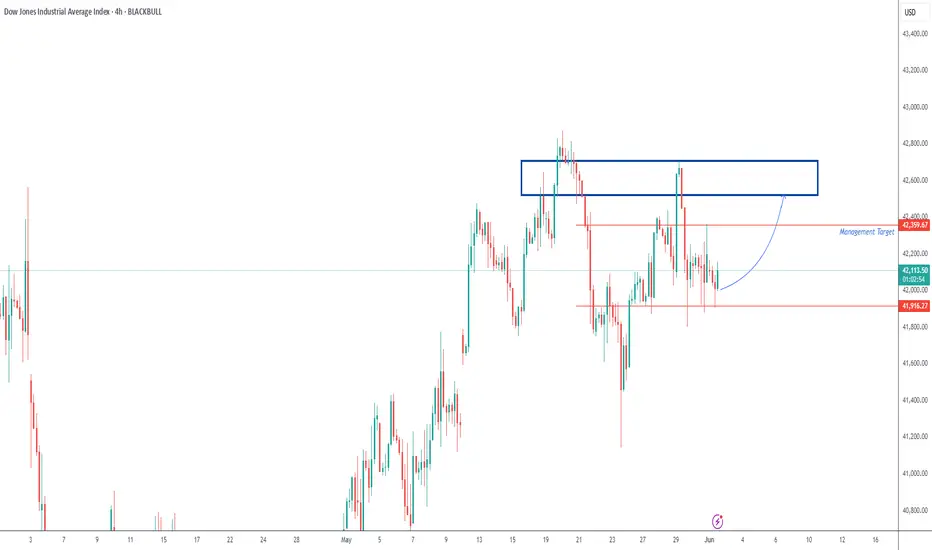
Dow Jones Bullish Setup A potential bullish setup is forming on the Dow Jones Industrial,
suggesting a long opportunity upon confirmation. The trade will only activate if key validation criteria are met, targeting a 1:3 risk-reward ratio.
US30 Is Going Down! Short!
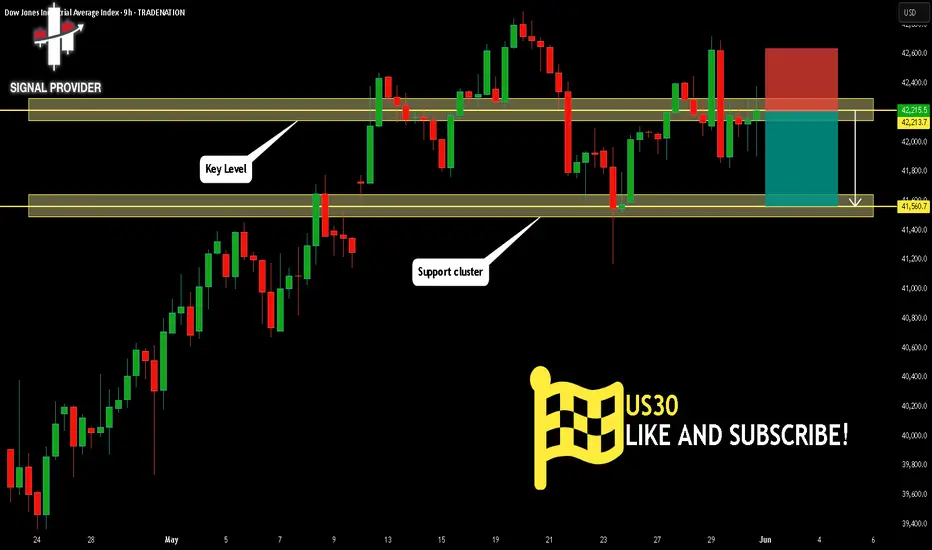
Please, check our technical outlook for US30.
Time Frame: 9h
Current Trend: Bearish
Sentiment: Overbought (based on 7-period RSI)
Forecast: Bearish
The price is testing a key resistance 42,213.7.
Taking into consideration the current market trend & overbought RSI, chances will be high to see a bearish movement to the downside at least to 41,560.7 level.
P.S
The term oversold refers to a condition where an asset has traded lower in price and has the potential for a price bounce.
Overbought refers to market scenarios where the instrument is traded considerably higher than its fair value. Overvaluation is caused by market sentiments when there is positive news.
Disclosure: I am part of Trade Nation's Influencer program and receive a monthly fee for using their TradingView charts in my analysis.
Like and subscribe and comment my ideas if you enjoy them!
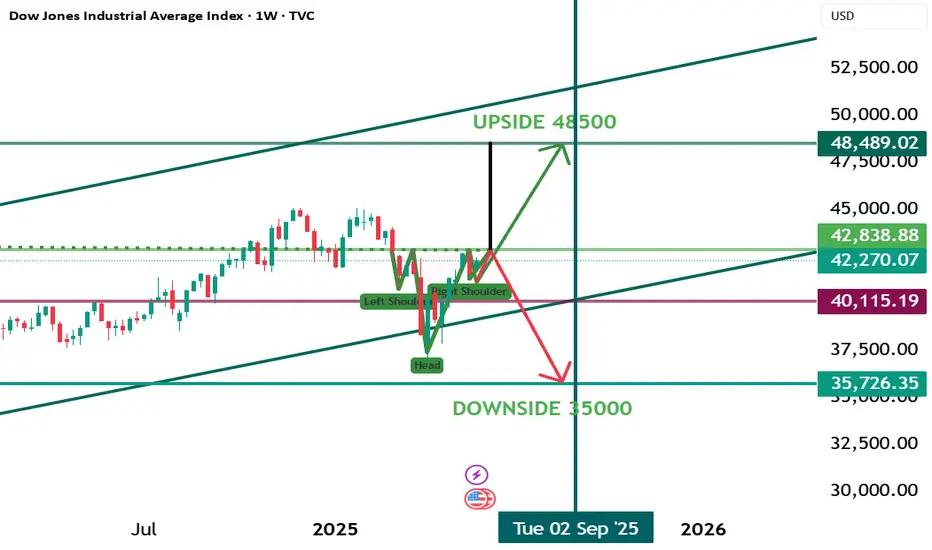
DOW 48500 or 35000 What's Coming Next? Daily 200 EMA Close
Weekly 200 EMA Retested and pullback in W pattern
Inverted head and shoulder breach on 43000 Upsides till 48500
36 trillion Ticking Debt by USA Downside till 35000
Wait till FED data, job employment and payroll data
DJI 1920/30 - 2020/30Ok I'll let her go I'll let her go lyrics meaning ok I just wanted her go I'll let her go lyrics to I can do it on my to do it again next year is it on Netflix or Amazon and they have her number and they

Understanding Market StructureIn this video, I break down market structure in a simple and easy-to-digest way, helping you understand how to identify whether the market is in an uptrend or downtrend.
Recognizing market direction is a key skill for any trader, it allows you to trade in alignment with price action and make more confident, higher-probability decisions.
✅ If you're new to trading or want to sharpen your edge, this video will give you the insights needed to read market trends more clearly.
📈 Hope you find value in this breakdown!
👉 Don’t forget to like, comment, and subscribe to support the channel and stay tuned for more educational content.

US30: Will Go Down! Short!
My dear friends,
Today we will analyse US30 together☺️
The in-trend continuation seems likely as the current long-term trend appears to be strong, and price is holding below a key level of 42,126.0 So a bearish continuation seems plausible, targeting the next low. We should enter on confirmation, and place a stop-loss beyond the recent swing level.
❤️Sending you lots of Love and Hugs❤️
DowJones INTRADAY Key trading zone retestKey Support and Resistance Levels
Resistance Level 1: 42,920
Resistance Level 2: 43,300
Resistance Level 3: 43,620
Support Level 1: 41,470
Support Level 2: 41,160
Support Level 3: 40,890
This communication is for informational purposes only and should not be viewed as any form of recommendation as to a particular course of action or as investment advice. It is not intended as an offer or solicitation for the purchase or sale of any financial instrument or as an official confirmation of any transaction. Opinions, estimates and assumptions expressed herein are made as of the date of this communication and are subject to change without notice. This communication has been prepared based upon information, including market prices, data and other information, believed to be reliable; however, Trade Nation does not warrant its completeness or accuracy. All market prices and market data contained in or attached to this communication are indicative and subject to change without notice.

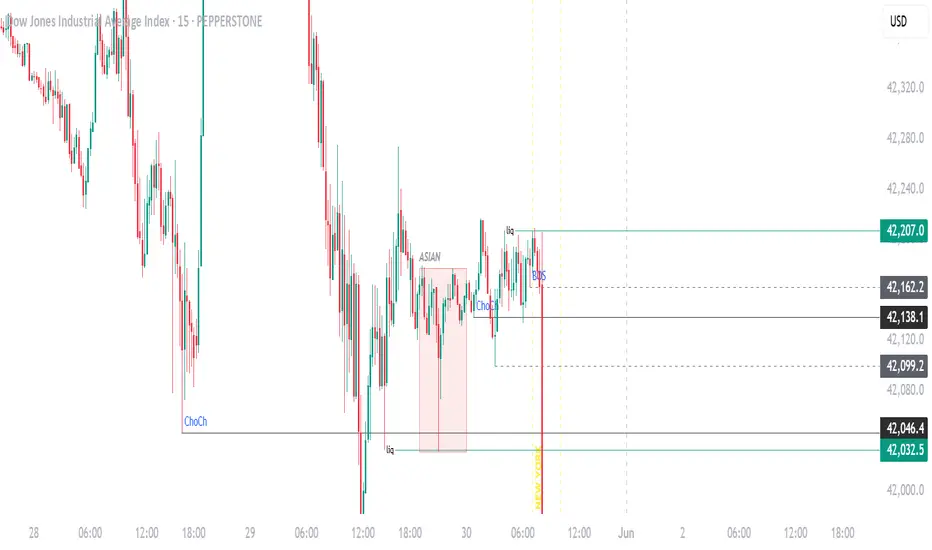
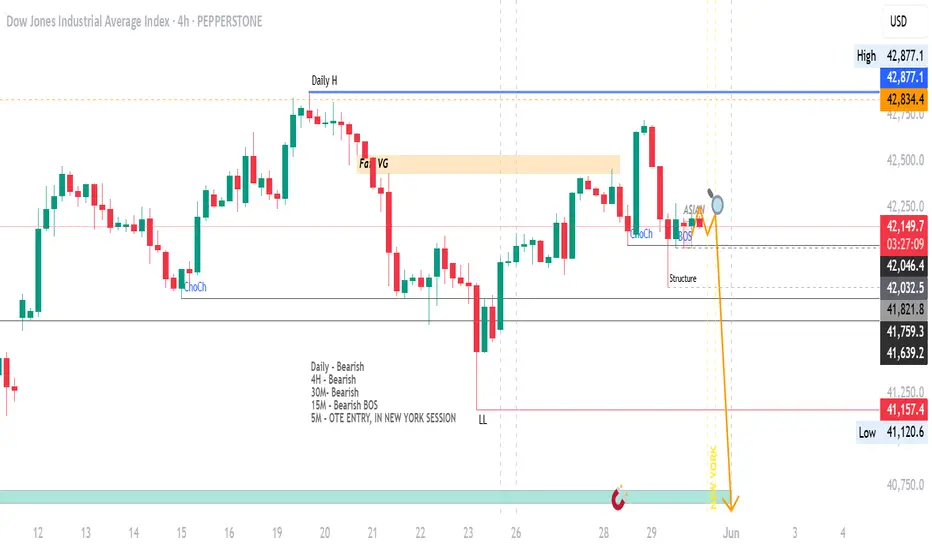
DOW JONES UPDATEAs previously stated, we are in our prime time of attack within the New York session.
Seek 5min bearish ChoCh to align with all the higher timeframes to deliver the weekly expansion downside.
Heavy Bullish Bias — LONG Until Proven OtherwiseStructure is aligning across multiple timeframes. Momentum building up, liquidity sweeps done, demand zones respected. I'm stacking longs — one level at a time. Not chasing, just following the flow. Let the market do its thing.

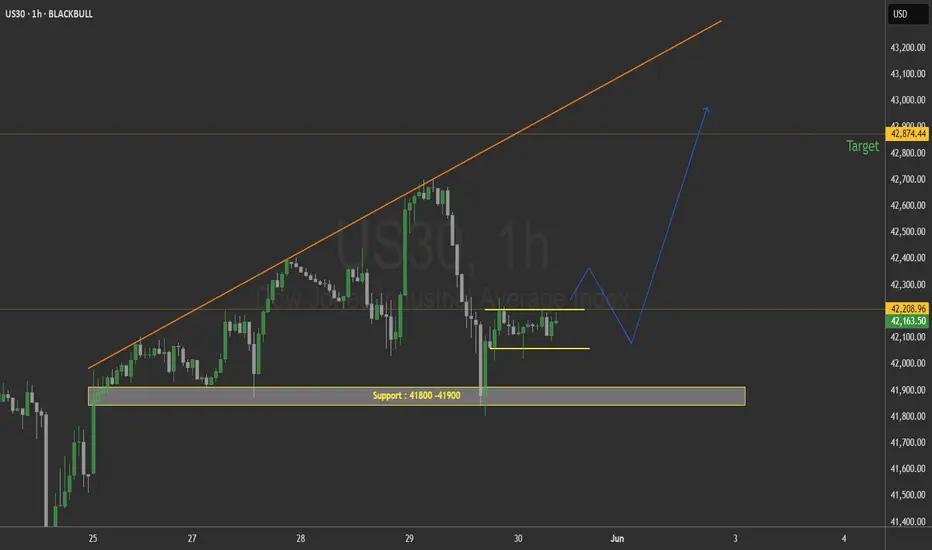
US30 :: Buy SetupUS Dow Jones Buy Setup
1 Hour Chart
Wait for a breakout and buy @retest
Support : 41800 -41900
DOW JONES FORECAST"The guns are primed".
we expect to see heavy Bearishness from US Stock Indices today, the "dumping" price action catalyst is a heavily bullish US Dollar for reference we use Gold and US Bonds for current market conditions.
Seek Bearish profile on the 15M - 5M to trigger Bearish dealing model.
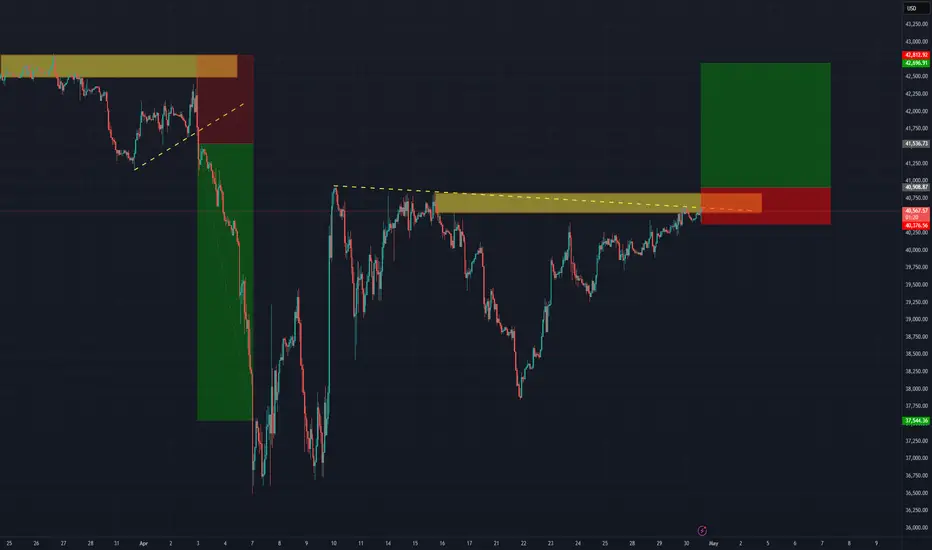
Possibility of uptrend Wave c is expected to end at the green support zone and start an uptrend. A break of the support zone will invalidate the above scenario.

US30US30 Daily time frame analysis
Inverted Head/shoulder pattern formed also facing downtrend resistance
Take entry after break of neckline
Targets mention

US30 - LONGIntraday trade. Had a nice spike to the upside after tariffs news. London session reversed and now looking for price to push back up and wipe away the London session sell off.

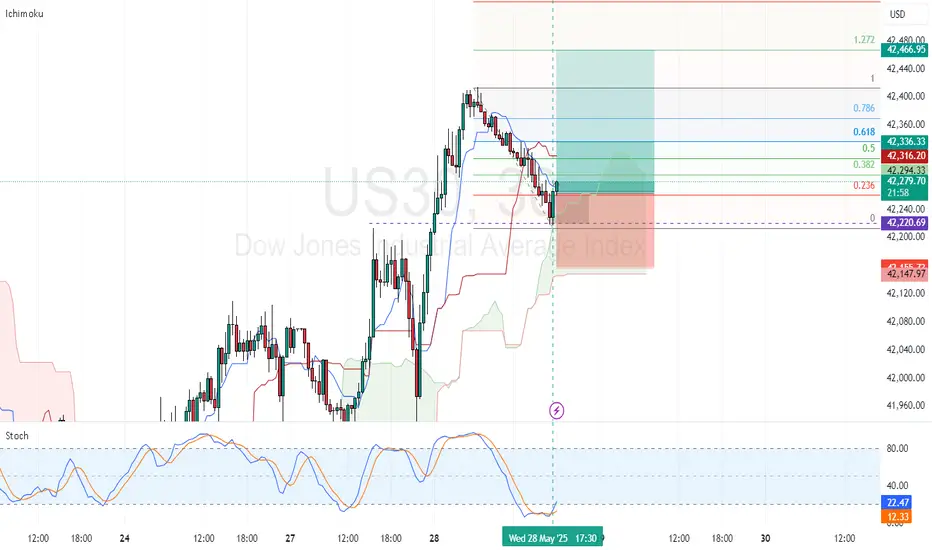
US30 Footprint Update | May 29, 2025We're witnessing a clear shift in order flow dynamics on the 1H footprint chart.
🔻 Earlier in the session, sellers were firmly in control with heavy negative delta and large sell imbalances between 42,280–42,120.
🔄 Key Change: Around 42,088–42,177, aggressive selling was absorbed, followed by a strong bullish delta of +125 and increasing buyer interest in the following candles. Volume has flipped in favor of buyers.
📈 Current Price: Holding around 42,191.50, just below the key resistance zone of 42,231. A clean break and acceptance above this level could confirm a bullish shift toward 42,280–42,300.
🧠 What I’m Watching:
Break and hold above 42,231 = long continuation
Failure to sustain = possible retest of 42,177 or lower support
🎯 Volume and delta are aligning in favor of bulls — let’s see if they can take control.
