FXS TO THE WHITE LINEWe were in and booked partial earlier , now again entered
FXSUSD Long
📦 Entry Zone: $3.0237 (Marked on chart)
🎯 TP1: $3.207
🎯 TP2: $3.487
❌ SL: $2.7760
🧠 Strategy:
✅ Use low leverage
✅ Risk only 2–5% per trade
⚠️ Stick to the plan — no chasing trades.
Discipline = Consistency 💹
TuffyCalls Team

FXSUSDT 1W AnalysisFXS ~ 1W Analysis
#FXS Buy after successfully breaking through this resistance line if you still have confidence in this coin with a short-term target of at least 20%++
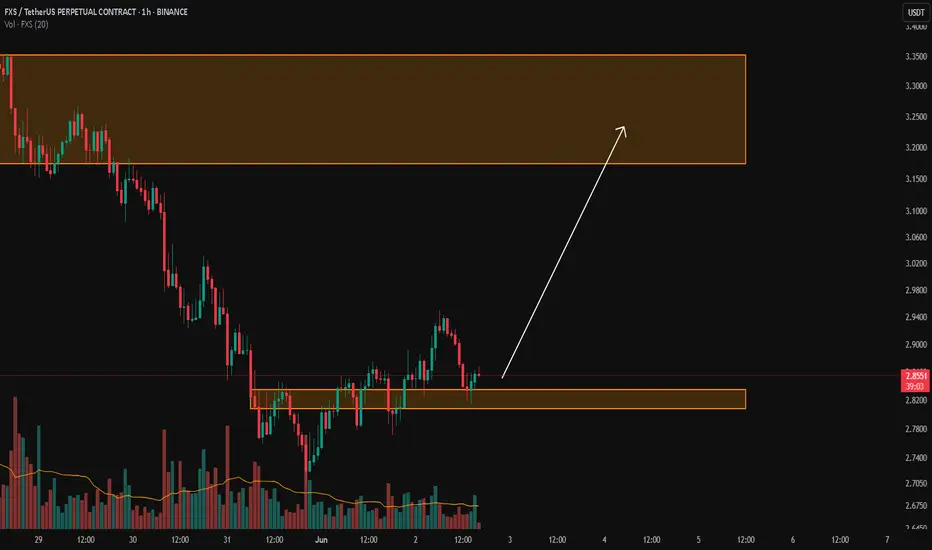
FXS/USDTKey Level Zone: 2.8080 - 2.8350
HMT v8.1 detected. The setup looks promising, supported by a previous upward/downward trend with increasing volume and momentum, presenting an excellent reward-to-risk opportunity.
HMT (High Momentum Trending):
HMT is based on trend, momentum, volume, and market str
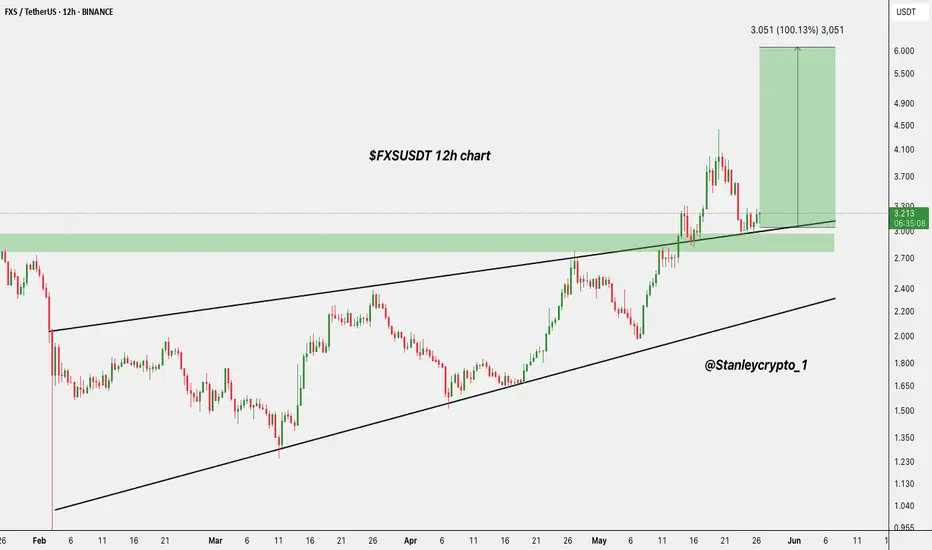
$FXS Setup Heating Up CRYPTOCAP:FXS Setup Heating Up 🔥
CRYPTO:FXSUSD is holding strong above the breakout zone near $3 after a clean retest.
As long as it stays above this support, the setup looks bullish with a potential 100% move toward $6.20.
Momentum is building, one to keep an eye on!
DYRO, NFA
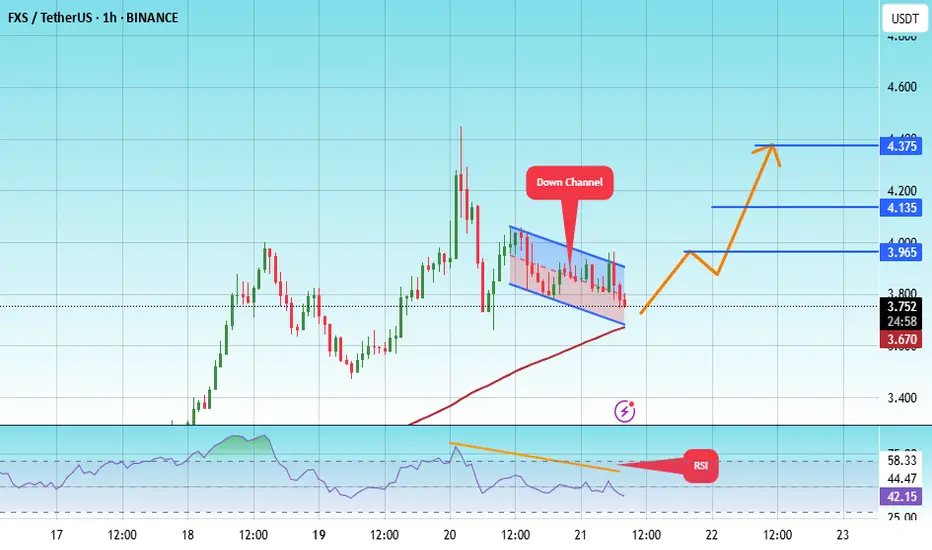
#FXS/USDT#FXS
The price is moving within a descending channel on the 1-hour frame, adhering well to it, and is heading for a strong breakout and retest.
We are experiencing a rebound from the lower boundary of the descending channel, which is support at 3.70.
We are experiencing a downtrend on the RSI ind
FXSUSDT 1D#FXS is on the verge of breaking out above the neckline of the rounding bottom pattern and the descending resistance on the daily timeframe. In case of a breakout, the targets are:
🎯 $4.098
🎯 $4.934
🎯 $6.073
🎯 $7.212
⚠️ Use a tight stop-loss.

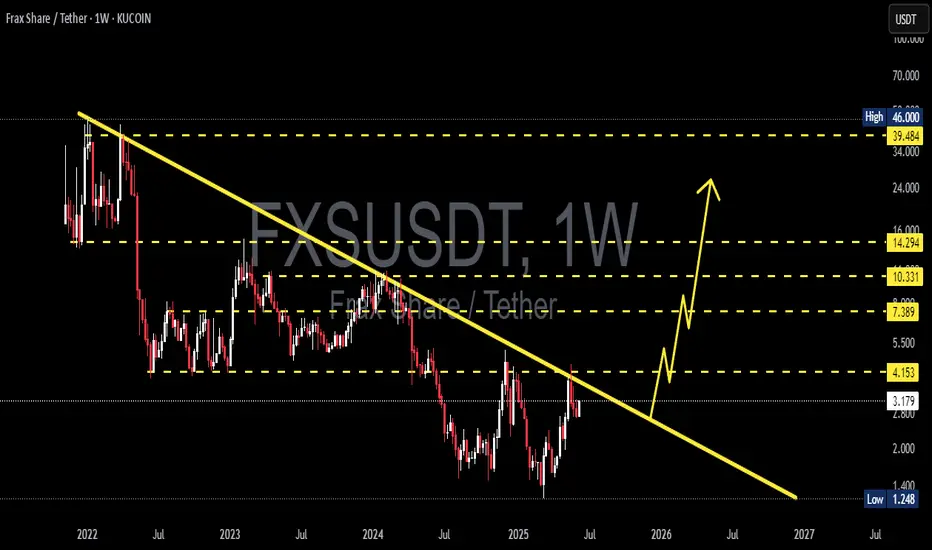
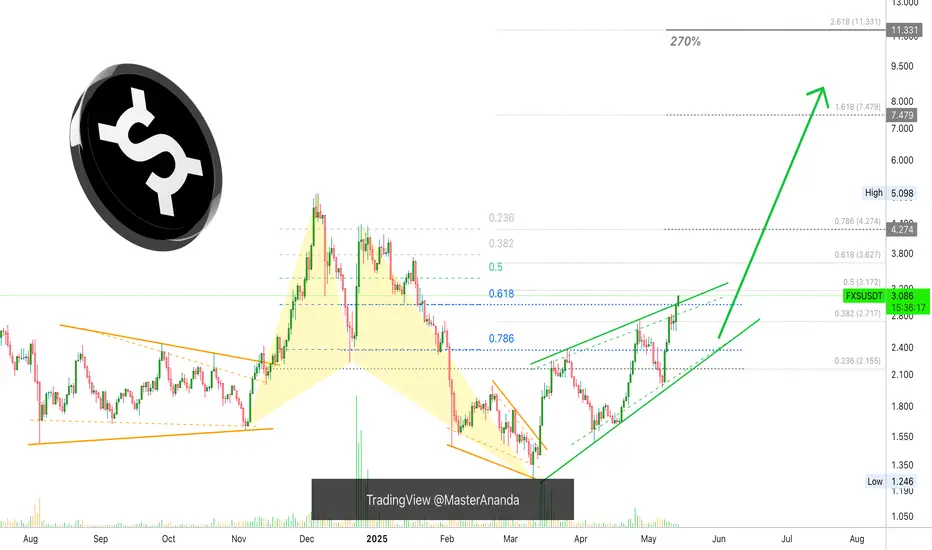
Frax Share On The Way Up (PP: 270%)The low here happened 11-March rather than 7-April, 7-April was a higher low. The action is strongly bullish and the rising channel has been broken, the upper boundary. From this we can deduct that the next higher high will be a really strong one.
Frax Share is on the way up.
The $11.33 target wit
Can #FXS Bulls Make a Comeback? Key Levels to Watch Yello Paradisers! Is #FXS gearing up for a massive breakout? Or will the bears take full control? Here’s what’s happening right now with #FraxShare (FXSUSDT) and why this next move could be crucial:
💎#FXSUSDT has been stuck in a descending triangle pattern, consistently rejecting off its downward r

#FXSUSDT There is a possibility of forming a triangle. It is necessary to observe the loss limit of 1.5 dollars

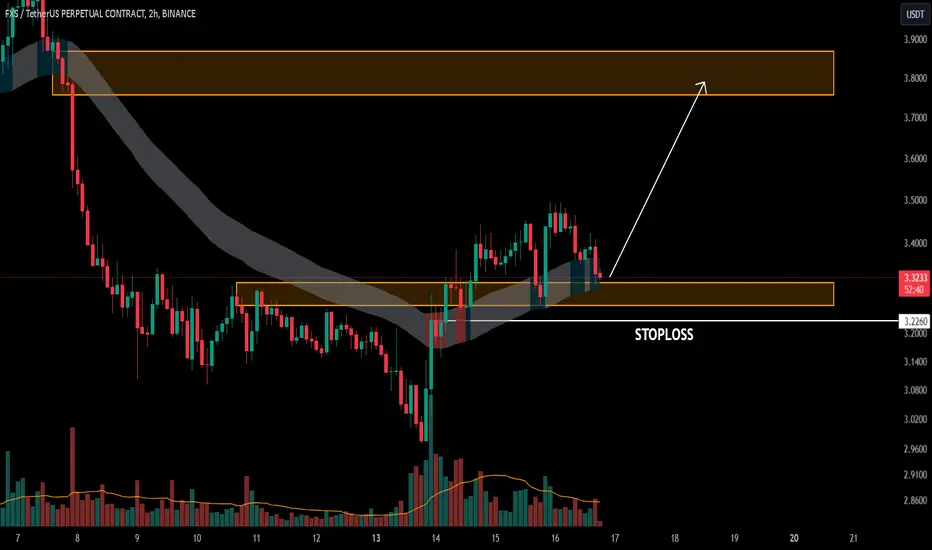
FXS/USDTKey Level Zone: 3.2600 - 3.3100
Stoploss Level: 3.2260
HMT v4.1 detected. The setup looks promising, supported by a previous upward/downward trend with increasing volume and momentum, presenting an excellent reward-to-risk opportunity.
HMT (High Momentum Trending):
HMT is based on trend, momentum,
See all ideas
Summarizing what the indicators are suggesting.
Oscillators
Neutral
SellBuy
Strong sellStrong buy
Strong sellSellNeutralBuyStrong buy
Oscillators
Neutral
SellBuy
Strong sellStrong buy
Strong sellSellNeutralBuyStrong buy
Summary
Neutral
SellBuy
Strong sellStrong buy
Strong sellSellNeutralBuyStrong buy
Summary
Neutral
SellBuy
Strong sellStrong buy
Strong sellSellNeutralBuyStrong buy
Summary
Neutral
SellBuy
Strong sellStrong buy
Strong sellSellNeutralBuyStrong buy
Moving Averages
Neutral
SellBuy
Strong sellStrong buy
Strong sellSellNeutralBuyStrong buy
Moving Averages
Neutral
SellBuy
Strong sellStrong buy
Strong sellSellNeutralBuyStrong buy
Displays a symbol's price movements over previous years to identify recurring trends.