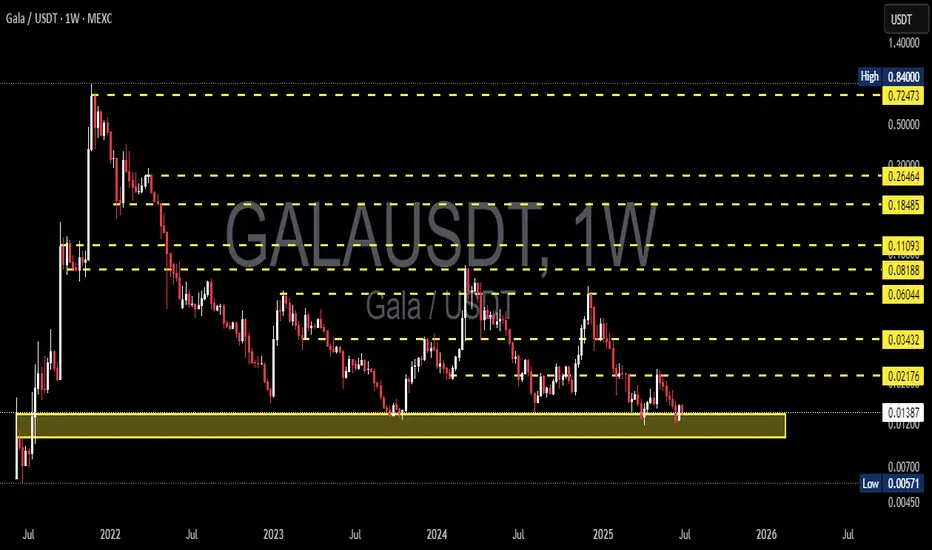
GALA/USDT | Testing Critical Historical Support – Rebound?🧠 Full & Professional Analysis:
GALA/USDT is currently sitting at a critical inflection point on the weekly timeframe. The price has returned to a major historical demand zone between $0.01200 – $0.01400, which has served as a strong support base for over a year.
This level has repeatedly acted as
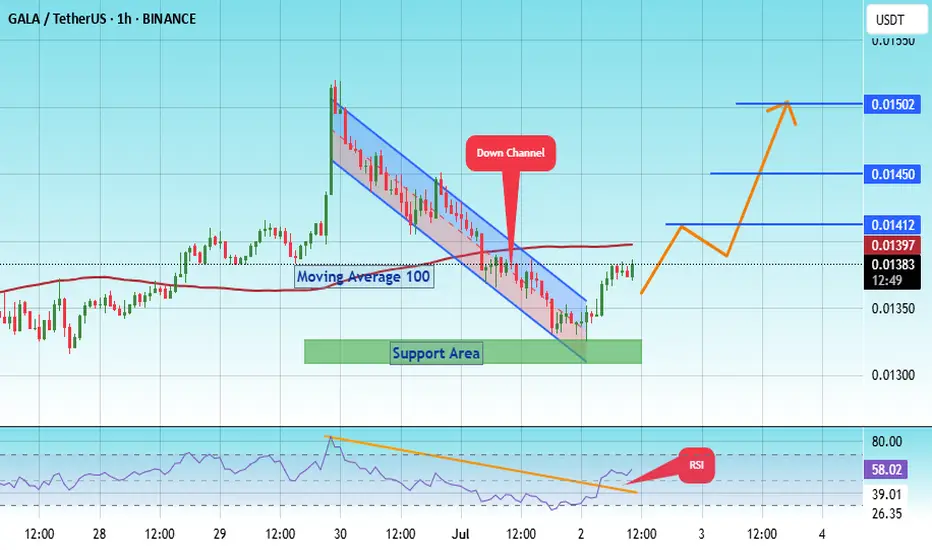
#GALA/USDT Gala bull run possible ?
#GALA
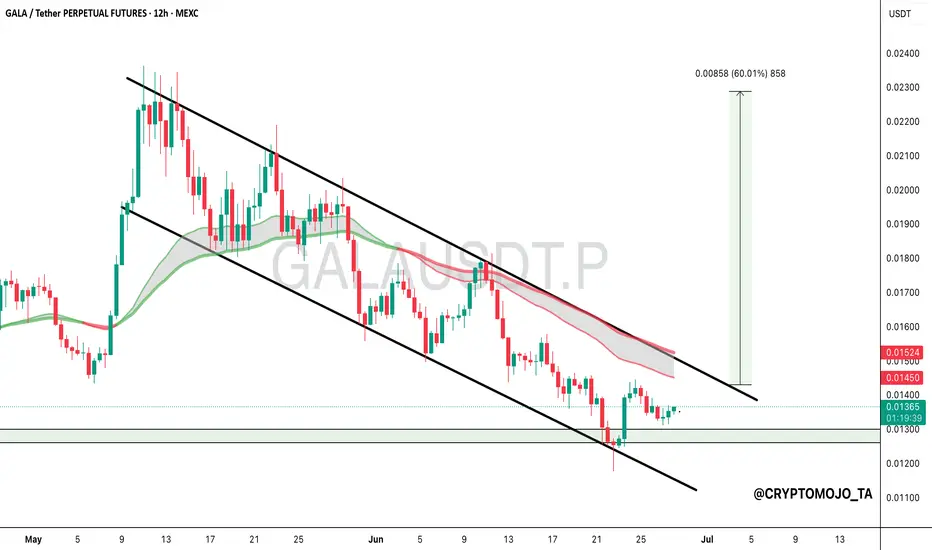
The price is moving within a descending channel on the 1-hour frame, adhering well to it, and is on its way to breaking it strongly upwards and retesting it.
We have a bounce from the lower boundary of the descending channel, this support at 0.0600.
We have a downtrend on the RSI indicator
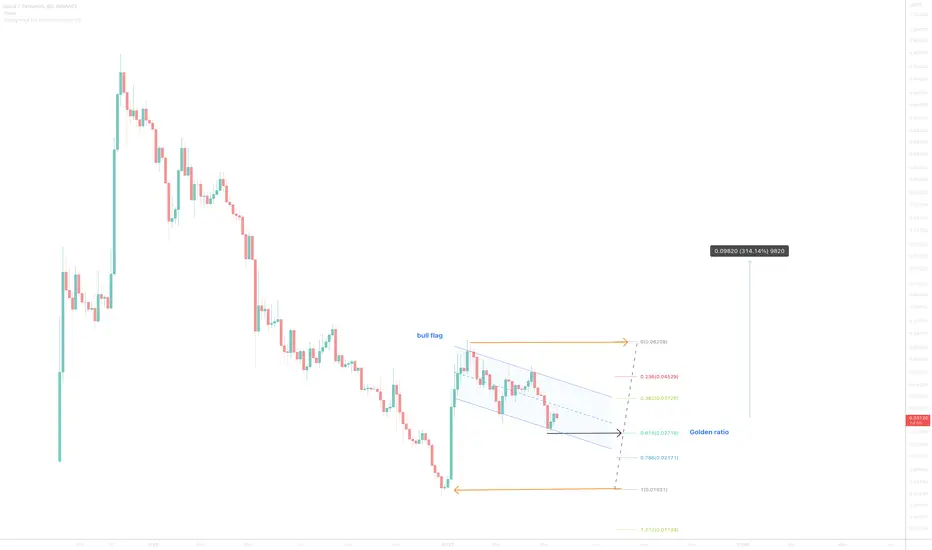
Gala (GALA)On the above 4-day chart price action has recently corrected 50% since a sell signal in late January (ask below if you wish to see). A number of reasons now exist to be long..
1) You know why.
2) Price action finds support on the golden ratio.
3) There is a positive divergence between RSI and pr
#GALA/USDT#GALA
The price is moving within a descending channel on the 1-hour frame, adhering well to it, and is poised to break it strongly upwards and retest it.
We have a bounce from the lower boundary of the descending channel. This support is at 0.01340.
We have a downtrend on the RSI indicator that is
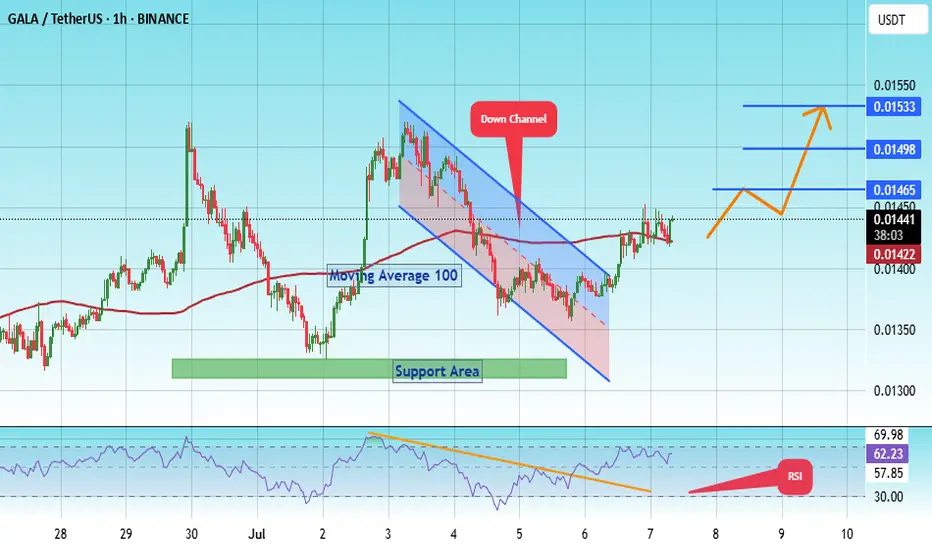
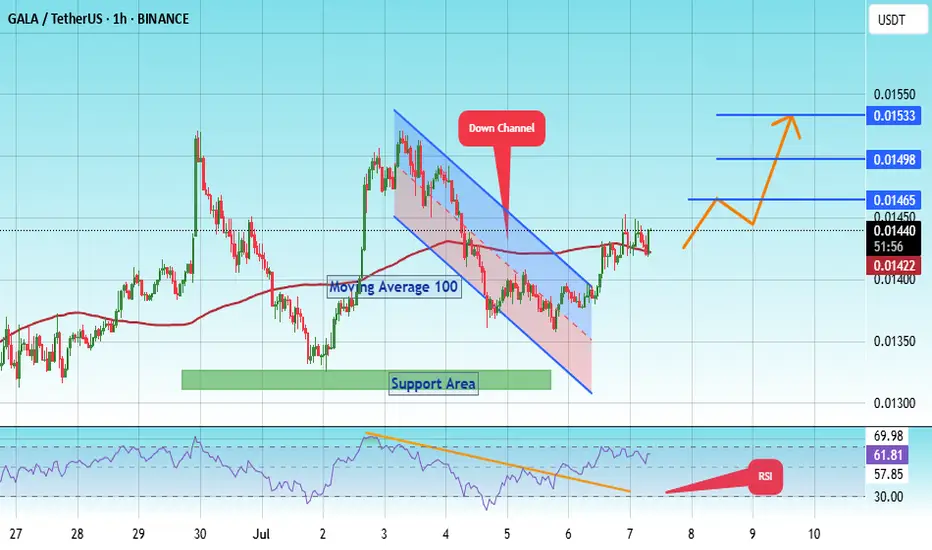
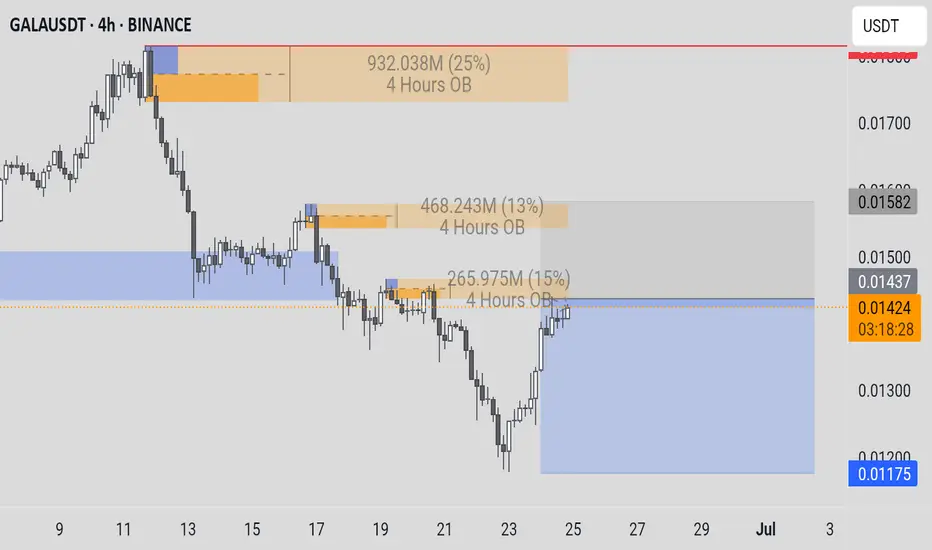
GALA GOING TO MOON ''AS per my analysis gala meet the daily advanced order block at 0.01710 and mitigation block at same level and there is also a bullish order block FVG of daily time frame At 0.01780 to 0.01540 these all are IMPORTANT POI and its help to reverse the trend and other side if we talk about

GALA BULLISH IDEAIf the previous wave is a then this wave is near to be corrective one as it is illustrated.
so we may see c wave or three.

$GALA at Crucial Support, Bounce Coming?INDEX:GALA is still inside the falling channel but showing signs of support around $0.013.
This zone has held well in the past, and if it holds again, we could see a bounce toward $0.02+ (60% potential upside).
No breakout yet, but momentum is worth watching.
Retweet if you're bullish!
#GALA #Alt
GALAUSDTCryptocurrency Futures Market Disclaimer
Trading cryptocurrency futures involves high risks and is not suitable for all investors. Cryptocurrency prices are highly volatile, which can lead to significant gains or losses in a short period. Before engaging in crypto futures trading, consider your risk
GALAUSDT Cryptocurrency Futures Market Disclaimer 🚨🚨🚨
Trading cryptocurrency futures involves high risks and is not suitable for all investors.
Cryptocurrency prices are highly volatile, which can lead to significant gains or losses in a short period.
Before engaging in crypto futures trading, consider you
See all ideas
Summarizing what the indicators are suggesting.
Oscillators
Neutral
SellBuy
Strong sellStrong buy
Strong sellSellNeutralBuyStrong buy
Oscillators
Neutral
SellBuy
Strong sellStrong buy
Strong sellSellNeutralBuyStrong buy
Summary
Neutral
SellBuy
Strong sellStrong buy
Strong sellSellNeutralBuyStrong buy
Summary
Neutral
SellBuy
Strong sellStrong buy
Strong sellSellNeutralBuyStrong buy
Summary
Neutral
SellBuy
Strong sellStrong buy
Strong sellSellNeutralBuyStrong buy
Moving Averages
Neutral
SellBuy
Strong sellStrong buy
Strong sellSellNeutralBuyStrong buy
Moving Averages
Neutral
SellBuy
Strong sellStrong buy
Strong sellSellNeutralBuyStrong buy
Displays a symbol's price movements over previous years to identify recurring trends.
Curated watchlists where GALAUSDT.P is featured.
Metaverse tokens: VR crypto for a VR world
21 No. of Symbols
See all sparks