Gala Games · Let's Talk All-Time High & Potential TargetsThe truth is that a new all-time high is just us being optimistic. The truth is that there is not enough data for us to make such a prediction. The altcoins market is turning out to be super strong, Bitcoin is doing great and we expect amazing growth, but I cannot say that a new all-time high is a certainty on this chart, there is simply not enough data. I can't rule it out either, so that's the situation in which we find ourselves.
The next question: Can we make an educated guess based on the data that's available?
Yes! Absolutely.
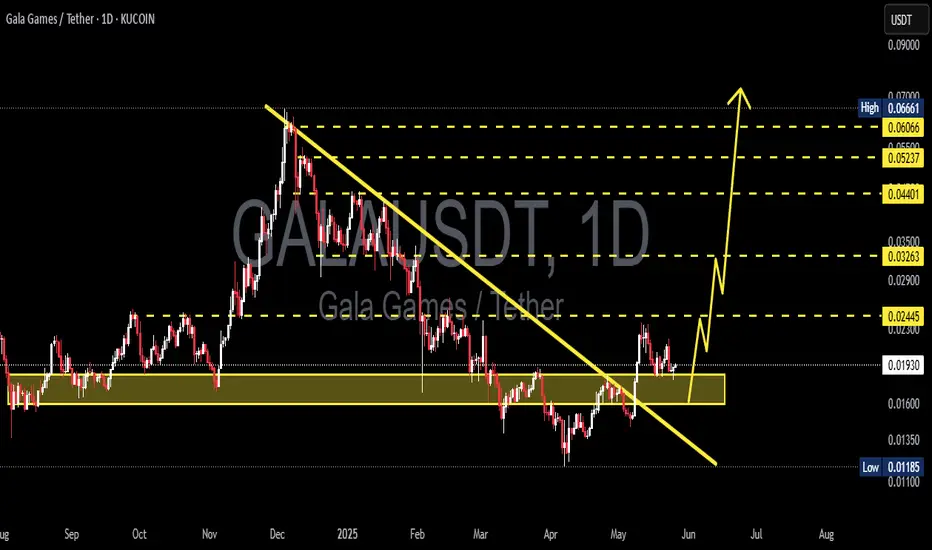
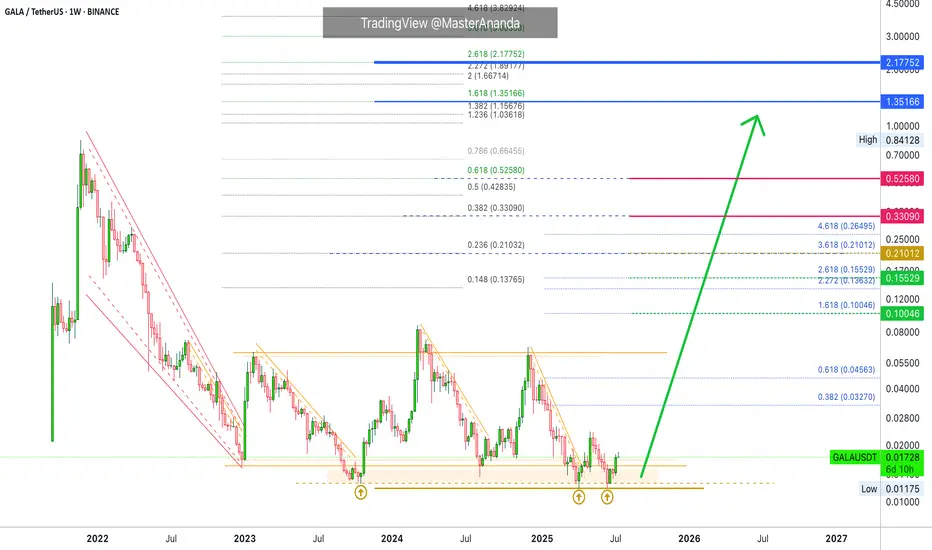
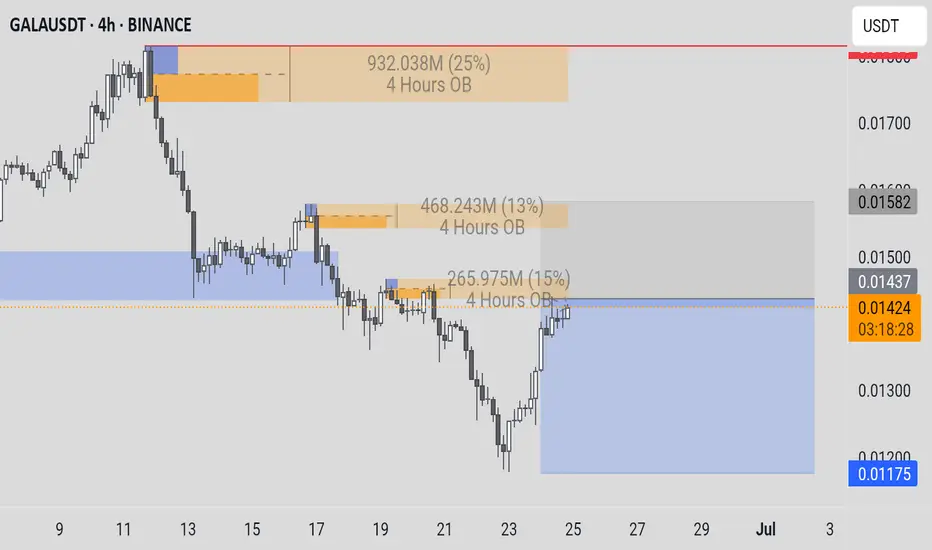
» Standard projections based on mid-range price action opens up high probability targets around 0.10, 0.15 and 0.21.
» Long-term projections based on the previous cycle (2021-2022) gives us a minimum target of 0.33 and 0.52.
» A great bull market opens up 1.35 and 2.17. But even these numbers can be tricky because we are putting limitations on something that has no limits.
The way we extract these numbers is based on past action, the way the market works is based on present day events and what the future holds. Present day and the future are much different to the conditions we had just a few years ago. Just a few months ago (last year) the market was in such a different situation. A certain group of people whom I won't mention were trying to shutdown the market through capricious lawsuits and abuse of power, today, the market is fully encouraged to grow. This type of development is what can make the difference between a standard high and a major new all-time high. I would aim high just to be on the safe side.
The top will not be over in an hour or days. It can take weeks, sometimes even months. There is also the double-top possibility or in the least, the dead-cat bounce, lower high after the final peak. That is, there will be plenty of time to sell. We just need to become very alert, wise and active when the action is happening around major resistance zones.
We can tell if the top is in by tracking the rest of the market. I will be here sharing charts.
The market will decide, we can only speculate. With that said, we know we are going way beyond the standard and the minimum, the Cryptocurrency market is already doing great. Expect maximum growth; hope for the best, prepare for the best.
Namaste.
GALAUSDT trade ideas
#GALA/USDT Gala bull run possible ?#GALA
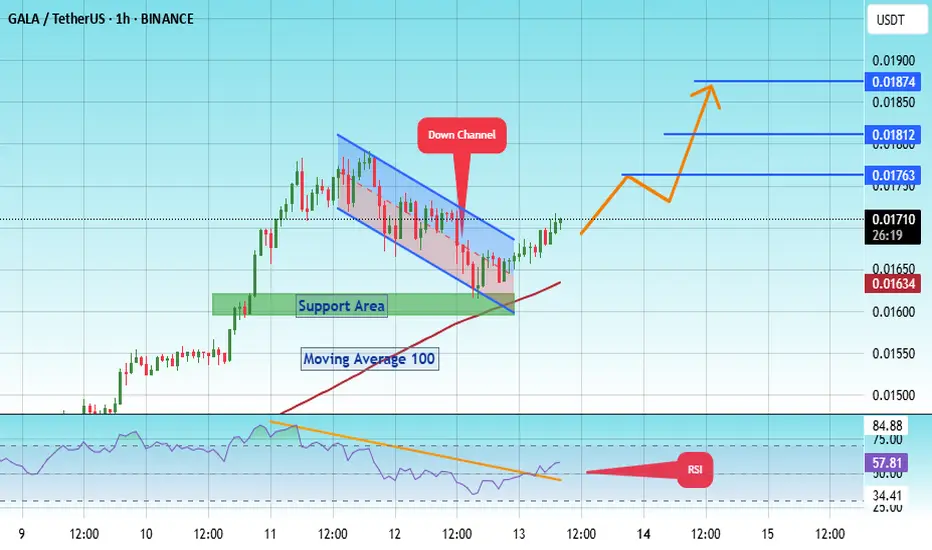
The price is moving within a descending channel on the 1-hour frame, adhering well to it, and is poised to break it strongly upwards and retest it.
We have a bounce from the lower boundary of the descending channel. This support is at 0.01630.
We have a downtrend on the RSI indicator that is about to break and retest, supporting the upside.
There is a key support area (in green) at 0.01590, which represents a strong basis for the upside.
Don't forget one simple thing: ease and capital.
When you reach the first target, save some money and then change your stop-loss order to an entry order.
For inquiries, please leave a comment.
We have a trend of stability above the Moving Average 100.
Entry price: 0.01711
First target: 0.01763
Second target: 0.01812
Third target: 0.01874
Don't forget one simple thing: ease and capital.
When you reach the first target, save some money and then change your stop-loss order to an entry order.
For inquiries, please leave a comment.
Thank you.
GALA wait for entryGala Games made history as the first blockchain gaming company to partner with the U.S. White House , hosting an interactive Easter Egg Hunt during the 2025 Easter Egg Roll—an event that drew over 300,000 plays and significantly boosted user engagement.
Beyond this milestone, Gala has secured high-profile partnerships with DreamWorks Animation, NBCUniversal, Snoop Dogg, LG Electronics, and Polygon . These alliances are strengthening Gala’s mainstream presence and enhancing its infrastructure credibility.
Technical Outlook:
GALA has broken above a key daily trendline, signaling potential bullish momentum. A retest of the trendline could offer a high-probability entry. The detailed trade setup is outlined in the accompanying chart.
Disclaimer:
This analysis is based on my personnal views and is not a financial advice. Risk is under your control.
#GALA/USDT#GALA
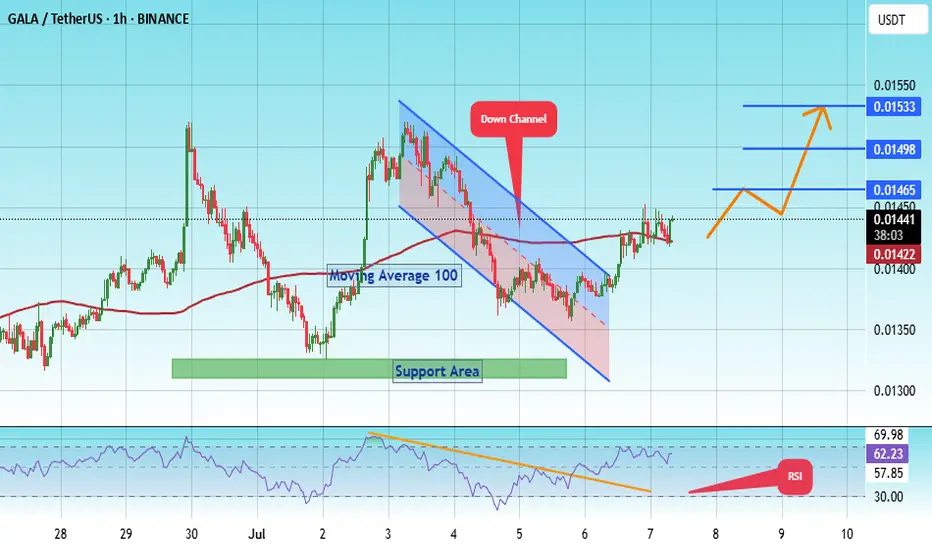
The price is moving within a descending channel on the 1-hour frame, adhering well to it, and is poised to break it strongly upwards and retest it.
We have a bounce from the lower boundary of the descending channel. This support is at 0.01340.
We have a downtrend on the RSI indicator that is about to break and retest, supporting the upward trend.
There is a key support area in green at 0.01320, which represents a strong basis for the upward trend.
Don't forget one simple thing: ease and capital.
When you reach the first target, save some money and then change your stop-loss order to an entry order.
For inquiries, please leave a comment.
We have a trend of stability above the Moving Average 100.
Entry price: 0.01430
First target: 0.01465
Second target: 0.01500
Third target: 0.01533
Don't forget one simple thing: ease and capital.
When you reach the first target, save some money and then change your stop-loss order to an entry order.
For inquiries, please leave a comment.
Thank you.
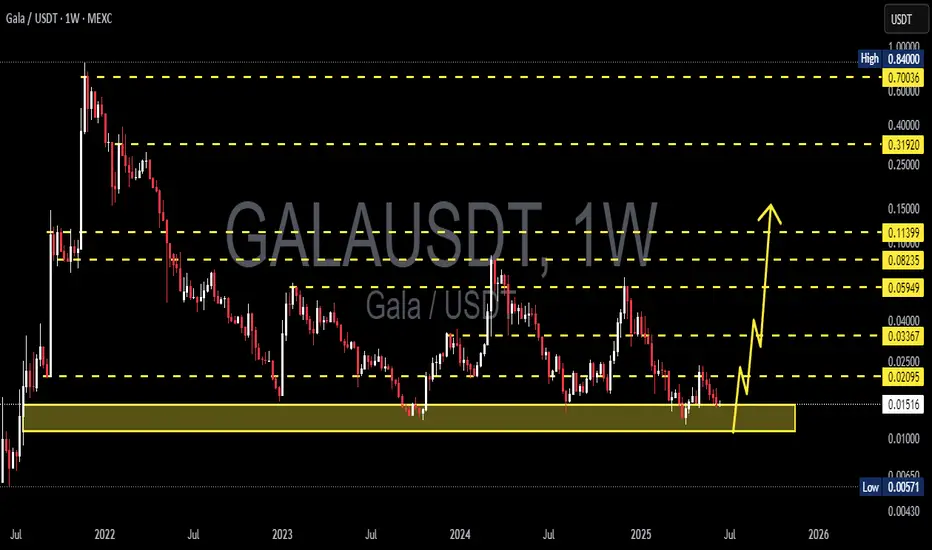
GALA/USDT | Testing Critical Historical Support – Rebound?🧠 Full & Professional Analysis:
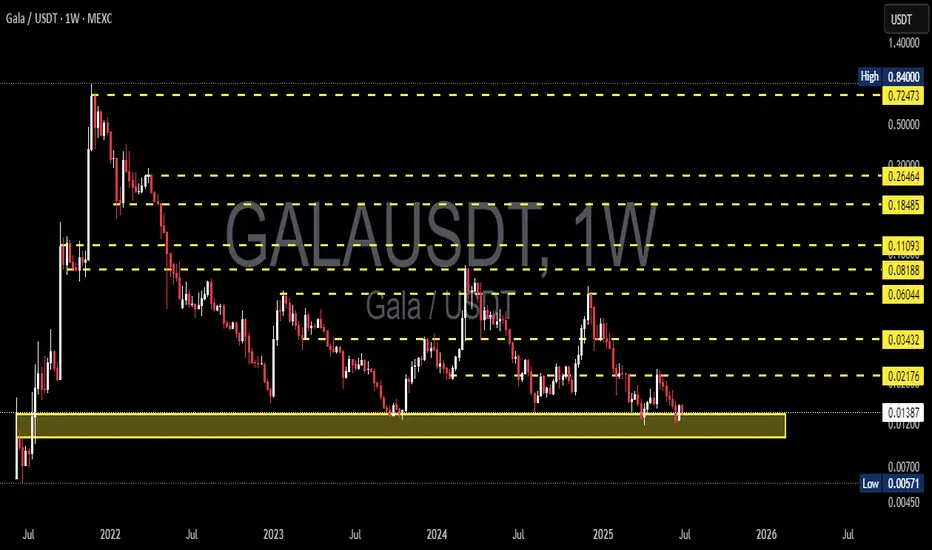
GALA/USDT is currently sitting at a critical inflection point on the weekly timeframe. The price has returned to a major historical demand zone between $0.01200 – $0.01400, which has served as a strong support base for over a year.
This level has repeatedly acted as a launchpad for rallies since early 2023, making it a high-interest area for long-term investors and swing traders.
🔍 Key Technical Structure & Zones:
🟨 Major Weekly Support Zone:
$0.01200 – $0.01400 → A historically proven demand zone that has held multiple times. A stronghold for buyers, and a potential accumulation base.
🟦 Layered Resistance Zones (If Rebound Occurs):
$0.02176 → First minor resistance; initial confirmation of a bullish reversal.
$0.03432 → Mid-range resistance within current consolidation.
$0.06044 → Key breakout level to shift trend structure.
$0.11093 – $0.18485 → Medium-term targets if bullish momentum builds.
$0.26464 to $0.72473 → Historical distribution zones if full recovery unfolds.
🟥 Bearish Risk Zone (Breakdown Scenario):
Break below $0.01200 opens downside risk toward the all-time low at $0.00571, or even lower if sentiment worsens.
✅ Bullish Scenario:
If the $0.01200–$0.01400 support holds:
1. A bullish engulfing candle on the weekly chart could be an early reversal signal.
2. Potential formation of a double bottom in this demand zone (yet to be confirmed).
3. Initial target at $0.02176, with possible extension toward $0.06044—a major pivot zone.
4. Sustained buying and volume confirmation could push GALA toward $0.110 – $0.184 in the mid-term.
❌ Bearish Scenario:
If the price fails to hold above $0.01200:
1. A breakdown may trigger a capitulation move to the $0.00700 – $0.00571 range (historical lows).
2. This would invalidate the current sideways base structure and extend the downtrend.
3. Lack of buying interest could open the door to deeper losses.
📐 Pattern & Technical Context:
Accumulation Base Formation: Still possible if support holds and buyers step in.
Tight Range Compression: Price is coiling at the bottom, indicating a potential breakout move soon.
No major reversal patterns confirmed yet, such as Inverse H&S or W-bottom, but structure suggests accumulation pressure.
🧭 Summary:
> GALA is dancing on the edge of a crucial support level. The price action in this zone will likely determine the next major direction. A bounce could ignite a multi-week rally, while a breakdown may send the asset to new lows. Volume and weekly close will be key confirmation points.
📊 Recommendations:
Swing Traders: Watch for bullish candle patterns and breakout above $0.02176.
Long-Term Investors: Consider conservative accumulation in the support zone with clear risk management.
Bearish Traders: Wait for confirmed weekly close below $0.012 before considering short setups.
#GALA #GALAUSDT #CryptoTA #AltcoinAnalysis #WeeklyChart #BullishSetup #BearishScenario #TechnicalAnalysis #AccumulationZone #BreakoutWatch
#GALA/USDT#GALA
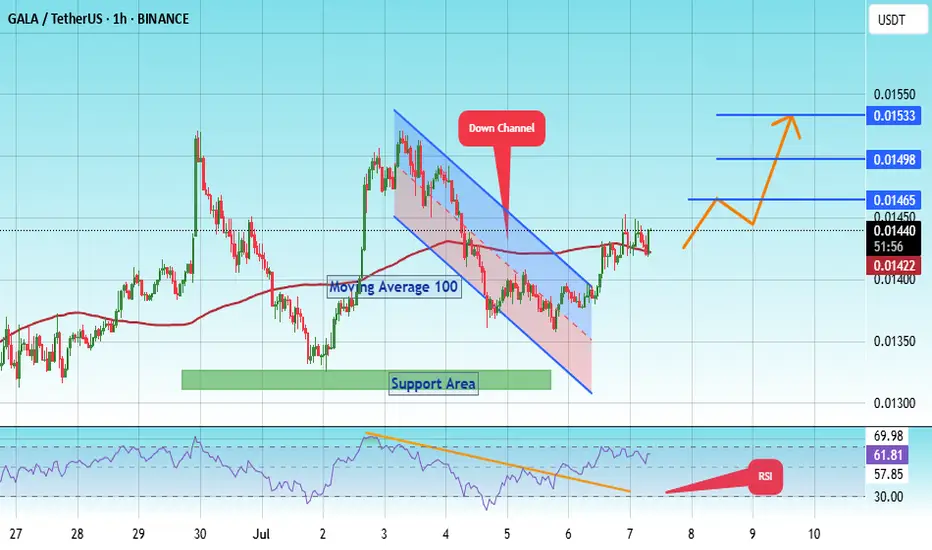
The price is moving within a descending channel on the 1-hour frame, adhering well to it, and is poised to break it strongly upwards and retest it.
We have a bounce from the lower boundary of the descending channel. This support is at 0.01340.
We have a downtrend on the RSI indicator that is about to break and retest, supporting the upward trend.
There is a key support area in green at 0.01320, which represents a strong basis for the upward trend.
Don't forget one simple thing: ease and capital.
When you reach the first target, save some money and then change your stop-loss order to an entry order.
For inquiries, please leave a comment.
We have a trend of stability above the Moving Average 100.
Entry price: 0.01430
First target: 0.01465
Second target: 0.01500
Third target: 0.01533
Don't forget one simple thing: ease and capital.
When you reach the first target, save some money and then change your stop-loss order to an entry order.
For inquiries, please leave a comment.
Thank you.
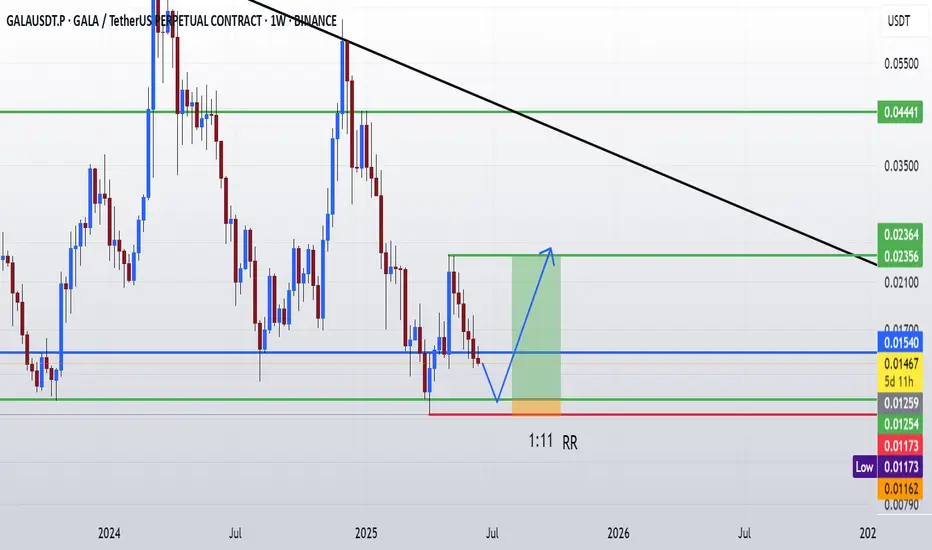
#GALAUSDT Analysis — Macro Reversal Forming at Historical Suppor📈 #GALAUSDT Analysis — Macro Reversal Forming at Historical Support
🗓 Published: May 10, 2025
🕰 Timeframe: 1W | 📊 Exchange: Binance
🔍 Technical Overview
GALA is back at its multi-year support zone around $0.0117–$0.015. This level previously triggered major cycle rallies and is again showing signs of a potential bottoming pattern.
📌 Macro Structure:
✅ Rejection from red supply zone → multiple cycles
✅ Falling wedge breakouts in previous recoveries
✅ Consistent reaction to blue base = high probability reversal support
🟦 Support (Reversal Base):
$0.0117–0.0155
🔵 Historical pivot zone and volume base
📛 Weekly close below = invalidates bullish thesis
🟢 Entry Zone: ~$0.0195 (live)
Structure suggests early positioning with a defined SL
🔻 Stop (Panic Level):
Below $0.0150 – breakdown from base
Risk = 21.65%
🎯 Target Zones (If Reversal Holds):
TP1: $0.0463 – local resistance (2024 pivot)
TP2: $0.0816 – macro range top
TP3: $0.063–$0.082 – post-breakout acceleration zone
📈 Potential R:R = 15.66 — extreme asymmetric profile
🧠 Strategy Insight
GALA is showing signs of accumulation at the cycle bottom, just as in past recoveries.
• Early long setups triggering
• DCA with stops below $0.015 = clean invalidation
• Pump trigger = weekly close above red zone
💡 This is a macro positioning play — not a short-term momentum trade.
🗣 What’s Next?
Watch for a breakout of mid-range and $0.046 reclaim. That unlocks the next stage targets.
If bulls hold this zone → major rotation is possible mid-Q2.
📢 Cycle bottoms don’t shout — they whisper. GALA is whispering again from the same zone it always did.
we ask Allah reconcile and repay

#GALA/USDT Gala bull run possible ?
#GALA
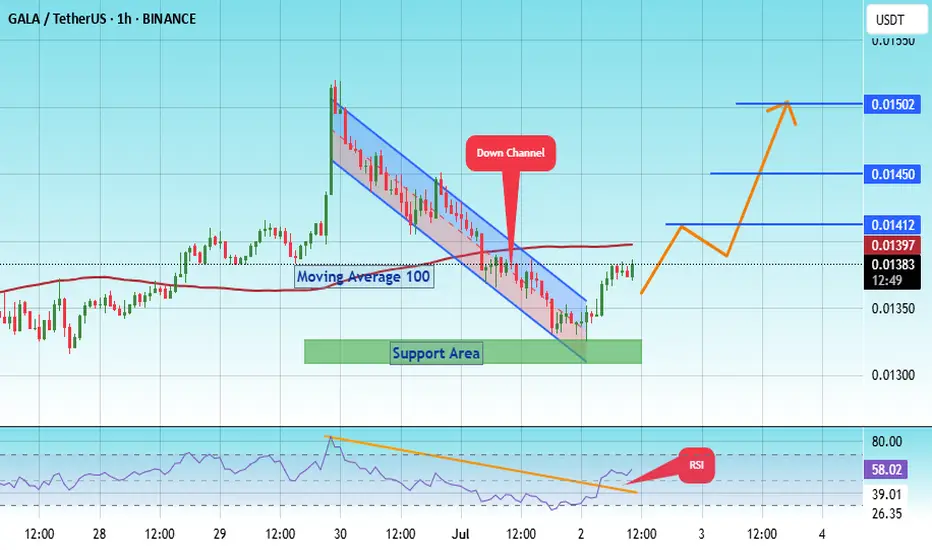
The price is moving within a descending channel on the 1-hour frame, adhering well to it, and is on its way to breaking it strongly upwards and retesting it.
We have a bounce from the lower boundary of the descending channel, this support at 0.0600.
We have a downtrend on the RSI indicator that is about to break and retest, supporting the upward move.
There is a key support area in green at 0.01312, which represents a strong basis for the upward move.
Don't forget one simple thing: ease and capital.
When you reach the first target, save some money and then change your stop-loss order to an entry order.
For inquiries, please leave a comment.
We have a trend of stability above the Moving Average 100.
Entry price: 0.01360
First target: 0.01412
Second target: 0.01450
Third target: 0.01500
Don't forget one simple thing: ease and capital.
When you reach the first target, save some money and then change your stop-loss order to an entry order.
For inquiries, please leave a comment.
Thank you.
GALAUSDT Cryptocurrency Futures Market Disclaimer 🚨🚨🚨
Trading cryptocurrency futures involves high risks and is not suitable for all investors.
Cryptocurrency prices are highly volatile, which can lead to significant gains or losses in a short period.
Before engaging in crypto futures trading, consider your risk tolerance, experience, and financial situation.
Risk of Loss: You may lose more than your initial capital due to the leveraged nature of futures. You are fully responsible for any losses incurred.
Market Volatility: Crypto prices can fluctuate significantly due to factors such as market sentiment, regulations, or unforeseen events.
Leverage Risk: The use of leverage can amplify profits but also increases the risk of total loss.
Regulatory Uncertainty: Regulations related to cryptocurrencies vary by jurisdiction and may change, affecting the value or legality of trading.
Technical Risks: Platform disruptions, hacking, or technical issues may result in losses.
This information is not financial, investment, or trading advice. Consult a professional financial advisor before making decisions. We are not liable for any losses or damages arising from cryptocurrency futures trading.
Note: Ensure compliance with local regulations regarding cryptocurrency trading in your region.
thanks for like and follow @ydnldn
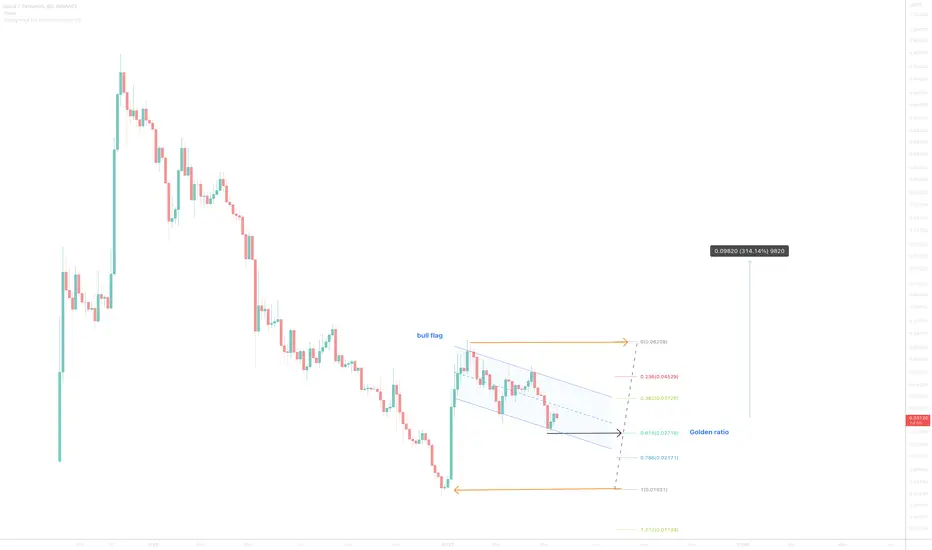
Gala (GALA)On the above 4-day chart price action has recently corrected 50% since a sell signal in late January (ask below if you wish to see). A number of reasons now exist to be long..
1) You know why.
2) Price action finds support on the golden ratio.
3) There is a positive divergence between RSI and price action.
4) The bull flag channel, naturally a bullish pattern on confirmation of a breakout to the upper side of the channel.
5) A breakout confirmation will result in a 300% gain from current levels.
Is it possible for price action to fall further? Sure.
Is it probable? No.
Ww
Type: Trade
Risk: <= 6%
Timeframe to open: Now
Return: 300%
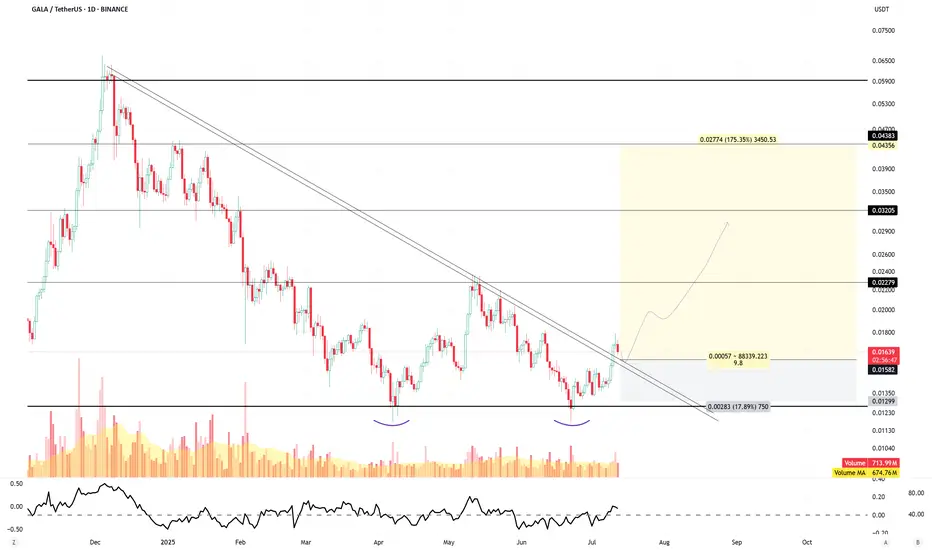
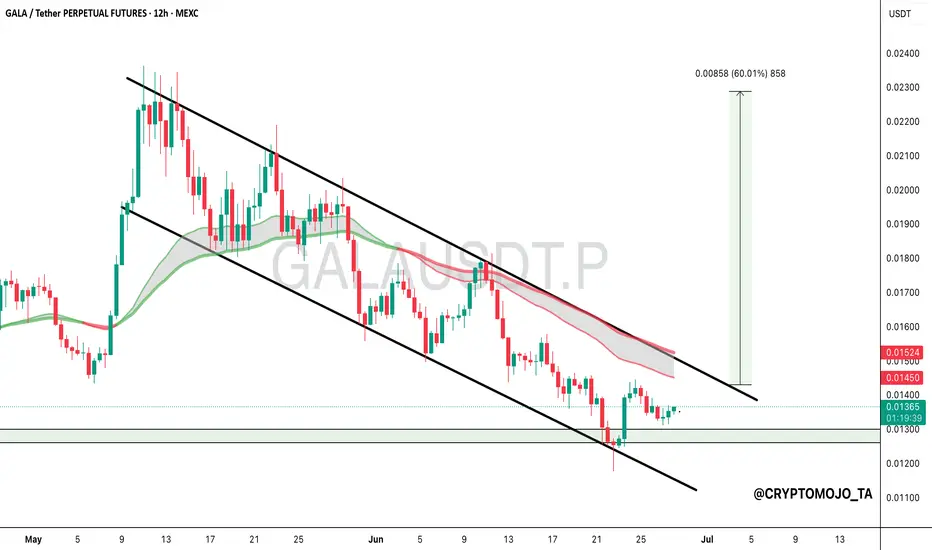
$GALA at Crucial Support, Bounce Coming?INDEX:GALA is still inside the falling channel but showing signs of support around $0.013.
This zone has held well in the past, and if it holds again, we could see a bounce toward $0.02+ (60% potential upside).
No breakout yet, but momentum is worth watching.
Retweet if you're bullish!
#GALA #Altseason
GALA GOING TO MOON ''AS per my analysis gala meet the daily advanced order block at 0.01710 and mitigation block at same level and there is also a bullish order block FVG of daily time frame At 0.01780 to 0.01540 these all are IMPORTANT POI and its help to reverse the trend and other side if we talk about the target we can see recent swing high 0.02040 0.02194 and 0.02363 these level contain high liquidity and price must go to grab the liquidity and there is 1D bearish order block at 0.03294 we see the price soon at this level "
BAIS:- BULLISH
ENTRY:- 0.01710
STOPLOSS:- 0.01410
TARGET :- 0.03290
DISCLAIMER :- its not a Financial Advice
THANK YOU ;

GALA BULLISH IDEAIf the previous wave is a then this wave is near to be corrective one as it is illustrated.
so we may see c wave or three.

GALAUSDTCryptocurrency Futures Market Disclaimer
Trading cryptocurrency futures involves high risks and is not suitable for all investors. Cryptocurrency prices are highly volatile, which can lead to significant gains or losses in a short period. Before engaging in crypto futures trading, consider your risk tolerance, experience, and financial situation.
Risk of Loss: You may lose more than your initial capital due to the leveraged nature of futures. You are fully responsible for any losses incurred.
Market Volatility: Crypto prices can fluctuate significantly due to factors such as market sentiment, regulations, or unforeseen events.
Leverage Risk: The use of leverage can amplify profits but also increases the risk of total loss.
Regulatory Uncertainty: Regulations related to cryptocurrencies vary by jurisdiction and may change, affecting the value or legality of trading.
Technical Risks: Platform disruptions, hacking, or technical issues may result in losses.
This information is not financial, investment, or trading advice. Consult a professional financial advisor before making decisions. We are not liable for any losses or damages arising from cryptocurrency futures trading.
Note: Ensure compliance with local regulations regarding cryptocurrency trading in your region.
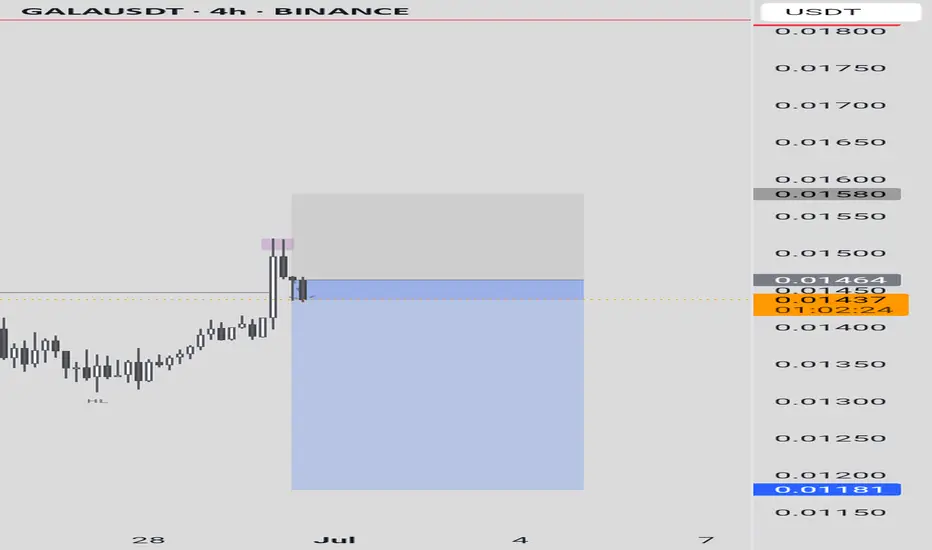
GALA/USDT - 4HR TIME FRAME - BULLISH!!This chart illustrates a bullish reversal setup using Elliott Wave Theory, Fibonacci retracement levels, and RSI divergence. Here's a detailed breakdown:
📉 Elliott Wave Count:
The chart shows a complete 5-wave impulse down labeled (1) to (5), suggesting a potential end of a bearish trend.
Wave (5) appears to have just completed, indicating a possible reversal point.
🔍 Falling Wedge Pattern:
A falling wedge is visible between waves (4) and (5), which is typically a bullish reversal pattern.
Price is near the wedge’s apex, hinting at an imminent breakout.
🟡 Strong Demand Zone:
Price is currently inside a yellow demand zone (roughly $0.0136 to $0.0144).
This zone coincides with the 0.786 Fibonacci retracement level at $0.01363, a common reversal level.
📊 RSI Indicator:
The RSI at the bottom shows a bullish divergence:
Price made a lower low, while RSI made a higher low.
This signals weakening bearish momentum and potential upside ahead.
🧠 Summary:
This is a technically sound bullish setup, suggesting a bottoming structure and an upcoming uptrend. The confluence of Elliott Wave completion, wedge breakout, RSI divergence, and Fibonacci support all point to a strong reversal probability.

GALAUSDT 1W AnalysisGALA ~ 1W Analysis
#GALA Buy at support block if you still have confidence in this coin with a short term target of at least 20%+ from here.
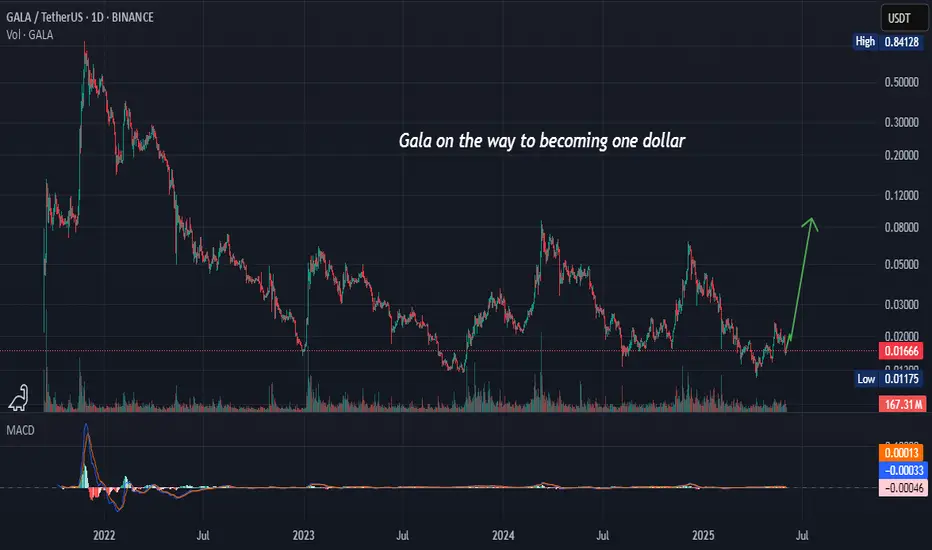
GALA. USDTGala is an American cryptocurrency that you should not exit with a profit of 10 or 20%.
If you are thinking about 200% profit in the medium term and 400% profit in the long term, Gala is the best option.
The history of Gala shows this.
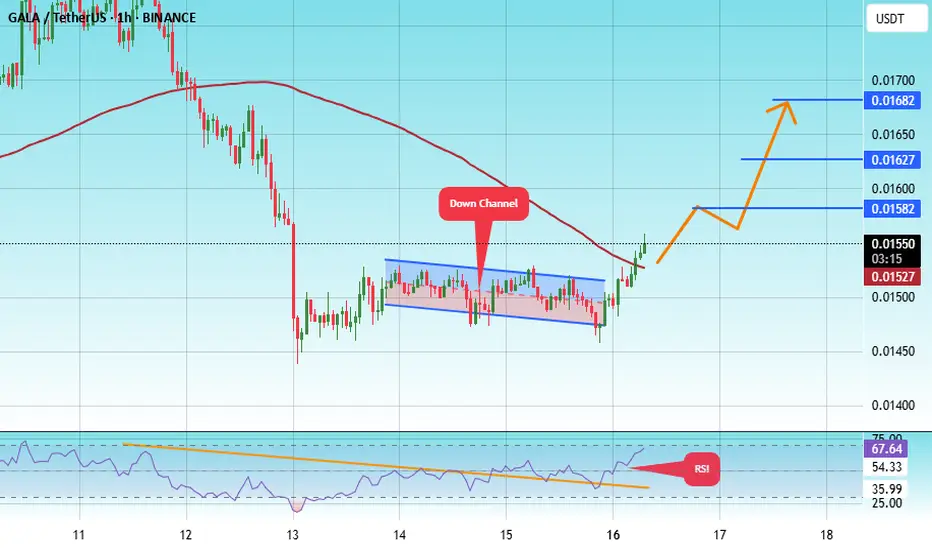
#GALA/USDT#GALA
The price is moving within a descending channel on the 1-hour frame, adhering well to it, and is heading towards a strong breakout and retest.
We are experiencing a rebound from the lower boundary of the descending channel. This support is at 0.01477.
We are experiencing a downtrend on the RSI indicator, which is about to break and retest, supporting the upward trend.
We are heading towards stability above the 100 Moving Average.
Entry price: 0.01550
First target: 0.01582
Second target: 0.01627
Third target: 0.01682
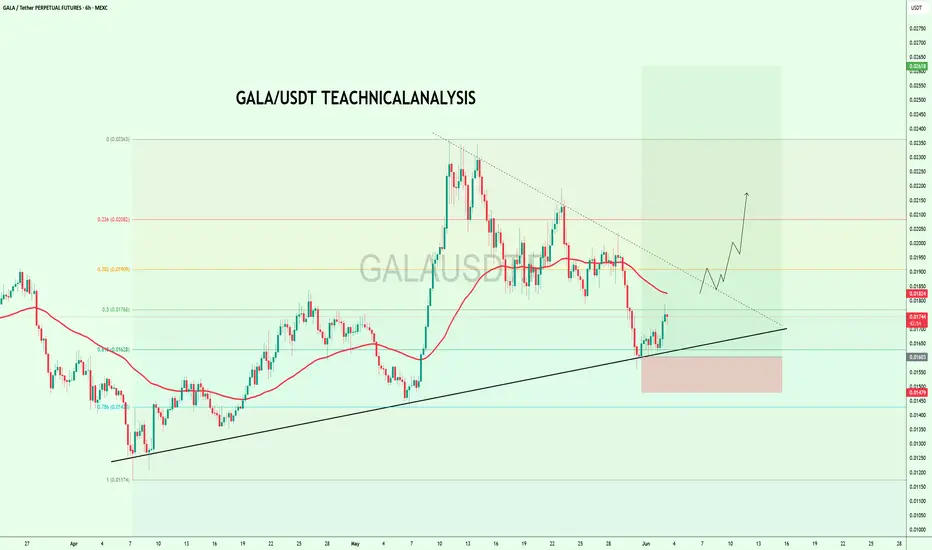
$GALA Holding Support – Breakout Coming?INDEX:GALA is holding strong above the trendline support and showing signs of a bounce.
The price is now approaching a key descending trendline a breakout here could lead to a solid move toward $0.021–$0.026 📈
As long as it stays above the trendline, bulls are in control.
#GALA #ALTSEASON
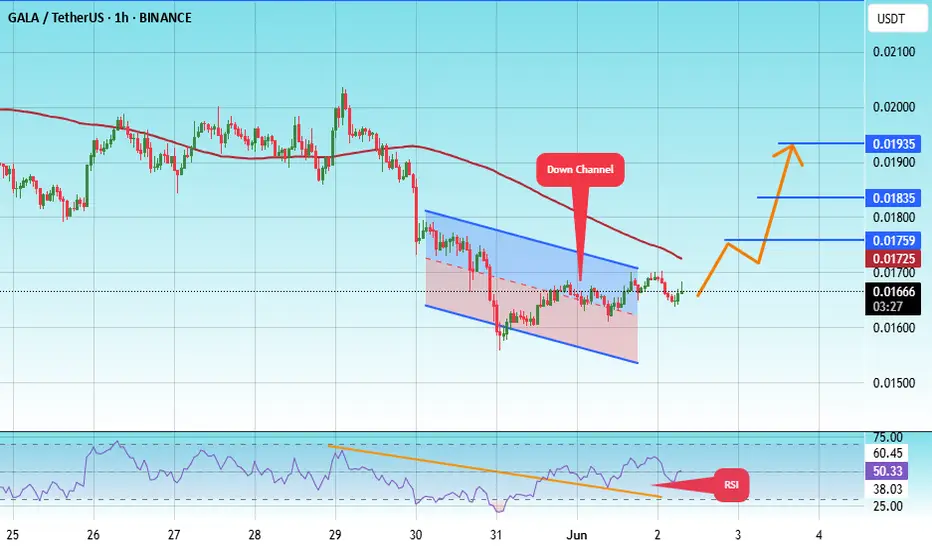
#GALA/USDT#GALA
The price is moving within a descending channel on the 1-hour frame, adhering well to it, and is on its way to breaking it strongly upwards and retesting it.
We are seeing a bounce from the lower boundary of the descending channel, this support at 0.01560.
We have a downtrend on the RSI indicator that is about to break and retest, supporting the upward trend.
We are looking for stability above the 100 moving average.
Entry price: 0.01666
First target: 0.01760
Second target: 0.01835
Third target: 0.01935
gala short tradegala is on 4hr bearish orderblock and no w going to retrace the HTF (POI) daily advanced order block at 0.01735
trade short
entry 0.02333
target 0.01735
stop loss 0.02460

GALAUSDT 1D AnalysisGALA ~ 1D Analysis
#GALA Buy back on retest of this support block with short term target of at least 15%+ from here.