GAS will explode soonFrom where we entered "START" on the chart, it looks like a correction has started.
Examining the waves, it looks like a diametric is over.
There is a nice support range on the chart, and by maintaining this range, GAS can be pumped to sweep the liquidity pools.
Closing a daily candle below the invalidatio level will violate the analysis.
For risk management, please don't forget stop loss and capital management
Comment if you have any questions
Thank You
GASUSDT.P trade ideas

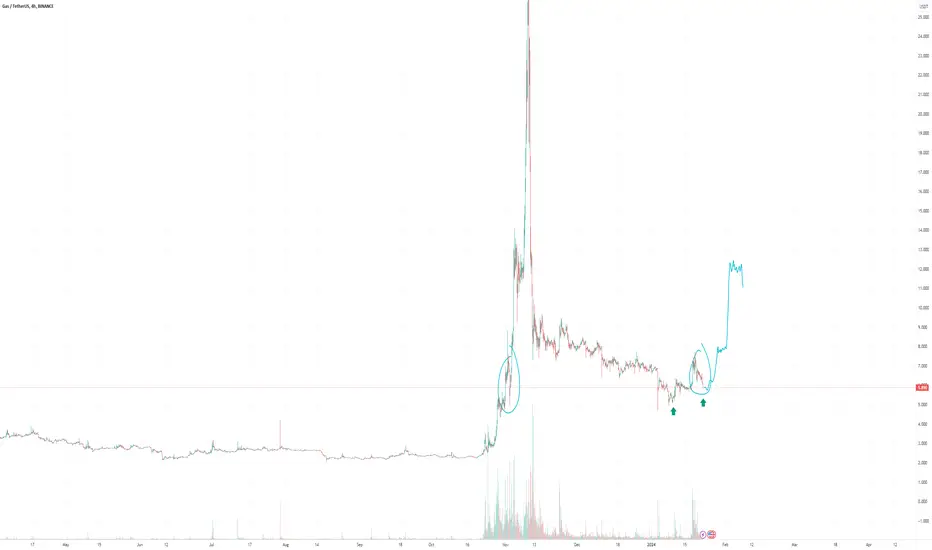
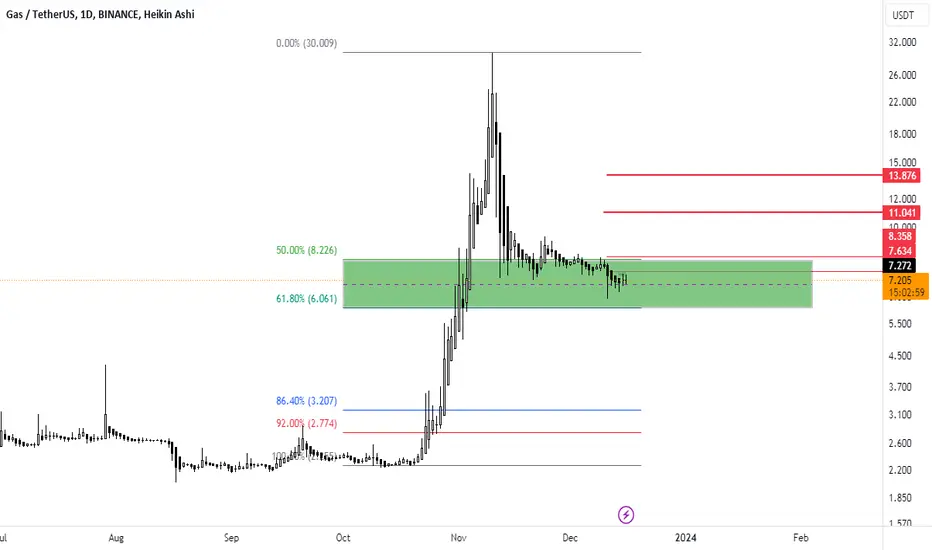
GAS is a beast, buy here againGas pumped a lot, which you can see on the chart. Now we need to think about re-buying this coin for another profit. Where to buy GAS? We have an unfilled FVGAP that I have drawn on the chart; this is strong support. Also, we have the 0.786 FIB retracement. These levels are close to each other, so place your limit orders to buy gas here. Thank me later. We also need to complete the ABC corrective pattern before another pump.
Gas is a token created on the NEO blockchain platform with primary purpose of being fees for processing transactions on the NEO network.
Let me know what you think about my analysis, and please hit boost and follow for more ideas. Thank you, and I wish you successful trades!

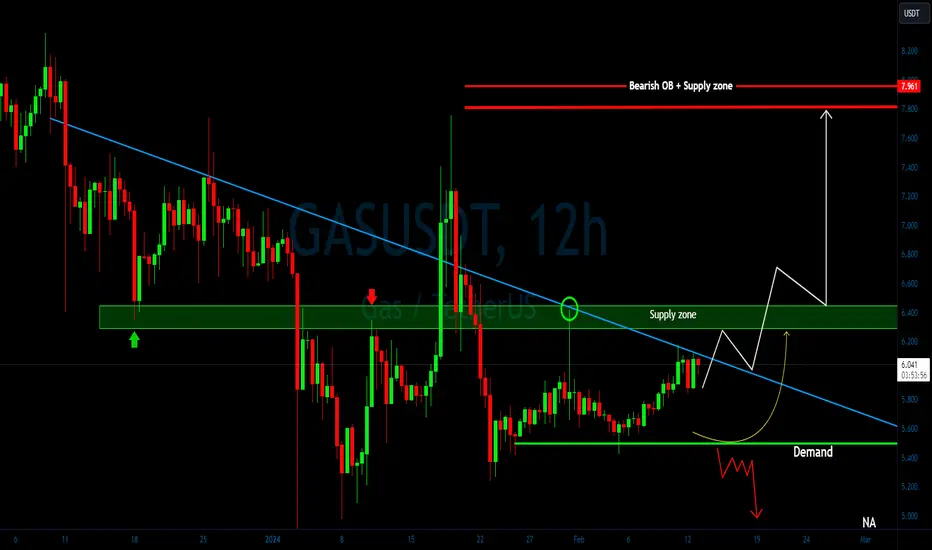
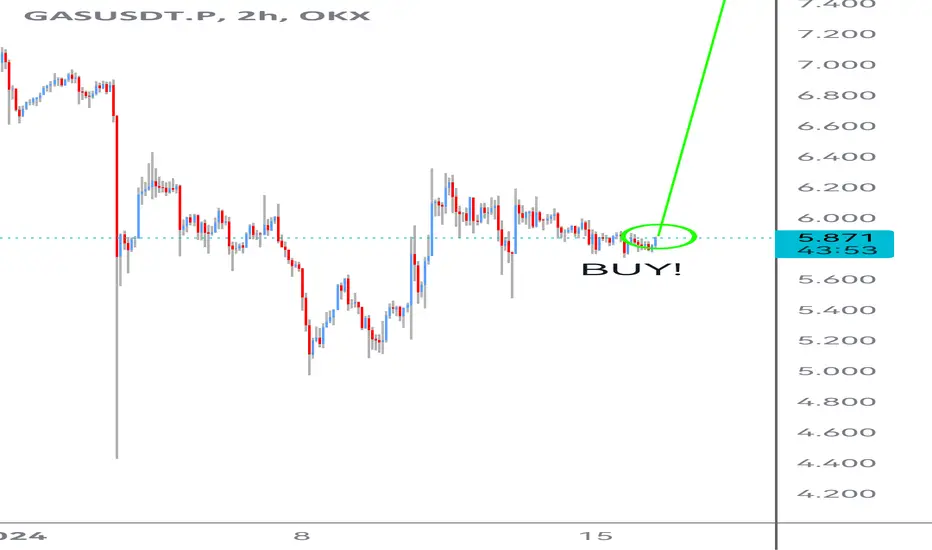
GAS/USDT Nearing a Key Supply Zone with Potential for Action? 👀
💎Paradisers! Let's dive into the intriguing world of #GASUSDT as it navigates towards a crucial supply zone, signaling potential market moves.
💎 On its path, ASX:GAS is tracing a descending channel but now has its sights set on the supply level at $6.406. The real excitement kicks in if it crosses the $6.406 threshold, potentially propelling #GAS towards overcoming the bearish Order Block above.
💎 For the astute traders among us, should the upward momentum hesitate, look for a bullish resurgence from the support level at $5.494. Falling beneath this could steer us into bearish territory.
#GASIn 15 minutes, it is moving in a short-term upward channel, which is an upward correction of the previous wave. Therefore, if you can identify the continuation of the downward trend in the red box with the confirmation candle, you can enter the continuation of the sale transaction. After confirmation in the specified area, the sales transaction can be entered. Otherwise, the transaction will be canceled.

GAS will break new Level, SPOT HOLD🔥 Price on the 4H chart might come at these support areas and see the next history good entry for market at now 22/1/2024🔥
Gus will surprise everyone, spot purchase.I’m looking forward to the flight of all altcoins very soon.
GAS Coin Price Prediction🔥 Price on the 4H chart might come at these support area and we might get a potential bounce🔥
Potential bounce areas for Buying 6.386 and 5.729
👉 Follow me for More Real Time Opportunities.
Share your Thoughts if you have any?

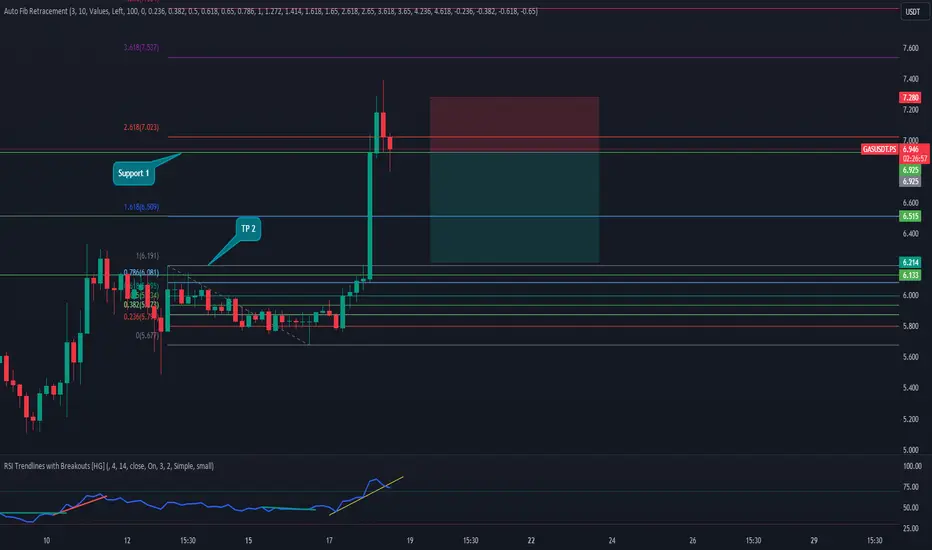
Short position Divergence was observed in RSI and the volume is decreasing
Entry: 6.940
Stop: 7.280
TP: 6.215
📝 This is a personal analysis and practice
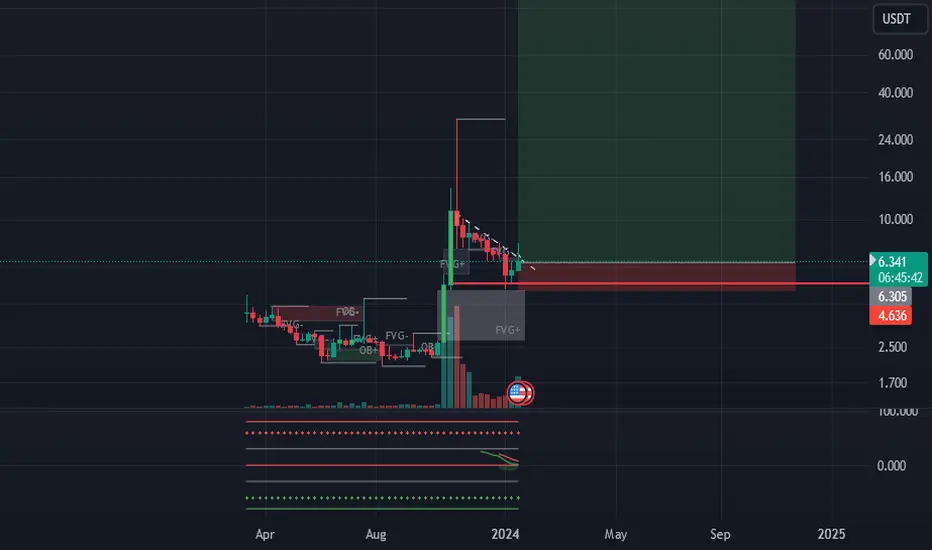
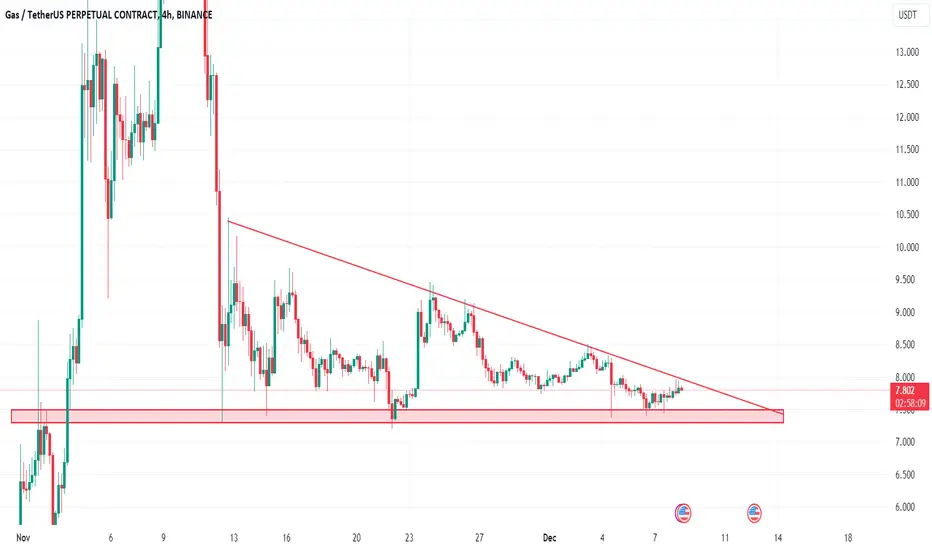
GAS/USDT Perfect breakout the descending channel. Upward Moment?💎 GAS's market performance has recently garnered significant interest. The cryptocurrency has achieved a breakout from a descending channel pattern, a development typically seen as a bullish indicator for future price movement.
💎 However, GAS hasn't yet entered a retesting phase at the support level, suggesting that a period of consolidation or retesting might precede any further upward movement.
💎 Should GAS surge and break through the $7.5 resistance level without first undergoing a retesting phase, it could signal a continued upward trajectory, the probability leading GAS towards a substantial resistance target.
💎 On the other hand, if GAS enters a retesting phase, the ability to maintain support will be crucial. Failure to bounce back from the support level could indicate a false breakout. Losing grip on this support area could lead GAS back towards a key support zone.
💎 This key support zone holds significant importance. Historical patterns indicate that this zone has previously been effective in preventing further price declines. However, if GAS were to fail to hold this support upon a potential revisit, it might indicate a sustained bearish trend, possibly driving the price lower.

GAS? THE SMELL. IT WAS ME // LONG ENTRY SIGNAL Not long ago this coin made some impressive moves.
// Apologies.. I don't know wtf to say, but I have to say something or the post gets pulled. Meh.
It's time for some Long GAS.
Enter at current level.
GSDUSDT Ready for Pump1-Apply your own risk management or follow Precisely my management.
2-Daily and Weekly Targets
3-Raise Often Your SL to protect your profits.
4-Use 5% SPOT
5-Use 8% on Futures with LEV5
ASX:GAS nice accumulation

GAS/USDT Bullish Potential from Demand Zone? 🚀GAS Analysis💎 Paradisers, it’s time to focus on #GASUSDT, which is currently showing an intriguing pattern in the market. Positioned in a demand zone, it is lining up for a possible bullish advance.
💎 Observing #GAS recent trend, it has been effectively navigating a descending channel and has recently broken above it. Presently, HOSE:GAS is undergoing a retest of the channel's resistance, poised for a bullish leap. Its current stance in the demand zone reinforces this bullish outlook, indicating strong market sentiment in favor of the bulls.
💎 However, in the unpredictable world of crypto trading, being prepared for various outcomes is key. If #GAS finds difficulty maintaining its level within the demand zone, a strategic shift may be necessary. This shift could involve preparing for a bullish resurgence from a lower support level at $6.680. Caution is advised, as falling below this support level could signal a shift towards a bearish trajectory. 🌴💰

GAS/USDT Broken Out of a Descending Channel | 👀🚀 What's Next?💎 Paradisers, direct your attention to GASUSDT as it approaches a pivotal stage in the market. The asset is signaling a potential upward break from its current descending channel pattern.
💎 Analyzing #GAS' market trend, it has been consistently moving within a descending channel. At present, GAS is nearing a test of its former resistance level, which now serves as a support at $6.86. There's a significant likelihood that GAS could utilize this level as a launching pad for a bullish trend, aiming towards the key supply level at $8.8.
💎 However, in the ever-evolving crypto market, #GAS traders must be prepared for various scenarios. If GAS does not maintain its bullish trajectory, a change in market direction could be imminent. Traders might then need to recalibrate their strategies, perhaps eyeing a bullish resurgence from a lower support level at $6.35.
💎 If GAS drops below this additional support level, a strategic reassessment would be crucial. This situation could suggest difficulties in sustaining the bullish trend, necessitating an adjustment in trading methods.
💎 Stay strategic and flexible, Paradisers. Your ParadiseTeam is dedicated to navigating you through these market changes, ensuring you're well-prepared for effective and informed trading decisions.

GAS falling wedgeGAS has a falling wedge pattern on 4H Time frame,also had a fake breakout out from that but again backed in the pattern,we expect it will pump from the Demand zone

GAS/USDT The confirmation of a breakout for a long trade!BINANCE:GASUSDT.P The breakout from resistance in the GAS chart is evident, signaling a favorable moment to enter a long trade.
#GAS/USDT LONG SCALP
Entries: $7.196
Take profit 1: $7.308
Take profit 2: $7.518
Take profit 3: $7.918
Stop Loss: $6.543
Stay tuned for trade confirmation and additional updates. Feel free to express your thoughts by liking and sharing in the comments section:)
Thanks
The sroced.

GAS:USDT : PERFECT LONG ENTRY : THIS GETS ME ON YOUR XMAS LIST!After the last spectacular run GAS had, it's hard to not keep an eye on it.
Not sure how soon this will start to move.
What I do know, is that you're unlikely to get a better entry for it than the current level.
Buy and hold until I update the targets.

Long SetupI think this will pump soon, I'm holding a moon bag for when that happens.
(Small amount of capital).
Check marked levels.
Check DCA, Take Profits, DYOR, NFA.
My Opinion & Analysis. Medium Risk High Reward.

GASUSDTshort trade idea, point of interest taken after price takes out inducement..
supply and demand trading (in line with market structure)

GAS/USDT is ready to takeoffGas looks like its ready to takeoff from here. If it breaks that ready line then we can long it with low lev.
GAS/USDT ↗️ Long Trade Setup ↗️Hello Everyone 🙋🏽♂️
Triple Bottom + RSI OverSold
🟠 EP 7.725
🔴 SL 7.430
🟢 TP1 8.024 ⚠️( Close 33% of the trade and Set the SL on EP )⚠️
🟢 TP2 8.319 ⚠️ ( Close 33% of the trade )⚠️
🟢 TP3 8.609 🔥 ( Final result)🔥
We are not responsible of any losses for anyone, our trades are profitable more for long terms and we take losses as everyone,
manage your lot size as well and your SL and TP and my opinion is 0.01 lot for each 500 $.
Don't forget to hit the like bottom and write a comment to support us.
Follow us for more 🙋🏻♂️
Best Regard / EMA Trading .
Disclaimer:
----------------
It's not a financial advise, As everyone we take losses sometime but for long term trading we are profitable traders, so manage your account well with SL and TP and your lot size to keep your account safe and stay in the market

GAS usdt correction mode 40-50% new listed pair to future trade made +700 % move without any big correction , for now GAS seems has no more fuel to up more need make major correction which prediction 40-50% drop all the way down to 8-9$ area .
SL 26.27$
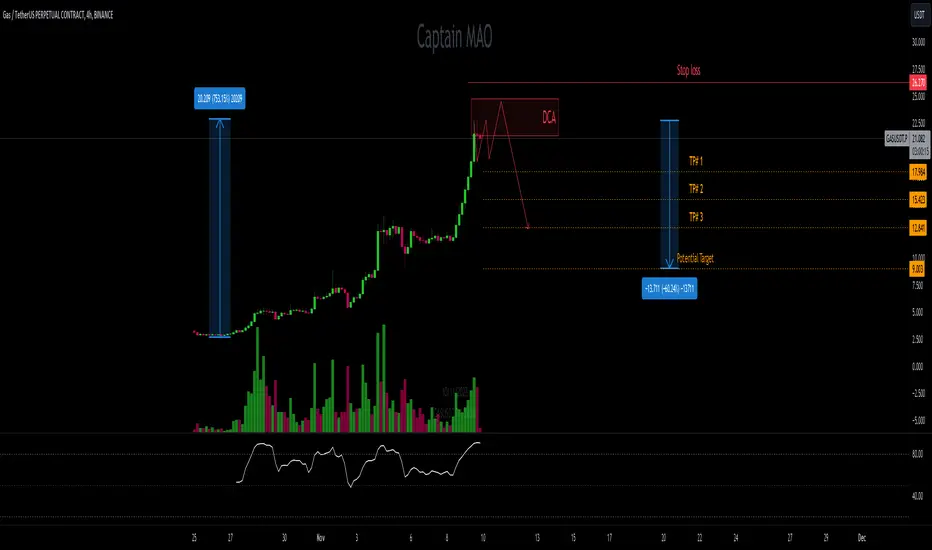
#GASSo, during a complete ascending cycle, it has experienced a deep correction, which is currently in the 2nd correction wave in the 4-hour period, which, if it does not hit another floor, the 3rd ascending wave should continue until the specified areas.
