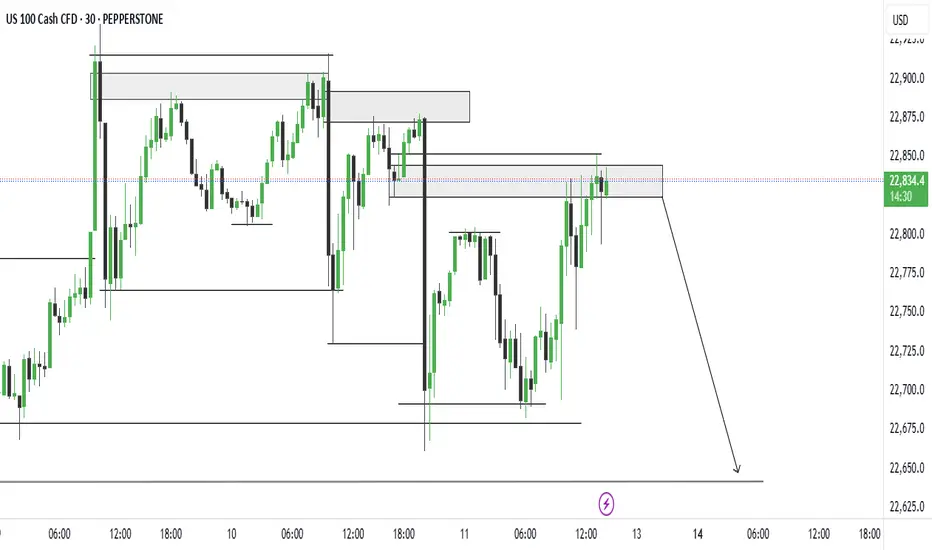
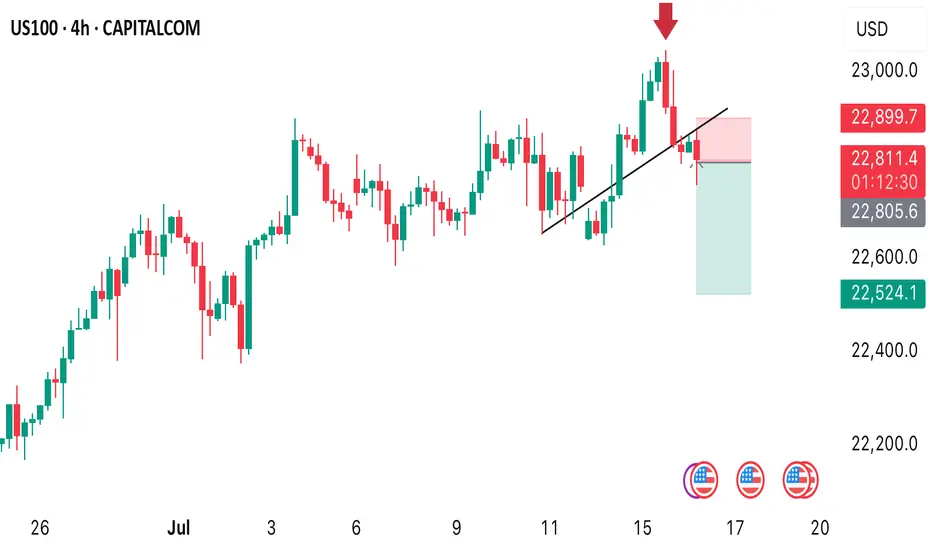
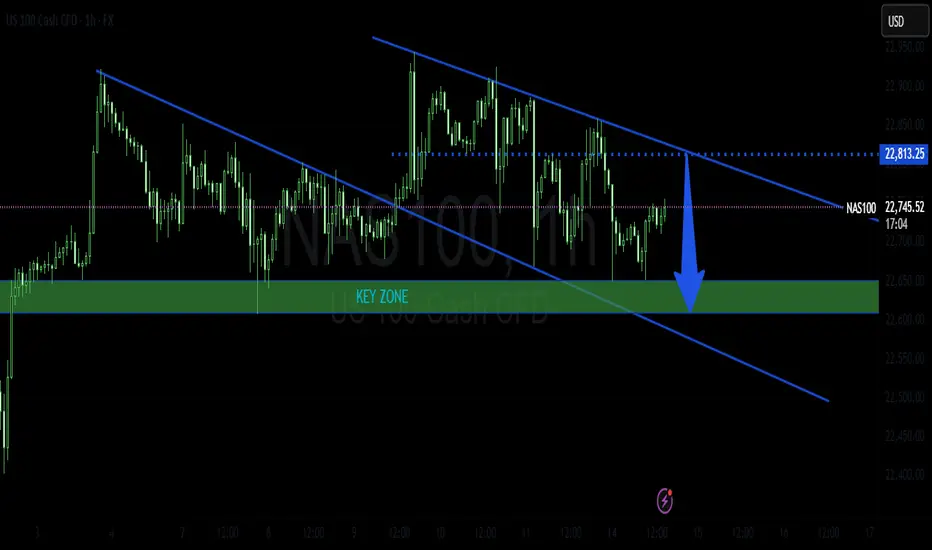
short on nas100I'm looking to short US 100 around the 22,840–22,850 supply zone, where price has previously shown strong rejection. I’m expecting a reversal from this resistance area, targeting the 22,660 level as my take profit. My entry is around the current price, and I’ve placed my stop loss just above the zone at 22,875 to manage risk. This setup gives me a clean structure and a solid risk-reward ratio for the move down.
USTEC trade ideas
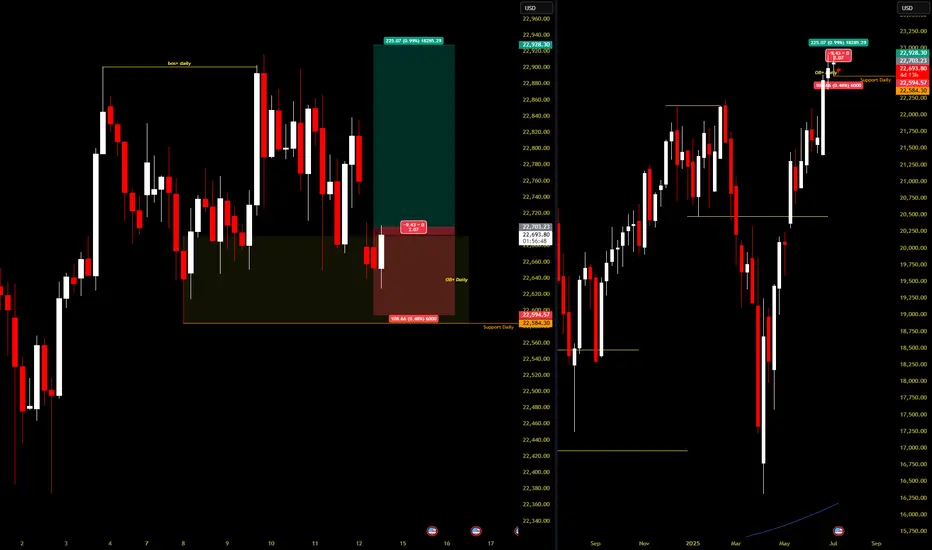
[BUY] Bullish ORDERBLOCK Demand ZoneBreak of structure at the daily creating a higher high
Entered longs at the demandzone/orderblock as highlighted.
SL at daily support (higher low)
Target recent highs at 22,920
COT data indicates that last week, institutions continued to buy NASDAQ heavily.
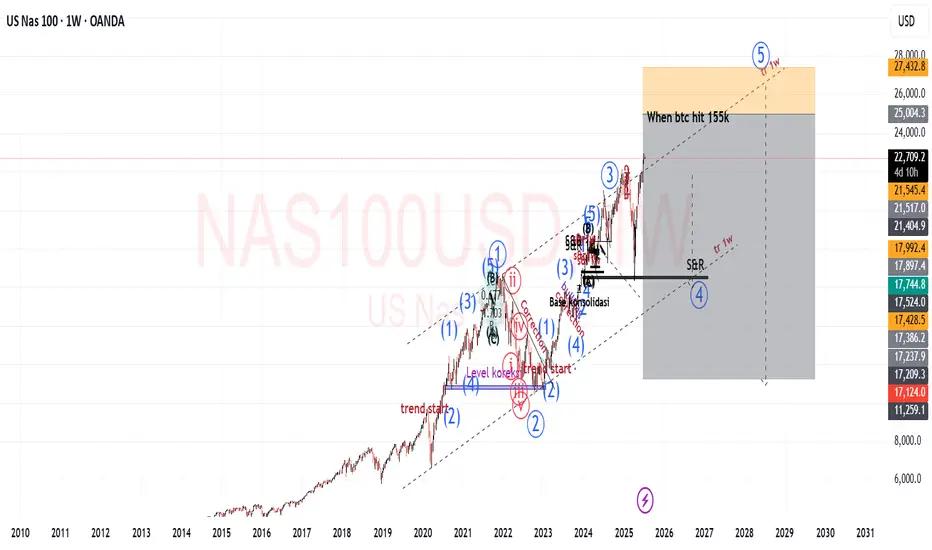
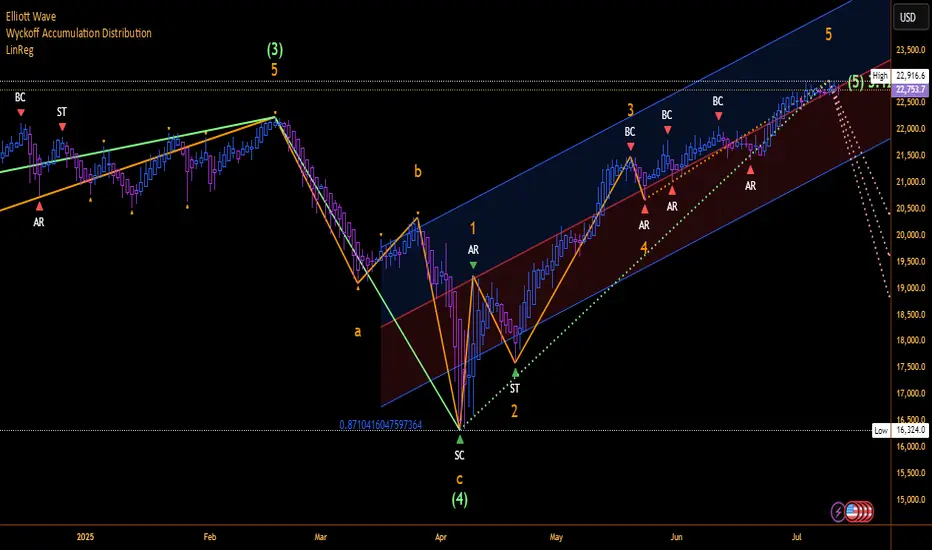
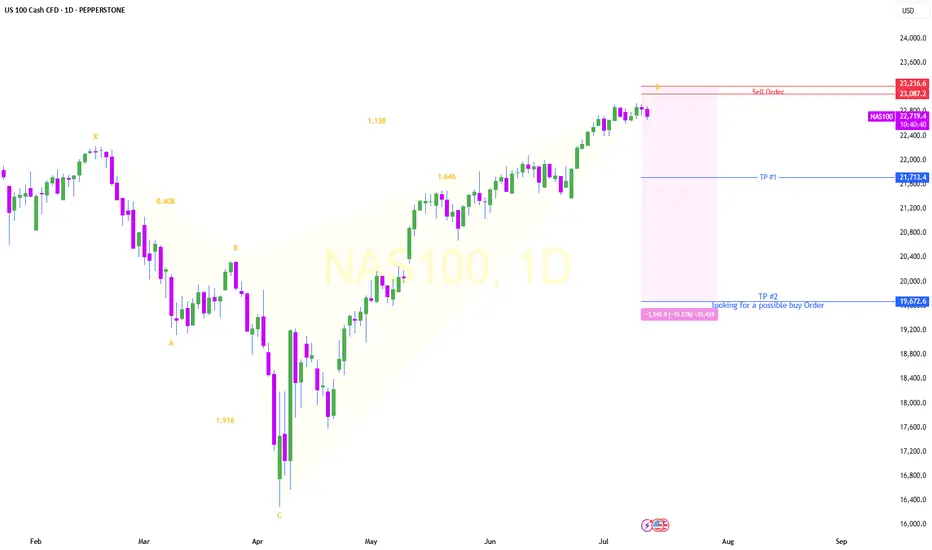
NASDAQ 100 MAJOR REVERSAL SETUP/VOLUME WANINGElliott Wave Theory is a wonderful forecasting tool that provides confluence in conjunction with many technical such as the MFI, Awesome Oscillator, and Bull Bear Power.
Indicators such as Moving averages and ALL Chart Patterns just to name a few, beautifully align painting an amazing roadmap of reversals.
Motive wave in Green, Corrective wave in Pink
Orange Waves are sub waves.
Solid lines are completed, whereas the dotted lines are in progress. The likelihood of a wave count becoming invalidated has a lower probability on higher timeframes for example Day/Week/Month, whereas on lower timeframes such as 1 minute to 5 minute. I've observed wave count invalidation/recalculation of the wave counts more frequently.
With all the news of Tariffs and such the Elliott Wave follows the data, buy/sell side, liquidity, and volume.
Speaking of volume:
April Vol was 15.39M
May Vol was 10.74M
June Vol was 9.04M
As of July 11th it is at 3.37M with 17 trading days to go.
Don't get BULL trapped!!
HAPPY TRADING
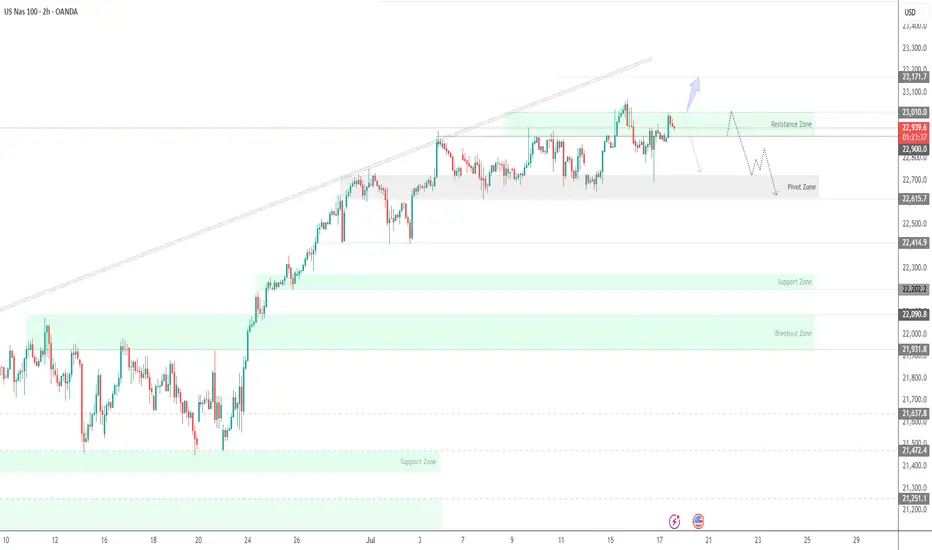
USNAS100 | Consolidation 23010 - 22900, Bearish or Not Yet...USNAS100: Cautious Consolidation as Powell Uncertainty Lingers
Following political noise around Fed Chair Powell — with Trump admitting he floated the idea of replacing him — tech markets have entered a cautious consolidation. While no immediate action was taken, the underlying uncertainty continues to weigh on sentiment, especially in rate-sensitive sectors like tech.
Technically: Consolidation Before the Break
The price is currently consolidating between 22900 and 23010.
A confirmed 1H close below 22900 would signal the start of a bearish trend, targeting 22700 and 22615.
Conversely, a close above 23010 would open the path toward a new all-time high (ATH) at 23170.
Key Levels:
Support: 22700, 22615
Resistance: 23010, 23170
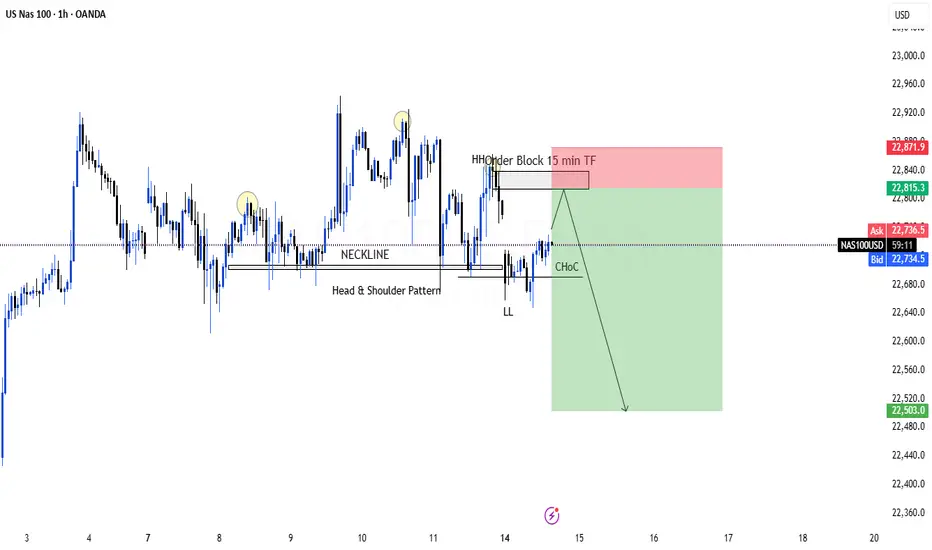
Possible Sell Entry1. CHoC
2. Order Block to be balanced
3. Sell momentum continues
4. H & S pattern also indicating sell
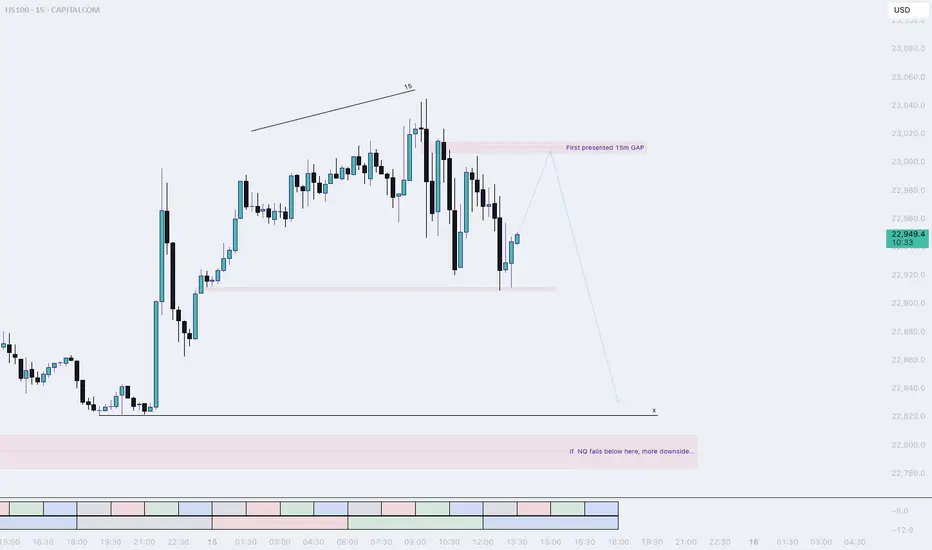
NQ, PM session (Tuesday) (long into short idea)Most likely price will make one more pullback before dropping into sell-side liquidity.
The laggish price action tells us that NQ is not really done IMO. I think a retracement into the 15m Gap is doable for NQ.
Keep watching NQ afterwards, We want to see a sudden drop to confirm our down movement.
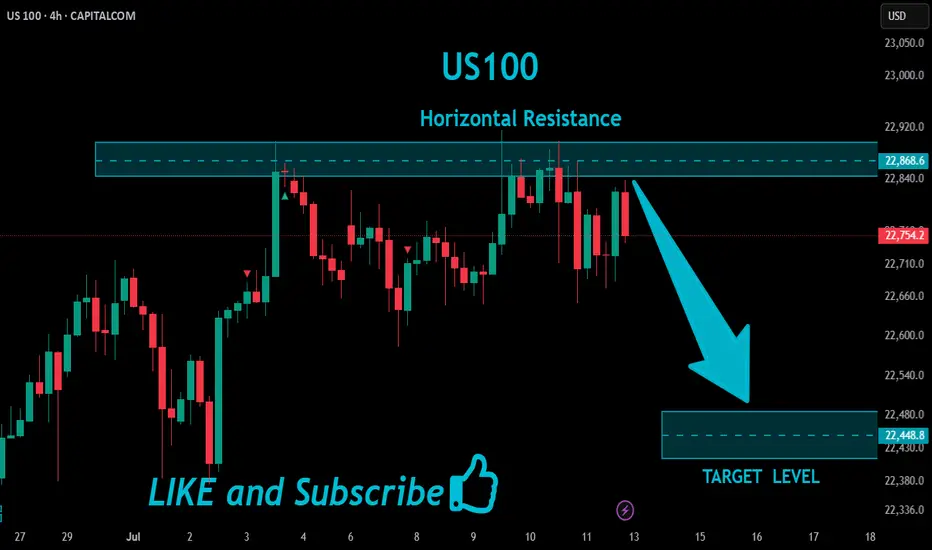
US100 Short From Resistance!
HI,Traders !
US100 is weaker than we
Expected and failed to break
The key horizontal level
Around 22868.6 and we are
Now seeing a bearish rejection
So we are locally bearish biased
And we will be expecting a
Further bearish move down !
Comment and subscribe to help us grow !
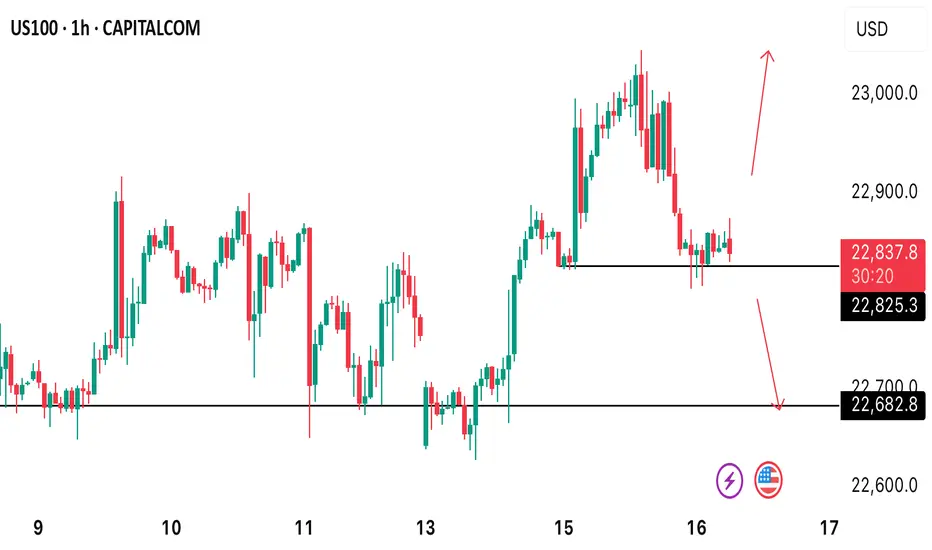
US100 H1 TECHNICAL ANALYSIS.US100 currently trades at 22830 what’s the next potential move on this asset? A reversal to 23024 high or a further decline to 22680. Let’s watch out and see how price reacts at that level.
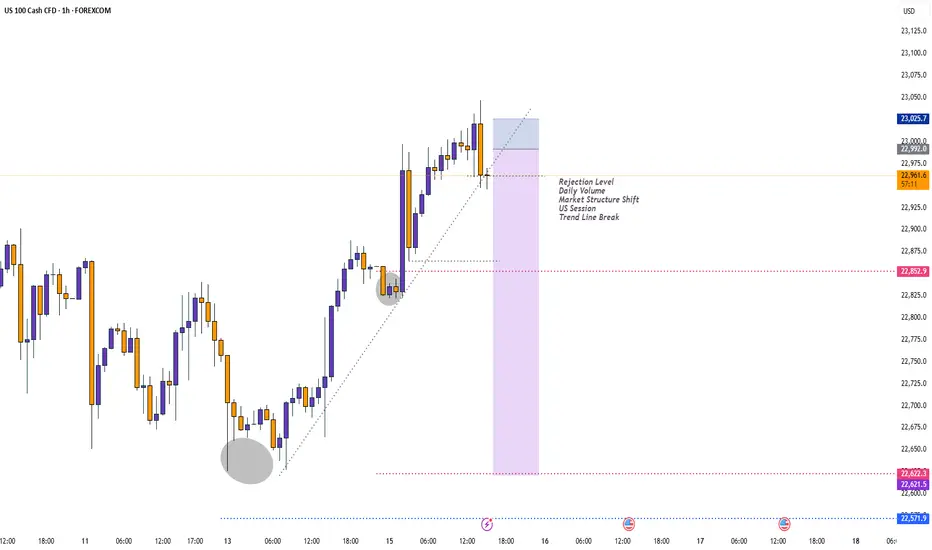
NASDAQ 100 | BearishNASDAQ has formed divergence on RSI.And NASDAQ plays divergence almost all the times.Considering it will honor the divergence then NASDAQ is going to enter into a strong correction phase and it may test its support zones.
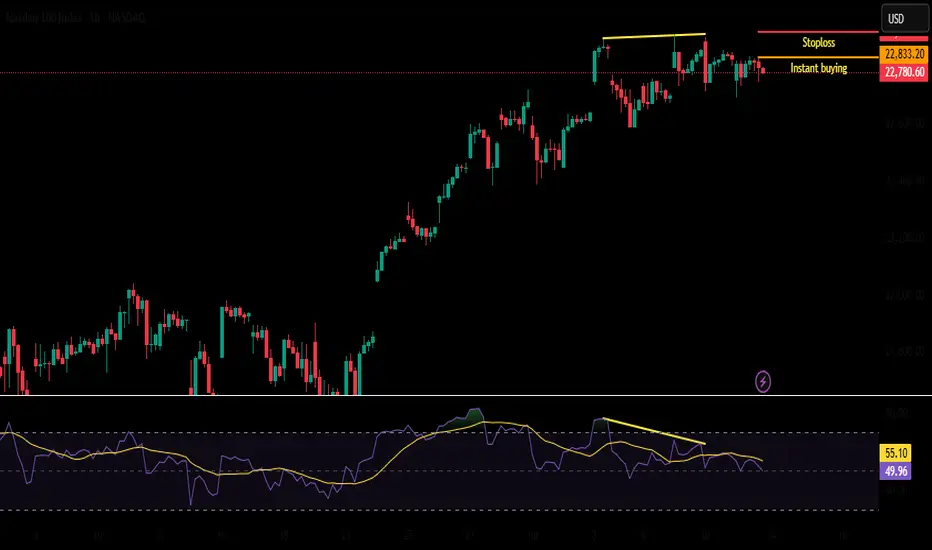
SellTrend Line Break
Previous Day Volume
Weekly Rejection Point
Untapped Order Point
London - US Session
Three Tap High Structure/ Double Top

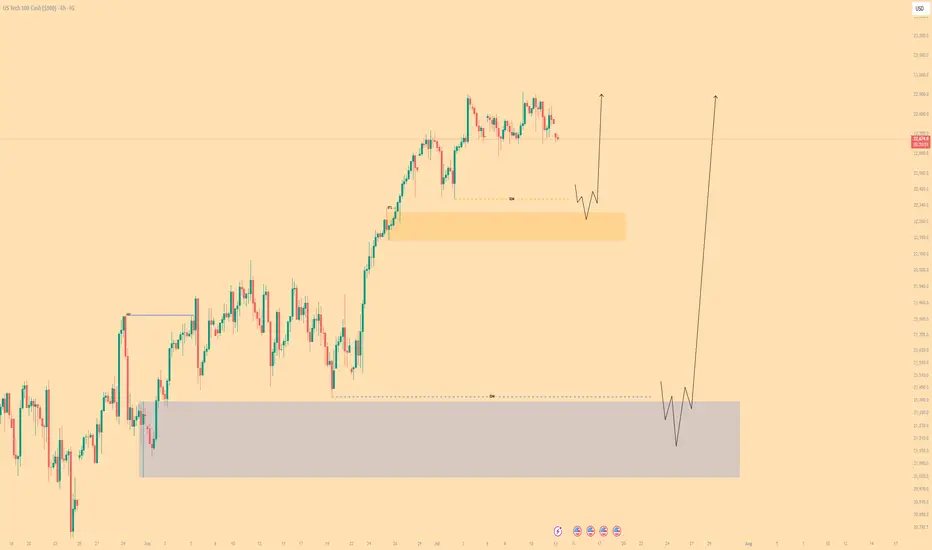
NASDAQ - Bullish BiasHTF Overview: 4H shows strong bullish intent with momentum driving price higher. Clear upside direction supported by sustained breaks in structure.
Liquidity Note: Noticed a key liquidity zone beneath current price (marked in blue). Although deeper mitigation was possible, price remained bullish.
MTF Refinement (30M): Dropped to the 30M for structural clarity and saw an earlier reaction. A bullish OB was formed and respected — now monitoring it for a potential mitigation.
LTF Execution Plan: If the 30M OB is revisited, I’ll be looking to the 1M/5M for confirmation (CHoCH or BOS) before executing long positions.
Mindset: Momentum is with the bulls — just waiting for smart money to confirm their next move.
Bless Trading!
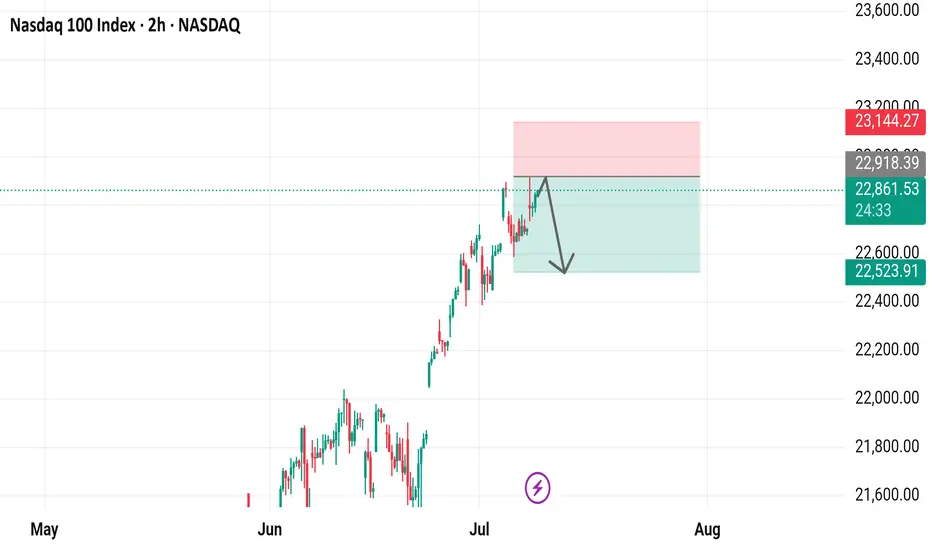
Nasdaq 100 Index 2-Hour Chart Analysis2-hour candlestick chart for the Nasdaq 100 Index (NDX) on the NASDAQ exchange. The chart spans from May to August, showcasing a significant upward trend with notable fluctuations. Key indicators include a recent price of 22,861.53, representing a 0.72% increase. The chart features technical analysis elements such as support and resistance levels, highlighted by green and red boxes, and a downward arrow suggesting a potential price movement.
NAS100 Nasdaq Range-Bound: What Traders Should Watch Next US100I'm currently keeping a close eye on the Nasdaq 🧠📊, which is trading within a range-bound structure 📉📈. While we’re seeing some bullish momentum on the NAS100 4-hour chart today ⏱️📈, it’s nothing particularly strong or decisive just yet. I’m waiting for a clear break 🔓 either above or below this current range before considering any trading opportunities 🎯.
In this US100 chart 🖼️, I’ve highlighted key components such as price action, market structure, the prevailing trend, and other important elements of technical analysis 🧩📐.
⚠️ Please remember: this is a market analysis and reflects my personal opinion — not a trade recommendation. Always do your own due diligence 🕵️♂️ before making any trading decisions. This is not financial advice.

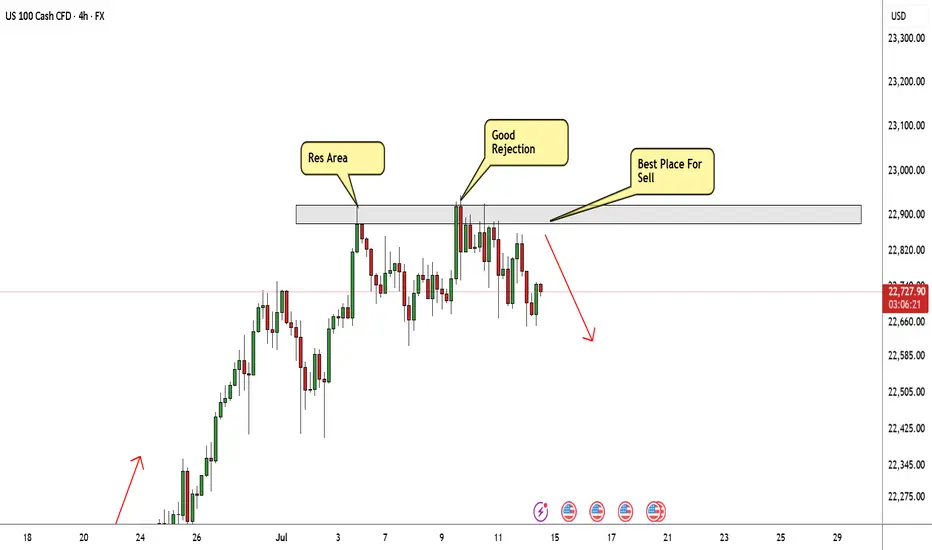
NASDAQ At Good Res , Is It A Chance To Sell To Get 200 Pips ?Here is my 4H Nasdaq Chart and my opinion is the price at very interesting selling area for me , this Res Area forced the prices to go down 2 times and i think this third time will be the best one , so i`m waiting the price to go up a little to retest the res one more time and then we can enter a sell trade and targeting from 100 to 200 pips . the only reason to cancel this idea if we have a clear daily closure above my res area .
US100 SELL OPPORTUNITY A sell opportunity is envisaged as price dropped from the ALL TIME HIGH of 23000. I am shorting it with my target placed at 22524
Take advantage of this opportunity
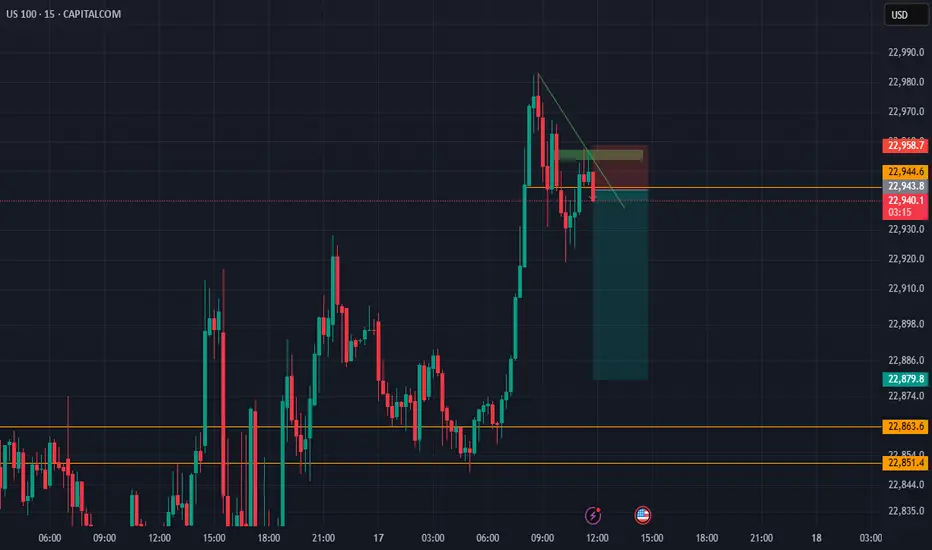
NASDAQ ShortLooking forward to this Setup dropping back down to attent to low of the day as the New york session approaches, Looking to take profit before 15:00 Central African Time
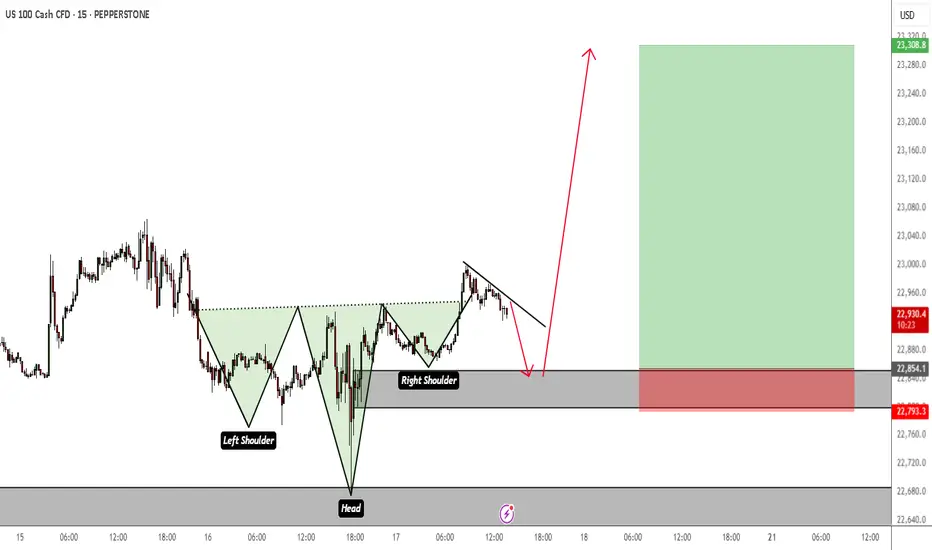
NASDAQ Inverted Head & Shoulders Retest Before Bullish MomentumI see a possible retest of an Inverted Head and Shoulders on M15 TF before the bullish momentum resumes. The SL and TP are just a rough estimation. Price could dip a bit lower than that.
But my overall bias is bullish.
NASDAQ SHORT TRADE PLANThe instrument is trading inside a descending wedge pattern. This pattern has been respected for some time now and I believe it will continue to play.
Please do your own analysis before placing any trades.
Cheers and Happy Trading !!!!
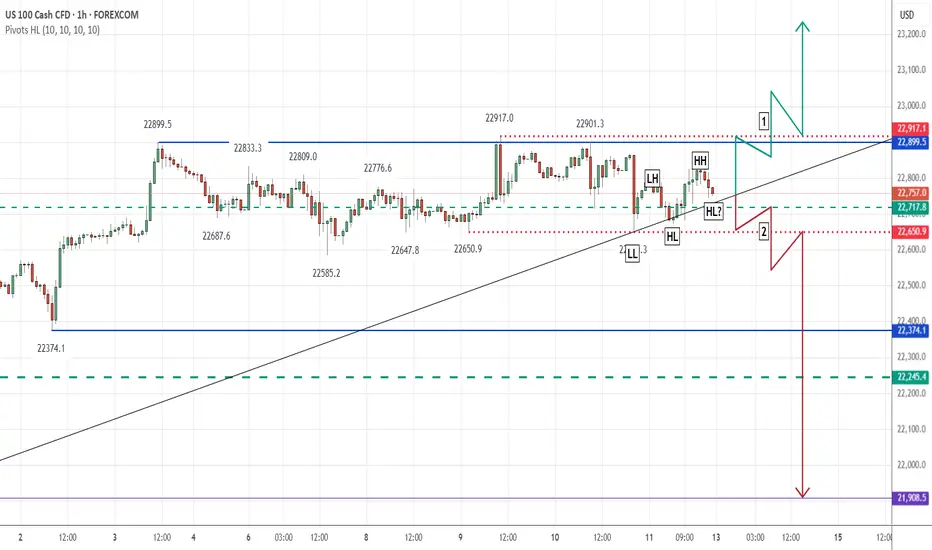
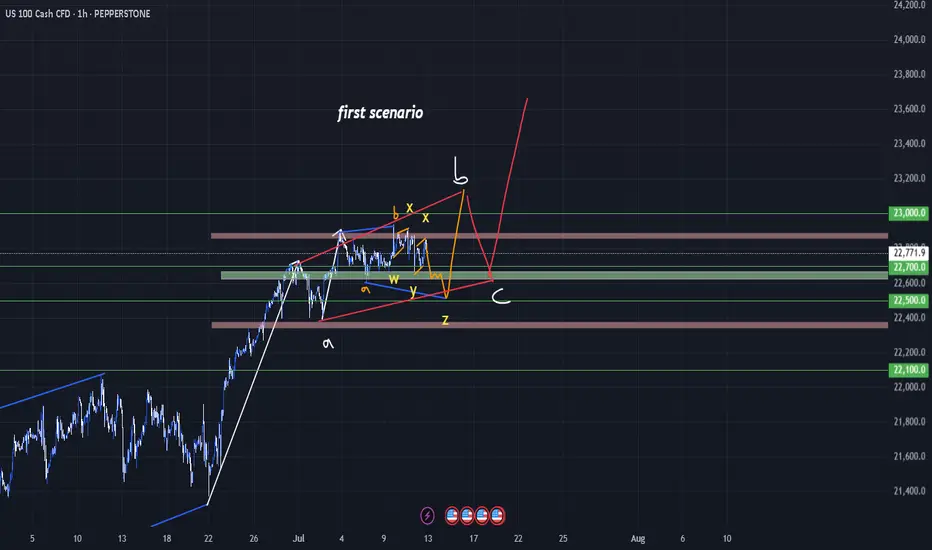
NQ: Upcoming Weekly analysis!FA Analysis:
1- Tariff On/Off: The noise will continue this week as well. Europe will be the target this week.
Uncertainty OR Eternity pause? Market might tend towards Eternity pause which is positive for stocks and equities.
2- New Earnings season: This will be on the driver seat for the next few weeks. Positive earnings for major stocks will impact positively NQ and vice-versa.
3- Macroeconomic data:
CPI and PPI will be relevant for July rate cut. Lower and inline inflation will be very good for July Rate cut; hence very good for Equities. Higher inflation data will be bad.
Also, Consumer sentiment and Inflation expectations, later in the week, will be very relevant.
So from FA Analysis, US equities might go either direction based on data outcomes.
TA Analysis:
Weekly TF: Direction is Buy!
The weekly close was irrelevant; it was inside the bullish green candle. Price must break and close below or above the master weekly candle to establish clear direction.
So nothing to trade from weekly perspective.
Daily TF: Direction is Neutral!
Same as weekly TF, we got an irrelevant daily close, inside the previous daily green candle (red dotted lines).
Price must break and close either below or above the dotted red lines for a clear direction.
Hourly TF: Direction is Neutral!
Based on the Weekly and Daily TF, clearly price is consolidating and looking for FA data to make decision on the next move.
Price is making LL-LH-HL-HH... and switching from one side to another reinforcing the consolidation.
Here are two scenarios:
Scenario 1: Good earnings, macroeconomic data and lower inflation will trigger a new ATH.
Scenario 2: Bad earnings, macroeconomic data and higher inflation will trigger a retrace.
Happy green week!