X1: NAS100/NQ/US100 Short Trade Risking 1% to make 1.35%PEPPERSTONE:NAS100 / CAPITALCOM:US100 Short Trades
PEPPERSTONE:NAS100 / CAPITALCOM:US100 Short for week, with my back testing of this strategy, it hits multiple possible take profits, manage your position accordingly.
Risking 1% to make 1.35%
Note: Manage your risk yourself, its risky trade, see how much your can risk yourself on this trade.
TP-1 is high probability TP but don't overload your risk like greedy, be disciplined trader.
Use proper risk management
Looks like good trade.
Lets monitor.
Use proper risk management.
Disclaimer: only idea, not advice
USTEC trade ideas
NASDAQ 100 TRADING PLAN
⸻
🧠 US100 Multi-Timeframe Playbook
(W1 → D1 → H4 → M30 → M5)
⸻
🔹 Higher Timeframe Context
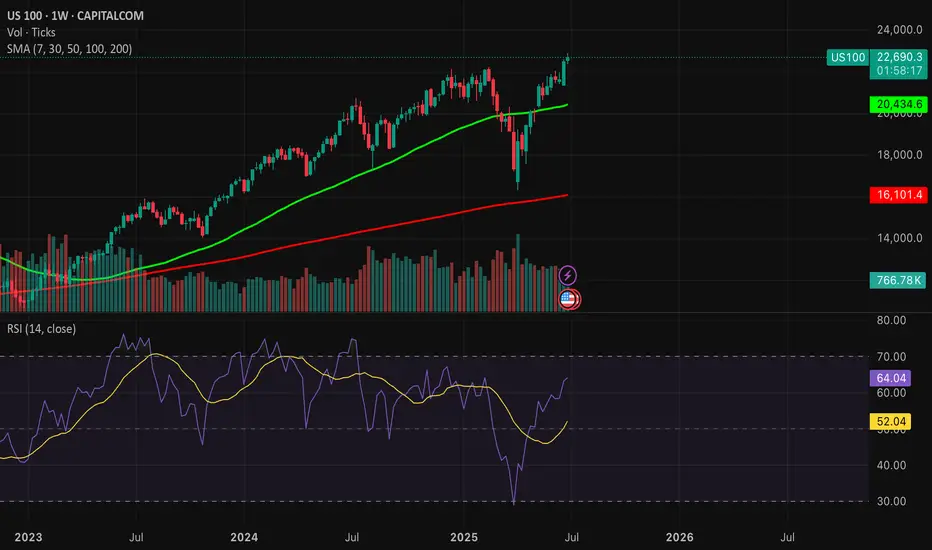
WEEKLY (Strong Uptrend):
• Key Levels:
– ATH supply: 22,800–23,000
– Support shelf (prior resistance): 22,100–22,200
– 50-SMA: 20,400
– 200-SMA: 16,100
• Summary: Bullish structure is intact as long as price holds above 22,100–22,200 and the long-term trendline.
DAILY (Bullish but stretched):
• Key Levels:
– Upper Bollinger Band: 23,025
– Mid-band & 20-SMA: 22,430
– 50-SMA: 21,985
• Summary: RSI at 66 and MACD > 0 but flattening. This suggests bullish momentum may be cooling — odds of a pause or pullback rising.
4-HOUR (Wedge – Late-Trend Exhaustion Risk):
• Key Levels:
– Rising wedge: upper rail ≈ 23,200, lower ≈ 22,450
– 8-EMA: 22,655 | 21-EMA: 22,425
– Anchored VWAP (from June low): 22,350
• Summary: Ribbon still bullish, but volume and MACD momentum are plateauing. A break below 22,450/VWAP confirms a corrective leg.
30-MINUTE (Neutral to Weak):
• Key Levels:
– Descending micro-trendline: 22,725
– Rising support: 22,690
– Session range: High = 22,845 | Low = 22,690
• Summary: Price is coiled near the apex. EMAs curling downward. Market decision point imminent.
5-MINUTE (Immediate Bear Bias):
• Key Levels:
– Live VWAP: 22,752
– 9-EMA sloping down
– Stochastic: mid-range
• Summary: Price remains below VWAP and 9-EMA. Short-term sellers in control unless VWAP is reclaimed.
⸻
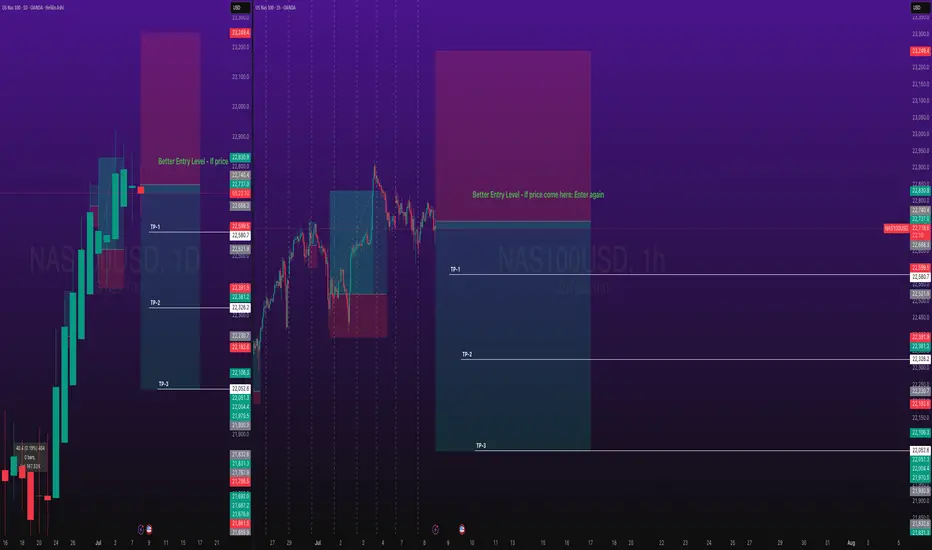
📈 Trade Setups
1. Swing Long – Buy the Dip
• Let price wash through 22,450–22,350 (H4 wedge floor + VWAP zone)
• Enter if:
– 30m bullish engulfing or hammer closes back above 22,450
– AND 5m VWAP is reclaimed
• Initial Stop: Below liquidity sweep or 22,300 – whichever is lower – minus 0.25 × ATR(14, H4) ≈ 30 pts → around 22,270
• Targets:
– T1: 22,845
– T2: 23,200
– Leave runner for blue-sky continuation
• Comment: With weekly trend. Wait for deep retracement. Great RR ≈ 1:3+
⸻
2. Intraday Short – Mean Reversion
• Trigger Zone: 22,725–22,760 (broken trendline + 5m VWAP)
• Enter if:
– 5m rejection wick or bearish engulfing forms on avg+ volume
• Stop: Above 22,800 + buffer (≈ 22,820)
• Targets:
– T1: 22,600
– T2: 22,450
– Optional T3: 22,350 (VWAP)
• Comment: Counter-trend, so treat as scalp. Tight stops. Demand at least 1:2 RR.
⸻
3. Breakout Long – Trend Continuation
• Entry Criteria:
– 30m close above 22,845 with 150%+ average volume
– 5m bull flag holds above breakout level
• Stop:
– First 30m candle close back inside the range
– Or 22,770 (flag base) — whichever happens first
• Targets:
– T1: 23,025 (Daily BB)
– T2: 23,300 (measured move)
• Comment: Only take if strong volume confirms new participation. Avoid during Asia or illiquid hours.
⸻
⚙️ Execution & Risk Guidelines
• Risk per trade: ≤ 1% account (limit counter-trend trades to 0.5%)
• Sizing formula:
Contracts = Account Risk / (Stop pts × $ per pt)
• ATR reference:
– ATR(14, H4) ≈ 120 pts
– ATR(14, 30m) ≈ 80 pts
• Move stop to break-even once price moves 0.75 × stop distance in your favor
• Never run trades #2 and #3 at the same time → directional conflict
• Watch out for macro data (e.g., NFP, CPI) — can override intraday structure
⸻
⏱ What to Watch (In Sequence)
1. Overnight – Does price stay pinned below the 30m 21-EMA, or start to float above it?
2. London Open – First test of the 22,725–22,760 zone: fade or reclaim?
3. NY Open – Volume surge confirms either breakout (#3) or fade setup (#2)
4. End of Day – A close below 22,450 on volume = deeper pullback risk toward 22,000 next week
⸻
🔍 Final Thoughts
The trend is still your friend — but the daily and H4 chart are stretched. Let the trade come to you:
• Buy the flush only if we dip into confluence support and reclaim key levels (#1)
• Buy the breakout only if high volume confirms continuation (#3)
• Everything in-between is a scalp fade (#2) — execute cleanly, with defined risk, and respect trend structure.
This is for educational purposes. Fit these into your system and risk tolerance.
⸻
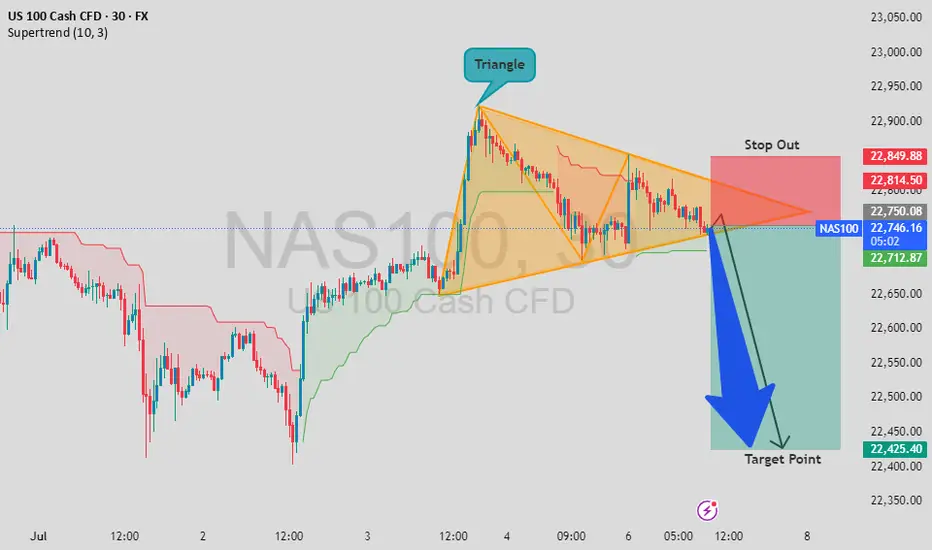
NAS100 - Bearish Triangle Breakdown Forming!NAS100 - Bearish Triangle Breakdown Forming!
A symmetrical triangle pattern has formed on the NAS100 30-min chart, signaling potential volatility ahead. We’re nearing the apex of the triangle, and price action suggests a possible bearish breakout.
🎯 Entry: 22,750.00
🎯Target: 22,400.40
⛔ Stop Out: 22,850.88
The risk/reward setup is favorable if the breakout follows through. Keep a close eye on volume confirmation as price exits the triangle.
What do you think about this triangle formation? Will the breakdown hold, or could bulls trap the shorts again?
💬 Share your opinion below and let’s discuss the setup!
🙏 If you find this helpful, please give it a like and follow for more technical ideas!
NASDAQ 100 – Is Upside Momentum Still Evident?Tough talk on tariffs at the back end of last week and over the weekend from President Trump ahead of his 90 day pause deadline, which is due to end tomorrow (July 9th), helped to put a small dent in trader sentiment, slightly undermining the recent strong upside momentum seen in the US 100 index.
This led to a sell off from fresh all time highs of 22908 registered on July 3rd to a low of 22600 yesterday evening, as the letters sent by the US administration outlining import tariffs of 25% sent to Japan, South Korea and another 12 nations were unveiled.
However, the moves have been relatively muted since then as traders remain optimistic that there is still time for negotiation to agree trade deals given that the new tariffs won’t go into effect until August 1st, providing a potential further 3 weeks to move things along.
Looking forward, in a relatively quiet week for data and central bank speakers, the next moves in the US 100 index towards the Friday close may be dictated by updates on trade deals between the US and EU, and the US and India, both of which have been reported as moving closer to agreement. Technical trends could also be an important factor.
Technical Update: Is Upside Momentum Still Evident?
Future tariff news has the potential to continue to be a very important sentiment driver for global equities, particularly within the tech sector, which the US 100 index reflects within its constituents.
As a result, it can be useful to assess potential support and resistance levels within the US 100 index that traders may be focusing on to gauge the next possible direction for prices.
Possible Resistance Levels:
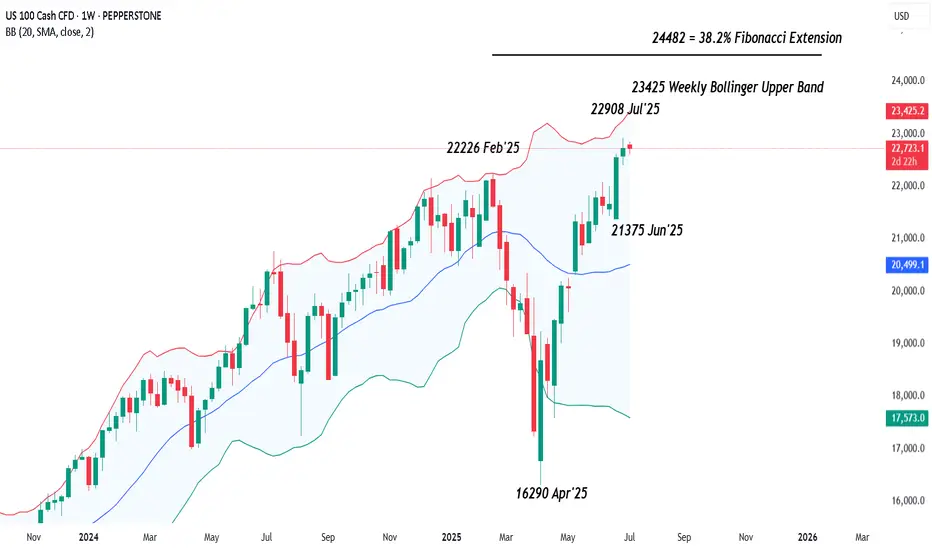
Since posting the April 2025 low at 16290, the US 100 index has rallied by over 40% in only a 13-week period. While this has reflected positive sentiment during this time, traders may well now be questioning if this upside momentum can continue, or if it might stall, even leading to price weakness.
As such, being aware of potential resistance levels against which to judge current price strength that might be able to hold and possibly reverse this latest activity back to the downside, may prove important.
Having previously been strong enough to hold recent price strength, the 22908 July 3rd all-time high, may now represent an area where sellers can be found again, and as such, this marks a potential first resistance focus.
However, closing breaks above 22908 might suggest a more extended phase of price strength, with traders then possibly looking to 23429, the upper weekly Bollinger band and on breaks above this, even towards 24482, which is equal to the 38.2% Fibonacci extension of the February to April 2025 price decline, as the next resistance levels.
Possible Support Levels:
Of course, just because a 40% advance in prices has been seen, doesn’t guarantee it will continue and traders may be trying to focus on support levels that if broken on a closing basis over the coming days, might suggest risks of a more extended decline in price.
Looking at the daily chart above, it might be suggested that the first support is currently represented by 22201, the level of the rising Bollinger mid-average. Closing breaks below 22201 could in turn lead to further price declines to test 22053, the 38.2% Fibonacci retracement of May 23rd to July 3rd price strength, even 21787, the deeper 50% retracement.
The material provided here has not been prepared accordance with legal requirements designed to promote the independence of investment research and as such is considered to be a marketing communication. Whilst it is not subject to any prohibition on dealing ahead of the dissemination of investment research, we will not seek to take any advantage before providing it to our clients.
Pepperstone doesn’t represent that the material provided here is accurate, current or complete, and therefore shouldn’t be relied upon as such. The information, whether from a third party or not, isn’t to be considered as a recommendation; or an offer to buy or sell; or the solicitation of an offer to buy or sell any security, financial product or instrument; or to participate in any particular trading strategy. It does not take into account readers’ financial situation or investment objectives. We advise any readers of this content to seek their own advice. Without the approval of Pepperstone, reproduction or redistribution of this information isn’t permitted.
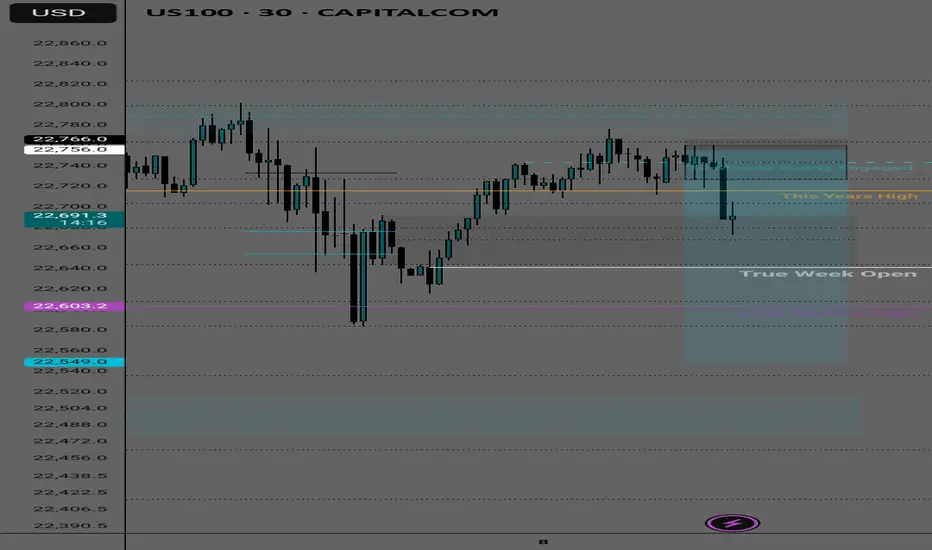
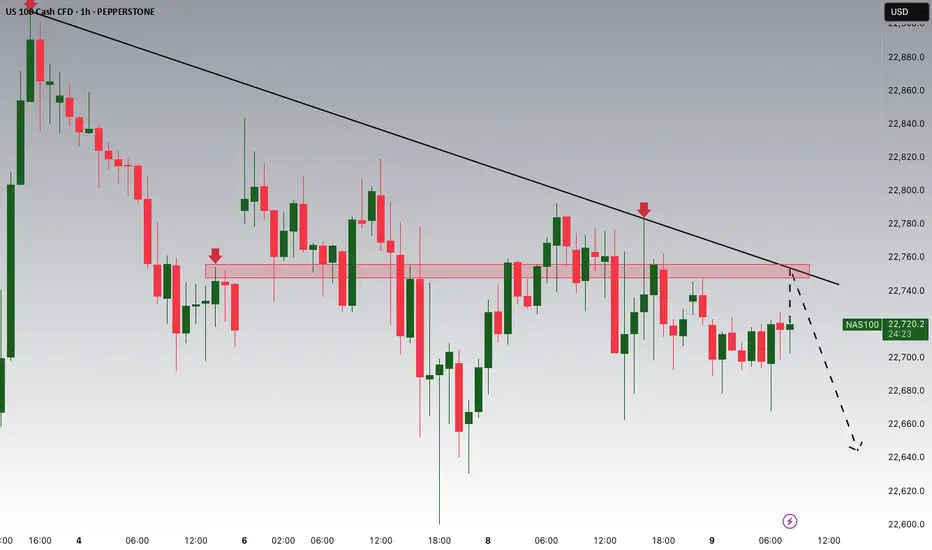
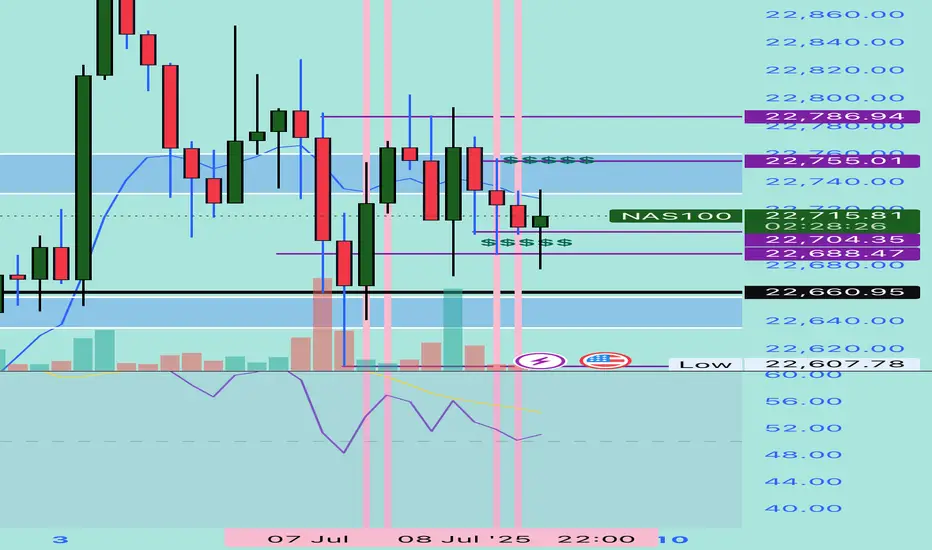
USNAS100 Consolidates Between 22815–22705 | Breakout Will DefineUSNAS100 – Technical Outlook
The NASDAQ remains under pressure amid ongoing tariff uncertainty, with traders closely watching for any progress in negotiations or signs of escalation.
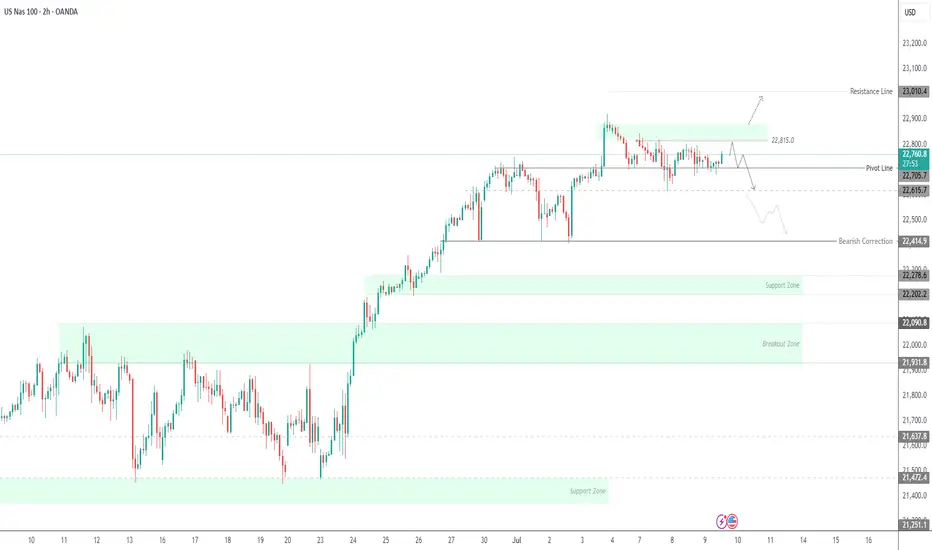
Currently, the price is consolidating between 22815 and 22705, awaiting a breakout to define the next directional move.
A 1H candle close below 22705 would confirm bearish continuation, targeting 22600, with further downside potential toward 22420.
A break above 22815 would shift momentum bullish, opening the way to 22880, followed by 23010.
Key Levels:
Support: 22600 / 22420
Resistance: 22815 / 22880 / 23010
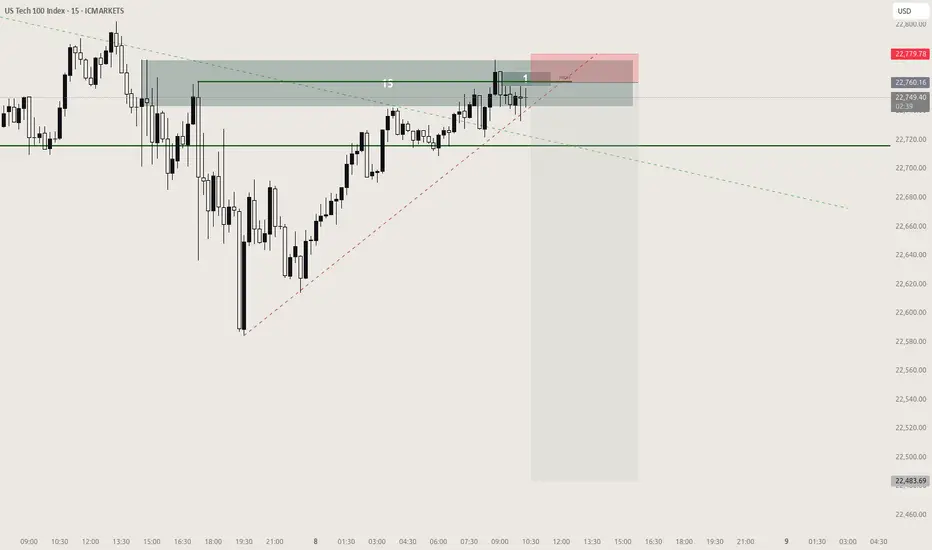
NAS100 sell setup15 min supply zone engineering during market open yesterday will be the key trigger for todays sell off
NASDAQ 100: Breakout Confirmed — Targeting 23,023Market Overview:
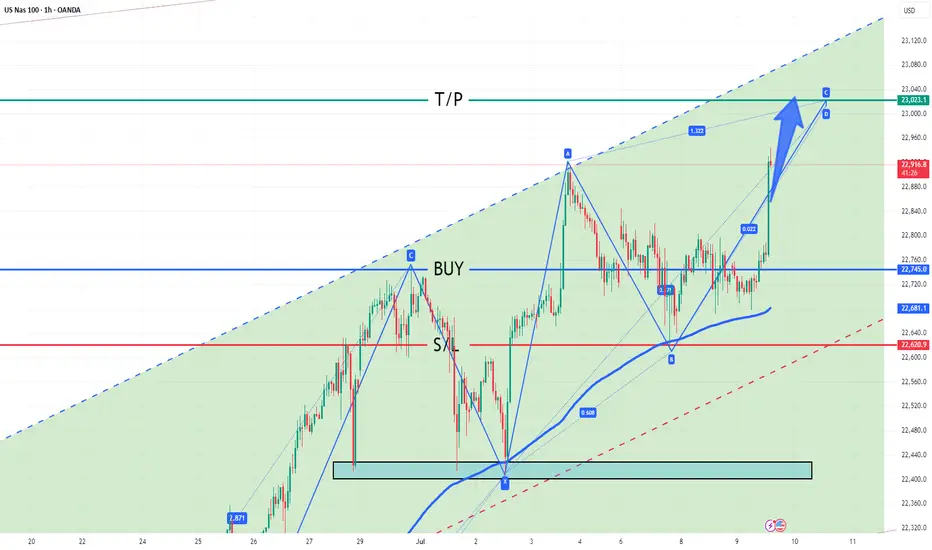
The NASDAQ 100 is showing strong bullish momentum within its ascending channel. After forming an ABCD pattern and breaking above the buy level at 22,745, the price accelerated upward and is approaching the target resistance zone at 23,023.
Technical Signals & Formations:
— ABCD pattern in play
— EMA supports bullish momentum
— Breakout above buy zone at 22,745
— Target is the upper channel boundary and resistance at 23,023
Key Levels:
Support: 22,681, 22,620
Resistance/Target: 23,023
Scenario:
Primary: If the price holds above 22,745, the bullish continuation toward 23,023 remains the main scenario.
Alternative: A drop below 22,681 may lead to a correction toward 22,620 and increase bearish pressure.
NSDQ100 Bullish Flag continuation pattern developing Metals Market Volatility
Trump’s proposed 50% tariff on copper imports triggered a sharp drop in London copper prices (~2%), with risks of falling below $9,000/ton. While U.S. prices spiked on supply concerns, the global move reflects industrial demand fears—potentially weighing on manufacturing and cyclical stocks.
Trade Negotiations Intensify
Asian trade delegates have logged over 350,000 air miles traveling to Washington as tariff timelines remain unclear. Ongoing uncertainty is capping broader risk appetite, though delayed duties and active talks are offering short-term relief to markets.
Fed Under Pressure
Trump ramped up criticism of Fed Chair Jerome Powell, calling him “terrible,” and may consider replacing him with top adviser Kevin Hassett. This raises questions about central bank independence and future rate policy, a potential headwind for investor confidence.
Market Snapshot
U.S. stock futures: Slightly higher
Oil: Up, on Red Sea conflict
Gold: Down, as risk appetite stabilizes
Conclusion – Nasdaq 100 Trading Outlook
Near-term view: Mildly bullish, supported by easing trade tension and tech sector strength.
Caution warranted: Watch for headline risks from new tariff announcements or Fed-related developments.
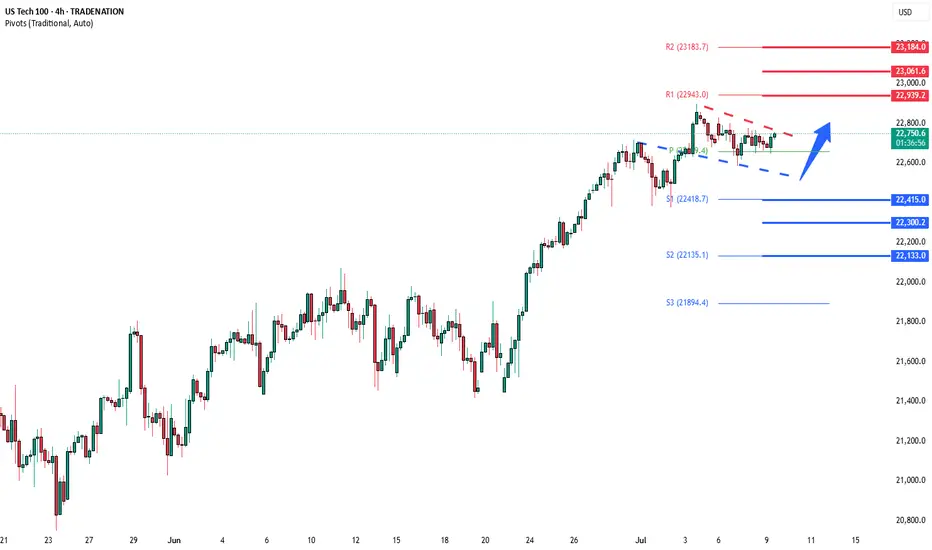
Key Support and Resistance Levels
Resistance Level 1: 22940
Resistance Level 2: 23060
Resistance Level 3: 23180
Support Level 1: 22410
Support Level 2: 22300
Support Level 3: 22130
This communication is for informational purposes only and should not be viewed as any form of recommendation as to a particular course of action or as investment advice. It is not intended as an offer or solicitation for the purchase or sale of any financial instrument or as an official confirmation of any transaction. Opinions, estimates and assumptions expressed herein are made as of the date of this communication and are subject to change without notice. This communication has been prepared based upon information, including market prices, data and other information, believed to be reliable; however, Trade Nation does not warrant its completeness or accuracy. All market prices and market data contained in or attached to this communication are indicative and subject to change without notice.
NASDAQ Potential DownsidesHey Traders, in today's trading session we are monitoring NAS100 for a selling opportunity around 22,750 zone, NASDAQ is trading in a downtrend and currently is in a correction phase in which it is approaching the trend at 22,750 support and resistance area.
Trade safe, Joe.
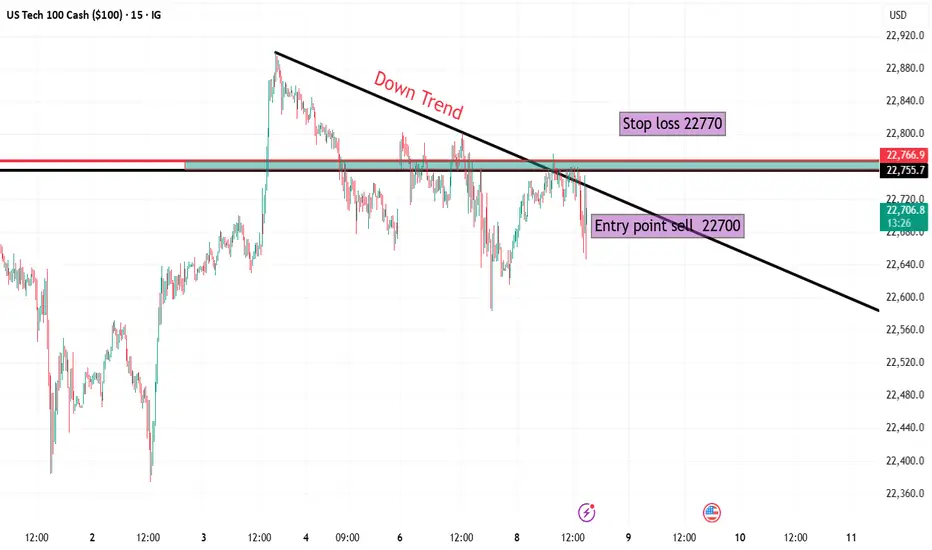
NASDAQ 🔍 Market Overview:
Instrument: US Tech 100 (NASDAQ 100)
Timeframe: 15 Minutes
Current Trend: Short-term downtrend, indicated by the descending trendline connecting recent lower highs.
📉 Trade Setup (Short Position):
Entry Point: 22,700
Price has broken below the trendline and a horizontal resistance zone around 22,750–22,770, confirming bearish pressure.
Stop Loss: 22,770
Placed just above the previous resistance and trendline. A break above this level would invalidate the downtrend structure.
Target: 22,070
This level aligns with a previously tested demand/support zone, offering a logical take-profit area.
📊 Risk/Reward Analysis:
Risk: ~100 points
Reward: ~640 points
Risk-to-Reward Ratio: 1:6, which is excellent and indicates a high potential reward relative to the risk.
📌 Technical Observations:
Trendline: Clearly established downtrend with lower highs.
Breakout Confirmation: Price rejected from trendline + horizontal resistance = confluence zone.
Volume & Momentum (not shown but advisable to check): Traders should confirm the breakout with increased selling volume or bearish momentum indicators (e.g., RSI dropping below 50 or MACD crossing down).
✅ Conclusion:
This is a well-structured short (sell) setup with:
Clear trendline rejection,
Defined entry, stop loss, and target,
A favorable risk-to-reward ratio.
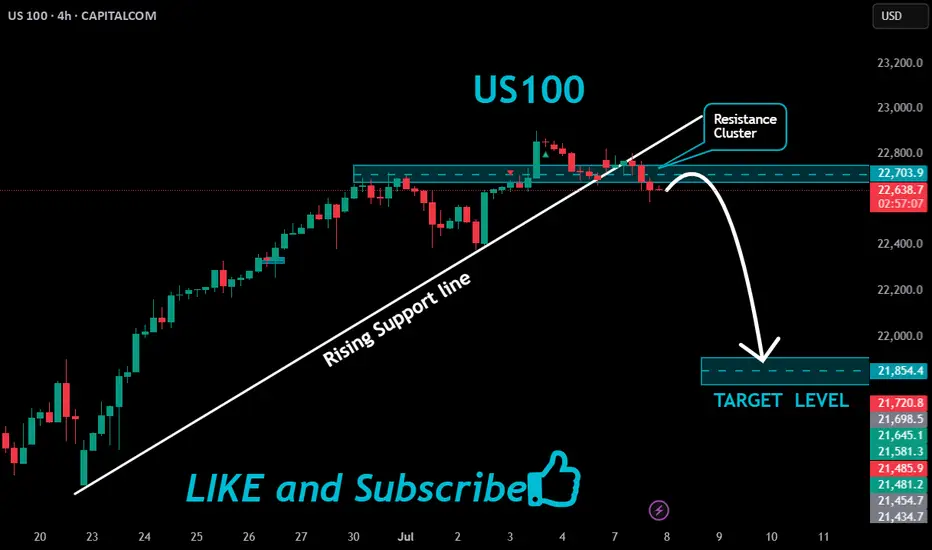
US100 Resistance Cluster Above!
HI,Traders !
#US100 made a bearish
Breakout of the support
Cluster of the rising and
Horizontal support levels
Which is now a resistance
Cluster round 22703.9 then
Went down and made a local
Pullback on Monday but we are bearish
Biased mid-term so we
Will be expecting a further
Bearish move down this week !
Comment and subscribe to help us grow !
NASDAQ After the Fireworks: Bearish Setup LoadedAfter the classic 4th of July rally, I stepped in on the short side of Nasdaq, targeting 22,000 and 21,400 zones. The market structure shows exhaustion, and with the cloud retest failing to hold new highs, I positioned accordingly.
Technical:
• Price stalled at prior expansion highs with tight compression near 23,000.
• Daily FibCloud offered resistance confirmation.
• Bearish risk-reward skew forms after extended rally and thin retraces.
• Volume divergence spotted.
Fundamentals:
Multiple overlapping uncertainties:
• Trump confirmed tariffs will take effect on August 1, threatening a 10% surcharge on BRICS-aligned nations.
• Treasury Secretary Bessent anticipates several trade deal announcements within 48h—but stresses quality over quantity.
• Bank of America maintains its base case of 0 rate cuts in 2025, citing strong economic data and sticky inflation risks.
The combination of tariff escalation, hawkish monetary expectations, and global trade friction creates a perfect backdrop for volatility and correction—especially in overextended tech indices like the Nasdaq.
Note: Please remember to adjust this trade idea according to your individual trading conditions, including position size, broker-specific price variations, and any relevant external factors. Every trader’s situation is unique, so it’s crucial to tailor your approach to your own risk tolerance and market environment.
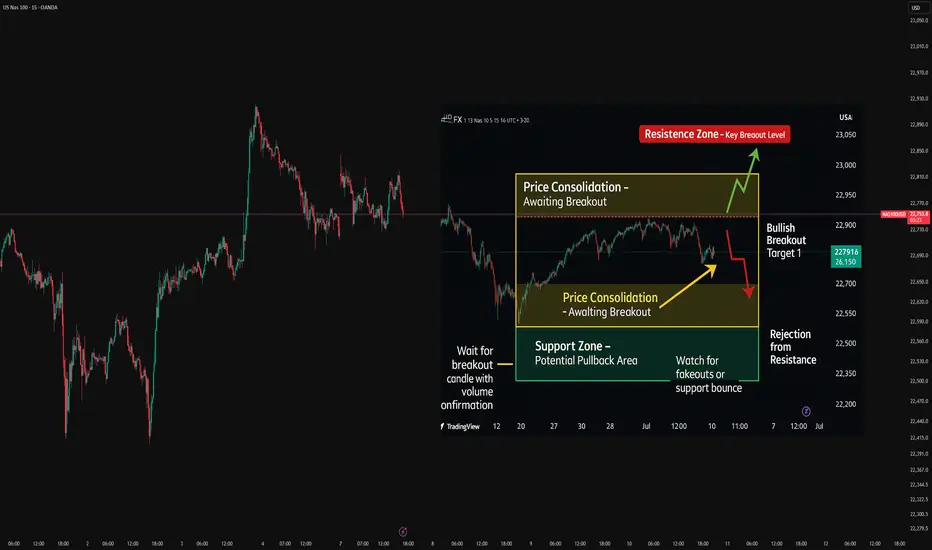
Technical Analysis – NAS100 (15min)Chart Overview Date: July 7, 2025
Market: NAS100 (US Tech 100 Index)
Timeframe: 15-Minute
Chart Context: Clean with Price Action Focus
🧠 Market Structure
Overall uptrend structure since June 21st – higher highs and higher lows.
Key resistance zone: 22,900 – price was rejected here multiple times.
Support area: 22,500 – formed after bullish impulsive move and retest.
🎯 Entry Scenario
Currently in a sideways consolidation between 22,700 – 22,900.
A break above 22,900 with strong volume can lead to a bullish continuation.
Alternatively, a rejection near 22,900 with bearish engulfing candle may offer a short scalp back toward 22,700.
📈 Bias & Confirmation
Trend Bias: Bullish
Wait for:
Breakout and close above resistance for long.
Rejection and bearish signal at resistance for short.
📌 Plan
Type Trigger SL TP Target 1 TP Target 2
Long Break & close >22,900 <22,800 23,050 23,150
Short Rejection @22,900 >22,950 22,720 22,600
"📊 Clean and structured technical analysis on NAS100 – Currently consolidating after a strong uptrend. Watching key levels around 22,900 for breakout or rejection scenario.
Trade safe. 📈 #ALIPFX #TechnicalAnalysis #NAS100"
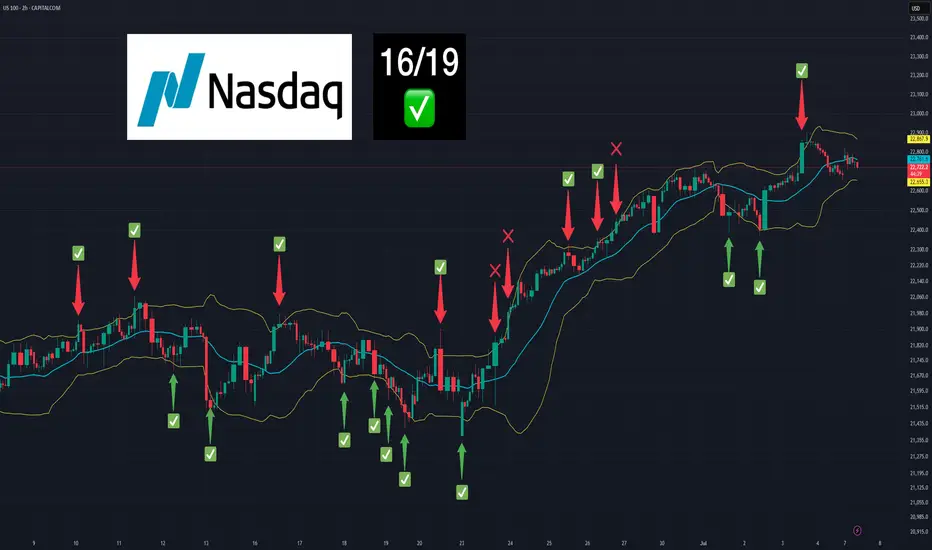
Bollinger Bands: How to Stop Being a Slave to the Markets.Bollinger Bands are a technical analysis indicator widely used in trading to assess the volatility of a financial asset and anticipate price movements. Created in the 1980s by John Bollinger, they consist of three lines superimposed on the price chart:
The middle band: a simple moving average, generally calculated over 20 periods.
The upper band: the moving average to which two standard deviations are added.
The lower band: the moving average to which two standard deviations are subtracted.
These bands form a dynamic channel around the price, which widens during periods of high volatility and narrows when the market is calm. When a price touches or exceeds a band, it can signal an overbought or oversold situation, or a potential trend reversal or continuation, depending on the market context.
What are Bollinger Bands used for?
Measuring volatility: The wider the bands, the higher the volatility.
Identify dynamic support and resistance zones.
Detect market excesses: A price touching the upper or lower band may indicate a temporary excess.
Anticipate reversals or consolidations: A tightening of the bands often heralds an upcoming burst of volatility.
Why is the 2-hour time frame so widely used and relevant?
The 2-hour (H2) time frame (TU) is particularly popular with many traders for several reasons:
Perfect balance between noise and relevance: The H2 offers a compromise between very short time frames (often too noisy, generating many false signals) and long time frames (slower to react). This allows you to capture significant movements without being overwhelmed by minor fluctuations.
Suitable for swing trading and intraday trading: This TU allows you to hold a position for several hours or days, while maintaining good responsiveness to take advantage of intermediate trends.
Clearer reading of chart patterns: Technical patterns (triangles, double tops, Wolfe waves, etc.) are often clearer and more reliable on H2 than on shorter time frames, making decision-making easier.
Less stress, better time management: On H2, there's no need to constantly monitor screens. Monitoring every two hours is sufficient, which is ideal for active traders who don't want to be slaves to the market.
Statistical relevance: Numerous backtests show that technical signals (such as those from Bollinger Bands) are more robust and less prone to false signals on this intermediate time frame.
In summary, the 2-hour time frame is often considered "amazing" because it combines the precision of intraday trading with the reliability of swing trading, thus providing superior signals for most technical strategies, particularly those using Bollinger Bands.
To summarize
Bollinger Bands measure volatility and help identify overbought/oversold areas or potential reversals.
The 2-hour timeframe is highly valued because it filters out market noise while remaining sufficiently responsive, making it particularly useful for technical analysis and trading decision-making.
NASDAQ Potential Bearish Reversal Analysis NASDAQ Potential Bearish Reversal Analysis 🧠🔻
The chart illustrates a potential bearish setup forming after a recent uptrend in NASDAQ. Let's break it down professionally:
🔍 Technical Overview:
Ascending Trendline Break ✅
Price had been respecting a steady ascending trendline.
A break below this trendline indicates a possible momentum shift from bullish to bearish.
Bearish Pattern Formation 🔷
A bearish flag/pennant-like formation can be observed after the sharp rise.
This consolidation followed by a breakdown could be a continuation pattern, hinting at further downside.
Resistance Rejection 🔴
A red arrow marks a clear rejection from the resistance zone near 22,800 USD.
Strong wick rejections and bearish candles suggest selling pressure at that level.
Support Turned Resistance (SUPPOT 🛑)
The previously broken support zone is now acting as resistance (note: "SUPPOT" appears misspelled—should be "SUPPORT").
Bearish Target Zone 🎯
The chart marks a "TAEGET" zone (should be "TARGET") near the 21,900 – 22,000 USD range.
This aligns with prior consolidation and demand zones, making it a likely area for price to retrace.
📌 Key Zones:
Resistance (Rejection Area): 22,800 USD
Current Price: 22,739.7 USD
Bearish Target Zone: 21,900 – 22,000 USD
⚠️ Conclusion:
The market shows signs of a bearish reversal with a confirmed trendline break, resistance rejection, and bearish pattern formation. If the price fails to reclaim the 22,800 level, there’s a high probability of downward continuation toward the 22,000 target.

NAS100 LONG TRADE PLANThe instrument has broken above the descending trend line. This is an indication of the bullish rally.
Please do your own analysis before placing any trades.
Cheers and Happy Trading !!!
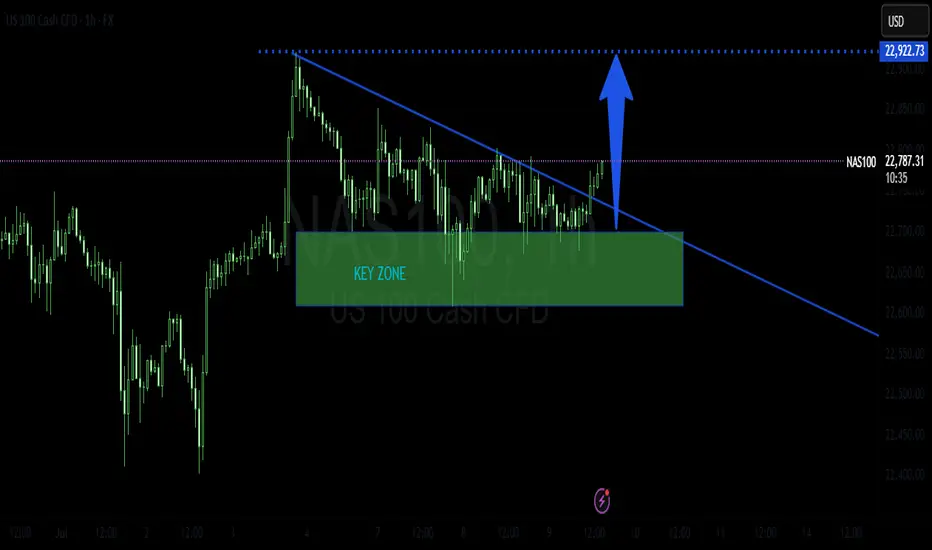
US100 – Trendline Break Signals Potential RallyUS100 breaks above descending trendline.
🎯 Targets: 22799 → 22877
⚠️ Invalidation if price drops below 22702
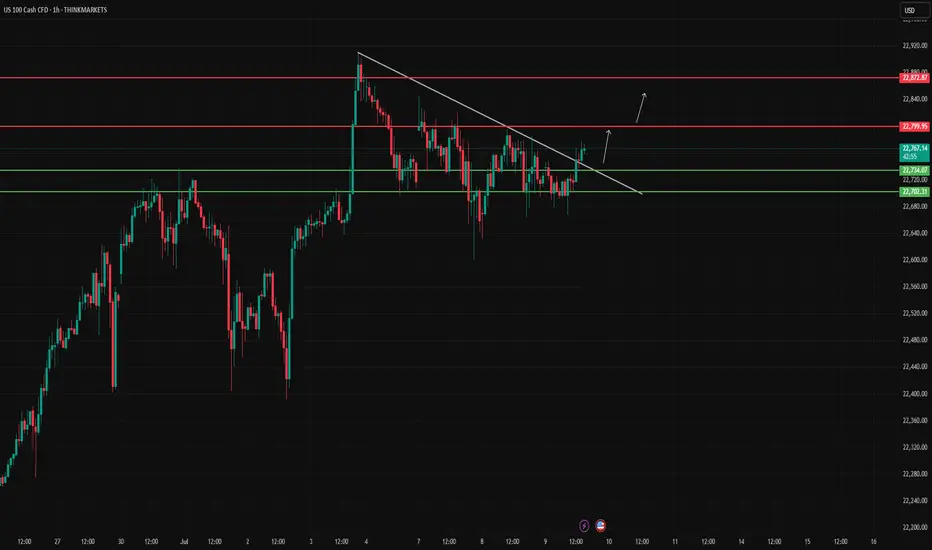
Pullback before next leg up
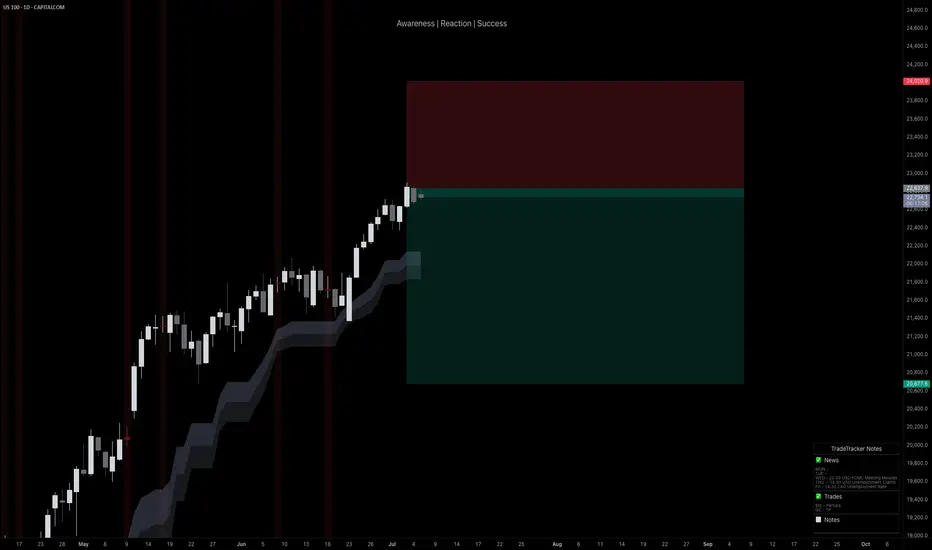
NASDAQ’s looking weak short term. We’ve seen multiple rejections from the highs, an M pattern forming on the daily, and RSI divergence creeping in on the daily — momentum is clearly fading. I already took profit around 21980. And a few small swings between the range since 3rd of June.
The rally off the tariff drop was sharp, but it feels mechanical. Bulls look tired here. You can see price is stalling — pushing into the same highs but getting nowhere. Classic signs of distribution.
That said, this isn’t the start of a full-blown bear market. The long-term trend remains bullish. AI investment is still piling into the U.S., tech’s still leading globally, and structurally we haven’t broken down yet. Some weakness is starting to show though.
But short term, I think we see a pullback. The Fed’s still sitting on the fence with rate cuts, which is creating uncertainty. Add that to the current geopolitical tensions, and there’s enough on the table to justify a temporary risk-off move.
If price breaks and closes above 21,860, I’ll reassess and potentially shift back to a bullish bias. Until then, I’m leaning short and letting price action do the talking.
My key downside levels:
TP1: 21,483 — scale out and protect.
TP2: 21,322 — potential bounce from this area.
TP3: 21,145 — structure starts to weaken.
TP4: 20,894 — bears starting to control and a deeper flush, I’ll reassess bias at this level.
SL @ 21850 on my second entry short
Short term: pullback likely.
Big picture: still bullish — but bulls need to reset before any next leg up.

Nas100 is Still Correcting Nasdaq is Correcting
Long Term we are still Bullish
Remember that markets hunt liquidity
The short term trend is Lower Highs and Lower Lows
Price is still in Premium For Sells
Looking for a retest of previous short term high and my TP would be around 22580
The only way I would get into a buy trade if price would retest the current support and hold with very bullish price action. No little candles etc.
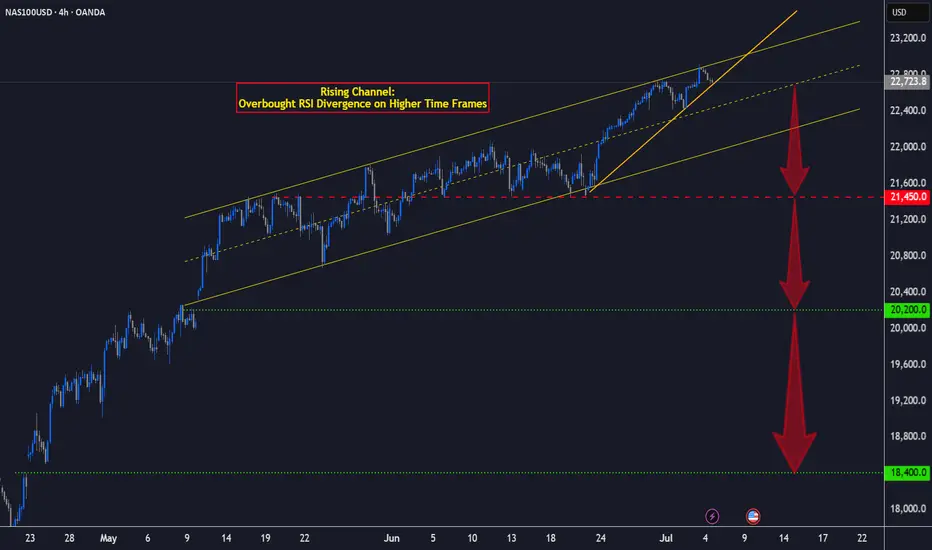
NAS100 CAUTION - Realistic Perspective!!Dear Friends in Trading,
How I see it,
This rising channel represents severe overbought greed territory.
A very big correction might be around the corner or in the near future.
Daily and Weekly RSI Divergence could be forced to re-balance at any time.
Keynote:
This is not a contradiction of my previous NASDAQ post.
Short-Term strong bullish price action can still prevail.
But please keep this big picture in mind from here on end.
Feel free to ask questions if anything is unclear.
I sincerely hope my point of view offers a valued insight.
Thank you for taking the time to study my analysis.
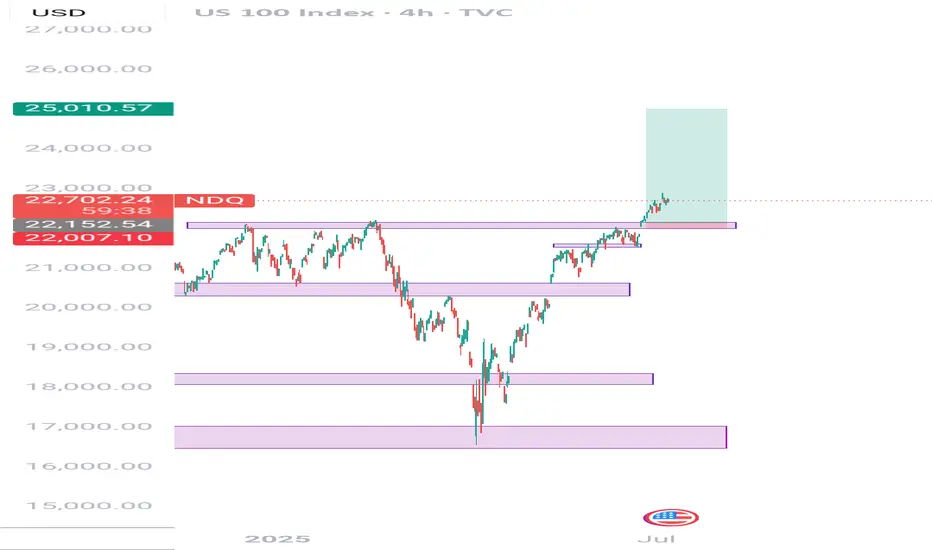
Long position idea on Nasdaq Simple and precise idea of Nasdaq. Bullish momentum in full swing. Nasdaq recently broke out of the previous High/Resistance and shows that the bulls are still in power. Take profit is at 25.000.00 because Nasdaq usually moves around 10.000 pips after a market crash so when doing my calculations from previous Low of 16300, my estimation is around 25000 which equals to 9,000 - 10,000 pips.
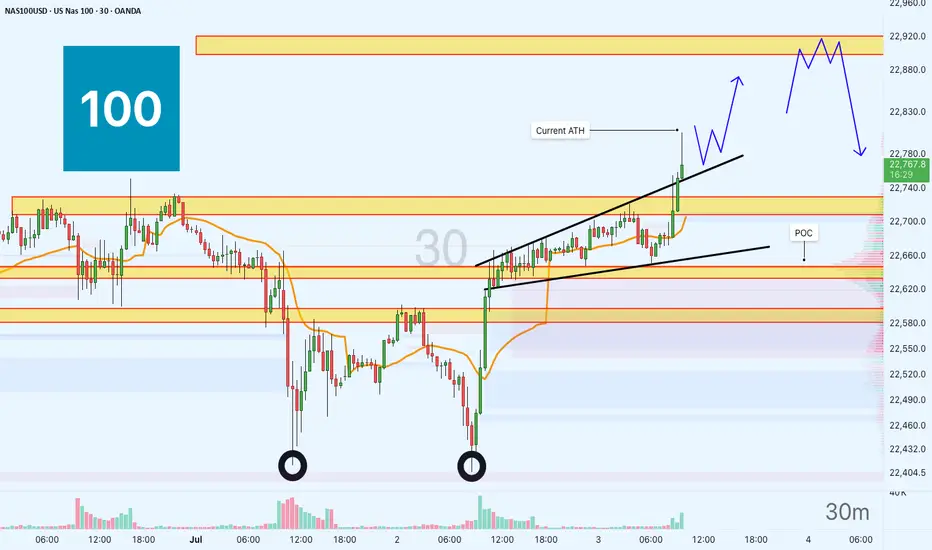
US100 — New ATH Trading SetupThe price recently previous ATH at the 22730 level. Current ATH is marked near 22,800, with a POC at 22,640.
Potential support around 22,500, below POC.
Watch for a bounce or further rise beyond 22,920.
Buyers probably will push right through 23,000 level today on Micros and Minis.
Bear signalsLooking for 22500 Im thinking. Banks trade the round numbers and the round numbers for nas are 125 point increments