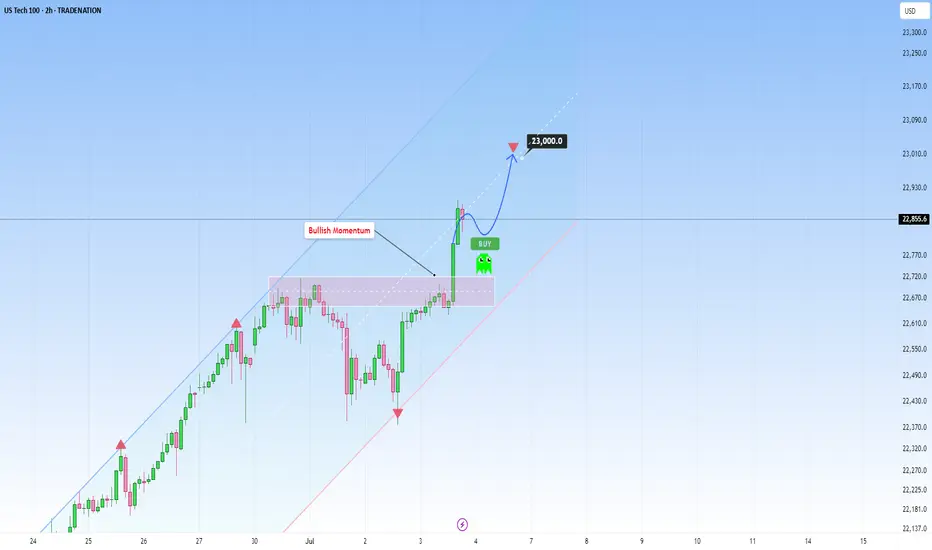
Nasdaq 100: Bearish Signals Near the All-Time HighNasdaq 100: Bearish Signals Near the All-Time High
As the 4-hour chart of the Nasdaq 100 (US Tech 100 mini on FXOpen) shows, the index reached a new all-time high last week. However, the price action suggests that the current pace of growth may not last.
Last week’s strong labour market data triggered a significant bullish impulse. However, the upward momentum has been entirely retraced (as indicated by the arrows).
The tax cut bill signed on Friday, 4 July, by Trump — which is expected to lead to a significant increase in US government debt — contributed to a modest bullish gap at today’s market open. Yet, as trading progressed during the Asian session, the index declined.
This suggests that fundamental news, which could have served as bullish catalysts, are failing to generate sustainable upward movement — a bearish sign.
Further grounds for doubt regarding the index's continued growth are provided by technical analysis of the Nasdaq 100 (US Tech 100 mini on FXOpen) chart, specifically:
→ a bearish divergence on the RSI indicator;
→ price proximity to the upper boundary of the ascending channel, which is considered resistance.
It is reasonable to suggest that the market may be overheated and that bullish momentum is waning. Consequently, a correction may be forming — potentially involving a test of the 22,100 level. This level acted as resistance from late 2024 until it was broken by strong bullish momentum in late June.
This article represents the opinion of the Companies operating under the FXOpen brand only. It is not to be construed as an offer, solicitation, or recommendation with respect to products and services provided by the Companies operating under the FXOpen brand, nor is it to be considered financial advice.
USTEC trade ideas
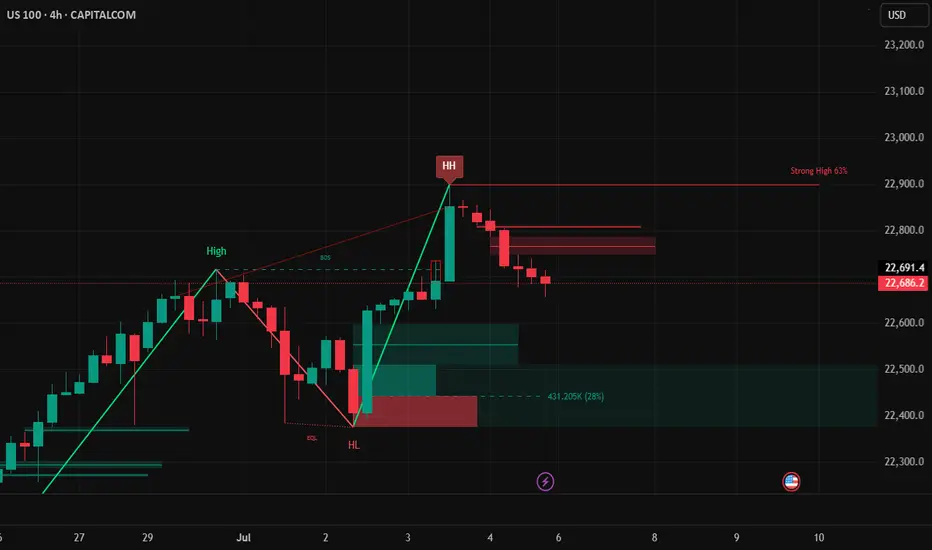
Nas Long to clear HH liquidity before correctionHTF Context – Monthly / Weekly / Daily
• Big Beautiful Bill (Trump Tax + Spending Bill)
o Passed July 4th, acting as a stimulus.
o Markets historically rally on fiscal stimulus expectations (tax cuts + spending packages).
o This fuels bullish sentiment short-term, but long-term raises debt, inflation risk, and rate hike concerns.
• Seasonality
o July is typically strong for equities, especially tech, with mid-July often marking local tops before August pullbacks.
• Monthly structure
o Strong bullish monthly candles.
o Next major fib retracements if rejected: 38.2% ~20,398, 50% ~19,625, 61.8% ~18,852.
• Weekly / Daily structure
o HH-HL sequence continues.
o Price in premium zone, approaching major supply block 23,200–23,300.
o Daily BOS not broken downwards yet.
________________________________________
Key Levels
• Major supply / liquidity magnet: 23,200–23,300 (sell-side OB in futures, uncollected liquidity above HH)
• Recent swing high: 22,900
• Daily pivot: 22,470
• Intraday demand zone: 22,450–22,350 (4H wedge base + VWAP)
• Weekly support shelf: 22,100–22,200 (if lost, major trend shift bearish)
________________________________________
My View – Most Likely Path
1. Price is likely to sweep the liquidity above recent highs into the 23,200–23,300 supply zone.
o Why? Market rarely leaves liquidity uncollected. This move traps breakout buyers and hits stops above HHs.
o Big Beautiful Bill fuels the final squeeze higher as algorithms price in fiscal stimulus.
2. After liquidity sweep above 23,200–23,300:
o Expect strong rejection from that zone.
o Institutions offload positions into trapped retail longs.
o Price pulls back towards daily and weekly support zones for reaccumulation.
3. Alternate scenario (less likely)
o Immediate sell-off from current levels without sweeping HH.
o Weak move; would still expect a revisit higher later to clear liquidity before a proper downtrend.
________________________________________
Trade Setups – Intraday & Swing
Intraday Long (Most Likely)
• Bias: Bullish continuation
• Entry Zone: 22,450–22,350 (4H demand + VWAP)
• Trigger: 5m/15m BOS up
• Stop: Below 22,300.
• Targets: First at 22,615, next at 22,845, final at 23,200–23,300.
________________________________________
Intraday Short (Countertrend / Liquidity Sweep Reversal)
• Bias: Short from supply after liquidity grab
• Entry Zone: 23,200–23,300
• Trigger: Sweep of HH with rejection wick or bearish engulfing candle
• Stop: Above 23,350 (structure invalidation).
• Targets: First at 22,845, then 22,600, extend to 22,450 if momentum accelerates.
________________________________________
Swing Long (Continuation)
• Bias: Bullish trend intact
• Entry: After retest of daily pivot (22,470) or 4H demand (22,350–22,450) with 4H CHoCH + BOS up.
• Stop: Below 22,200 (weekly support break invalidates).
• Targets: 22,845 then 23,200–23,300. Blue sky if above.
________________________________________
Swing Short (Only if structure breaks)
• Trigger: Daily close below 22,200
• Bias: Bearish trend shift
• Targets: 21,800 first, then 21,000 major fib cluster and weekly MA.
________________________________________
Summary – My Final Opinion
Price is in a strong uptrend fuelled by fiscal stimulus, rate cuts and tarrif hopes . I think it will sweep the liquidity above 23,200–23,300 before any deeper pullback or trend reversal. Any rejection from that supply zone will be the cue to short for a structural retracement. Until then, I’ll keep buying dips aligned with the HTF bullish structure.
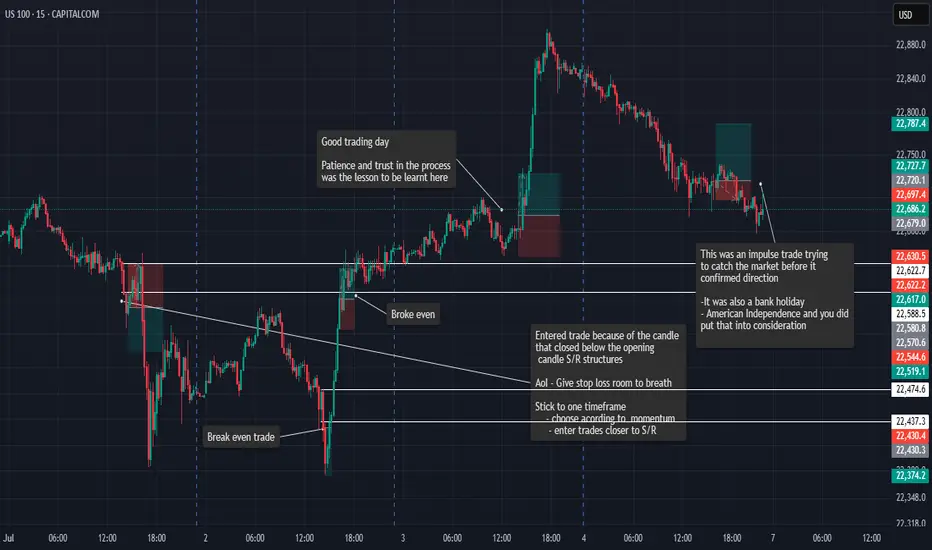
Last Weeks Trades and AnalysisWeek 1 - Trade reviews
This is a look back at the trades i tooks and the lessons taken from that day, More information is in my trading journal
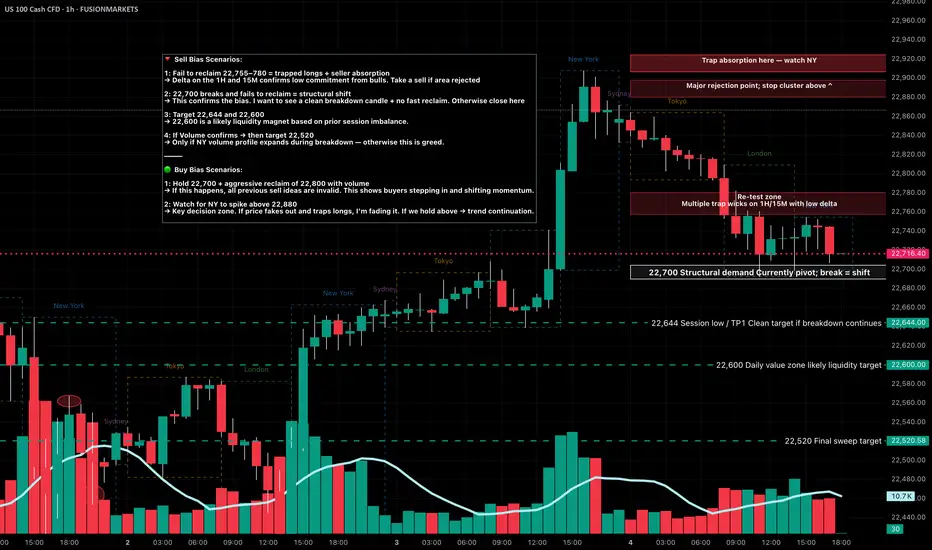
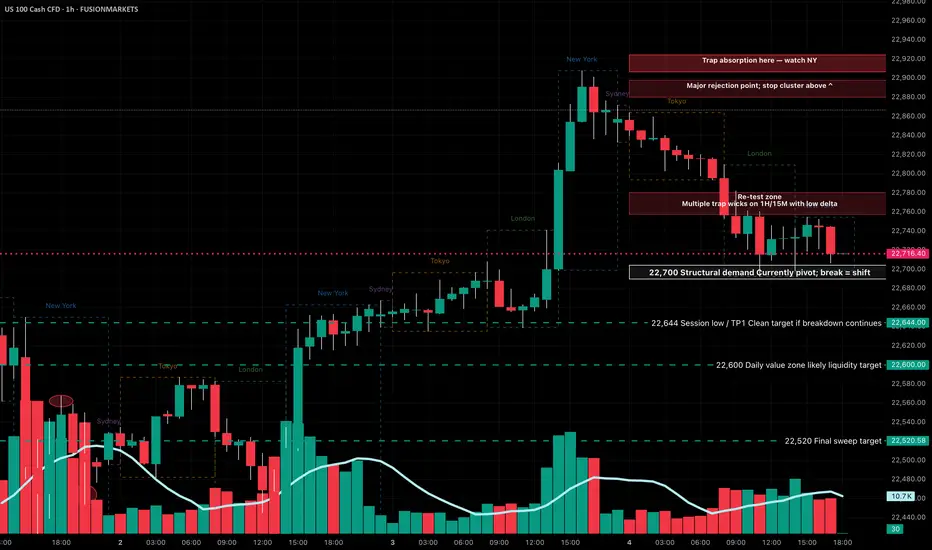
NASDAQ Key Levels July 7 2025If NY fails to reclaim 22,755–780 early in the week, expect a grind back toward 22,644 → 22,600, with 22,520 in play only if volume confirms. Reclaiming and holding above 22,800+ would invalidate this bearish setup.
Watch for trap volume, delta reversals, and volume imbalances at all key zones before entering.
22,880 – 🔻 Weekly wick top
➤ Major rejection zone with a stop cluster sitting above.
22,800–820 – Possible NY trap zone
➤ Trap absorption detected here on footprint — watch New York for rejection or breakout.
22,755–22,780 – Retest zone
➤ Multiple trap wicks with low delta on 1H/15M. Likely to bait breakout traders before fading.
22,700 – Structural demand / pivot point
➤ A clean break + hold below = bearish market shift.
22,644 – ✅ Session low / Take Profit 1
➤ If 22,700 breaks, this is the first clean downside target.
22,600 – Daily value zone
➤ High-probability liquidity target if selling extends below 22,644.
22,520 – Final sweep target
➤ Only likely if New York session sells off hard mid-to-late week.
NASDAQ Key Levels July 7 2025If NY fails to reclaim 22,755–780 early in the week, expect a grind back toward 22,644 → 22,600, with 22,520 in play only if volume confirms. Reclaiming and holding above 22,800+ would invalidate this bearish setup.
Watch for trap volume, delta reversals, and volume imbalances at all key zones before entering.
22,880 – 🔻 Weekly wick top
➤ Major rejection zone with a stop cluster sitting above.
22,800–820 – 🧱 Possible NY trap zone
➤ Trap absorption detected here on footprint — watch New York for rejection or breakout.
22,755–22,780 – 🔁 Retest zone
➤ Multiple trap wicks with low delta on 1H/15M. Likely to bait breakout traders before fading.
22,700 – ⚠️ Structural demand / pivot point
➤ A clean break + hold below = bearish market shift.
22,644 – ✅ Session low / Take Profit 1
➤ If 22,700 breaks, this is the first clean downside target.
22,600 – 🎯 Daily value zone
➤ High-probability liquidity target if selling extends below 22,644.
22,520 – 🧨 Final sweep target
➤ Only likely if New York session sells off hard mid-to-late week.
NASDAQ | - Structure Refined | Bullish Intent Into Next WeekPair: NAS100
Bias: Bullish
Timeframes: 4H, 2H, LTFs
• 4H broke structure to the upside with a new HH — clear sign of bullish intent stepping in.
• 2H gives clarity on the move — beginning of the week was messy, but price cleaned up nicely and gave us refined structure to work with.
• Now we wait for mitigation into the OB zone to see if price respects and gives us the setup.
🔹 Entry: After price mitigates OB and confirms with CHoCH on LTFs
🔹 Entry Zone: Marked OB zone — wait for confirmation
🔹 Target: Near structure highs — continuation if bulls step in
Mindset: Messy beginnings don’t mean bad outcomes. Structure eventually reveals the truth — just stay patient and ready.
Bless Trading!
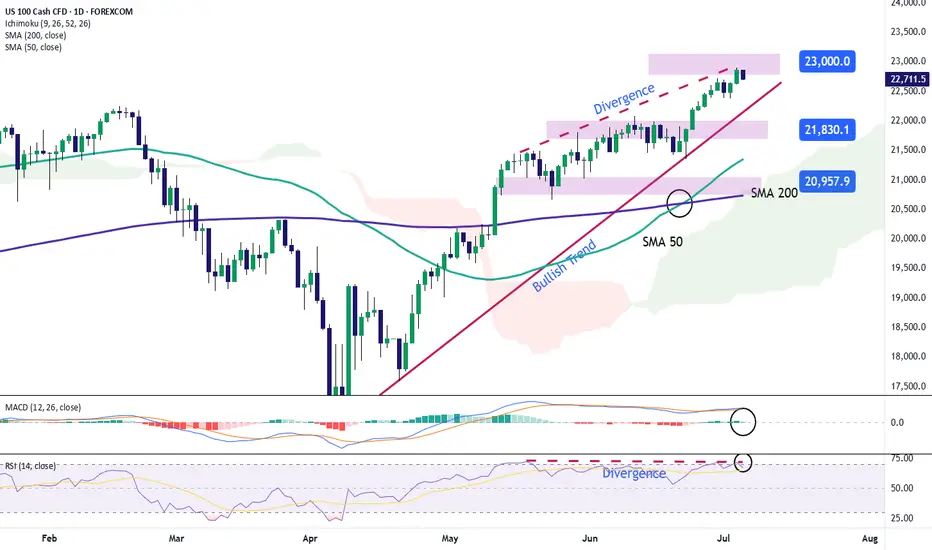
Nasdaq Approaches 23,000 Mark for the First TimeOver the past five trading sessions, the U.S. Nasdaq index has posted a gain of more than 1.5%, supported by a recent rise in market confidence that has pushed the equity index to new all-time highs. The NFP employment data released yesterday surprised markets with 147,000 new jobs, compared to the 111,000 expected, reflecting a recovery in the labor market that could ultimately support domestic consumption in the U.S.. This has helped maintain investor confidence in equities, supporting a bullish bias in the Nasdaq in recent sessions.
Sustained Uptrend
Since the early days of April, the Nasdaq has maintained a solid upward trend, with no relevant signs of selling pressure that would threaten the current bullish structure. As a result, the long-term bias remains clearly bullish within the broader market outlook. However, it's worth noting that a growing sense of indecision has emerged in recent sessions, reflected in the candlestick patterns, which could open the door to short-term bearish corrections.
Technical Indicators
MACD: The MACD histogram continues to hover around the neutral zero line, indicating a balance in moving average strength during recent sessions. If this pattern continues, it may result in a more defined period of price neutrality in the short term.
RSI: The presence of consistent RSI highs, alongside higher price highs in the Nasdaq, has led to the formation of a bearish divergence. This suggests that market equilibrium has been affected by recent bullish momentum, and could lead to price pullbacks in the upcoming sessions.
Key Levels to Watch:
23,000 – Psychological barrier: A tentative resistance level in the short term due to the lack of clear technical references. A breakout above this level could reinforce the current bullish bias and signal a more sustained upward trend.
21,800 – Nearby support: An area aligned with a recent neutral technical zone, which may act as relevant support in the event of a short-term pullback.
21,000 – Key support: A level that coincides with the 50-period simple moving average. A break below this level could put the current bullish structure at risk and pave the way for a more significant downward move.
Written by Julian Pineda, CFA – Market Analyst
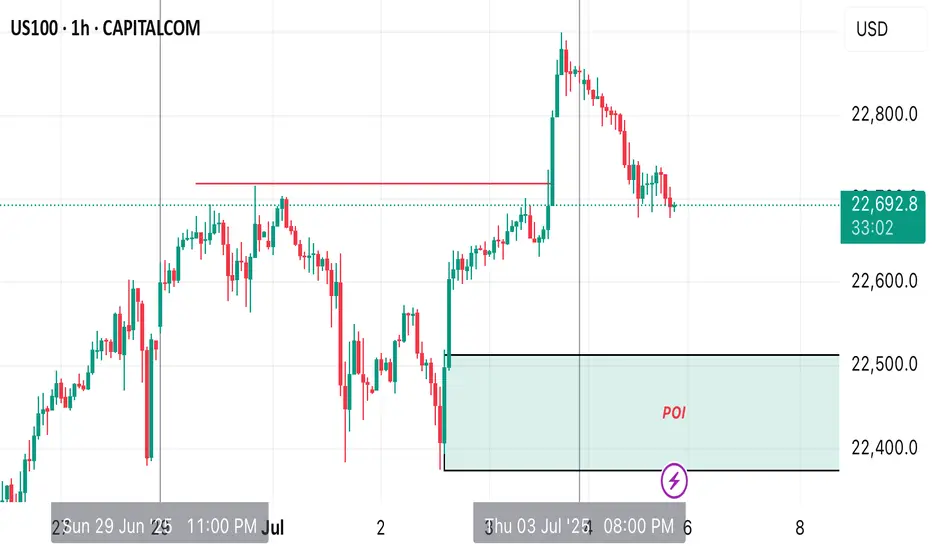
US100 MARKET OUTLOOK - H1Price is strongly bullish in monthly, weekly and daily but we’re currently seeing a retrace in H1 timeframe. we’re going to see price tap into our H1 point of interest .
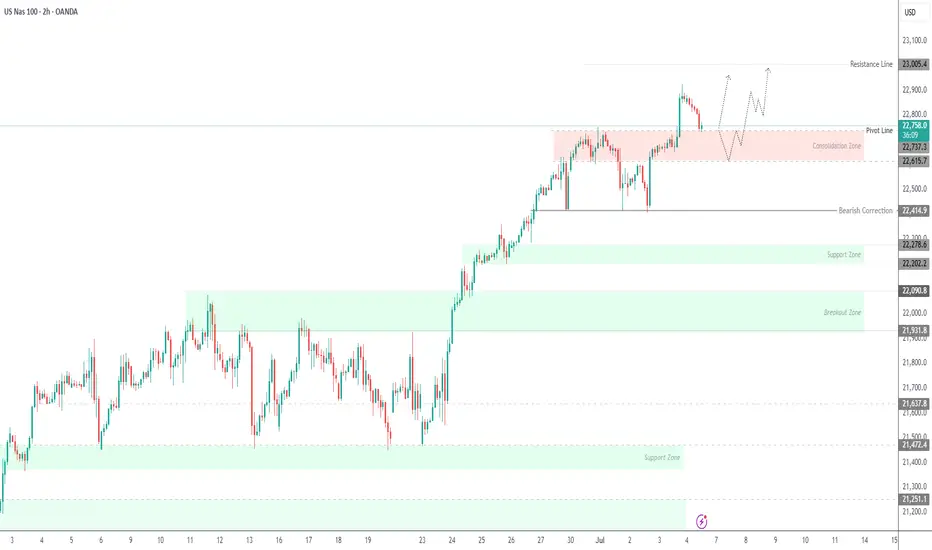
USNAS100 Key Level: 22,740 – Will the Trend Continue or Reverse?USNAS100 Update – Bullish Momentum Holds Above 22,740
USNAS100 has continued to push higher, following through as expected from yesterday’s analysis.
The index maintains bullish momentum as long as it trades above the key pivot at 22,740.
However, a 1H close below 22,730 could trigger a bearish correction toward 22,615.
A sustained break below that level may shift the trend to bearish.
Key Levels:
• Resistance: 22,870 / 23,000
• Support: 22,615 / 22,410
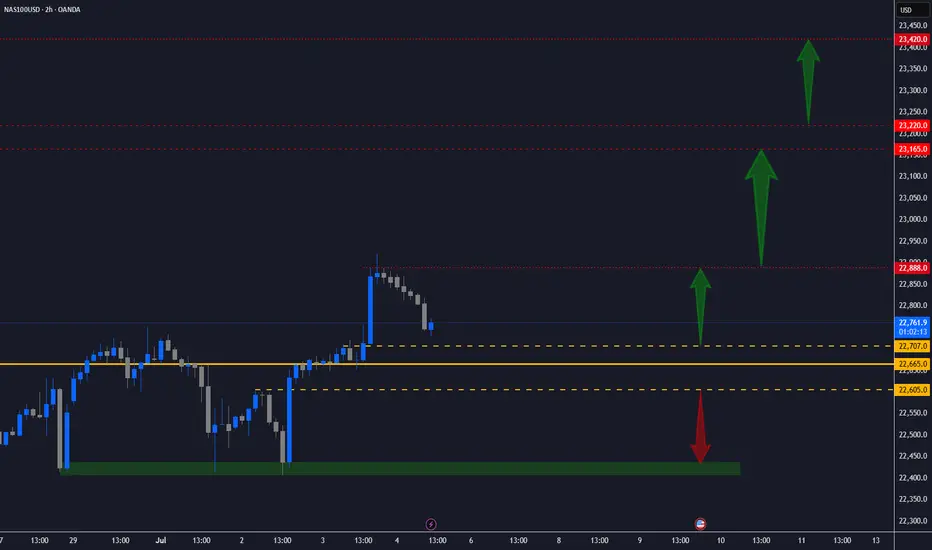
NAS100 UPDATE - Potential Targets Dear Friends in Trading,
How I see it,
Key Support / Pivot @ 22665.00
If key support holds, bullish rally can potentially remain intact
A strong breach below 22605.00, can potentially force
price back to original demand.
I sincerely hope my point of view offers a valued insight.
Thank you for taking the time to study my analysis.
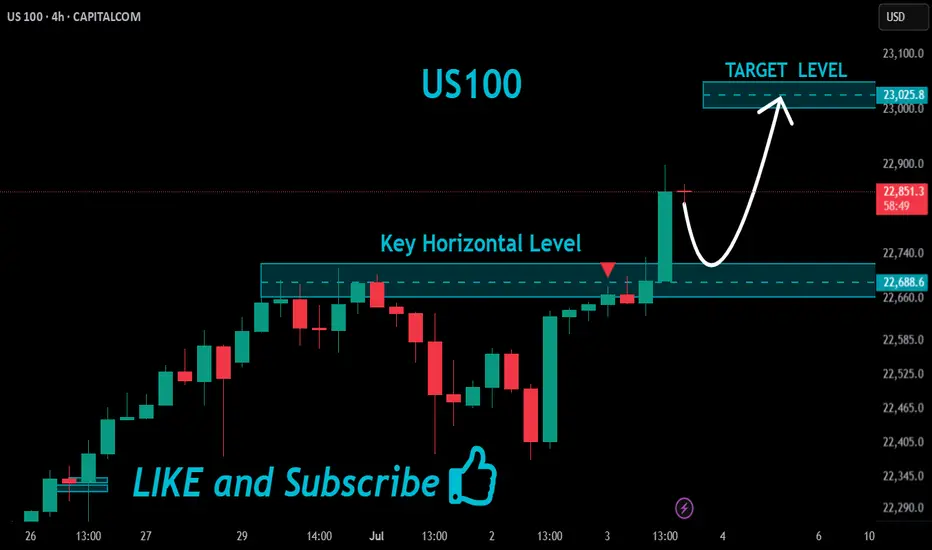
US100 rises sharply, with further upside target of 23,000At this stage, US100 continues to ride a dominant ascending channel structure, maintaining a consistent bullish structure supported by strong fundamentals as well as technical positioning.
The current price action reflects a high-confidence trend environment, underpinned by steady economic resilience in the U.S. tech sector and growing investor optimism surrounding AI-driven growth and corporate earnings. This alignment between structure and sentiment reinforces the strength of the current trend.
What’s especially encouraging is how the price has remained in the upper half of the ascending channel. Every corrective move has been shallow and absorbed quickly as well. This kind of behavior is exactly what you want to see in a strong trend.
From a structural perspective, the recent break of the prior swing high confirmed a bullish break of structure (BOS), reinforcing the broader uptrend. That’s a meaningful move, not just technically, but also psychologically, as it validates that bullish momentum remains intact and market participants are still positioning for higher levels.
No signs of weakness are showing up yet. If anything, the structure is intact and there’s no evidence of a shift in momentum. This makes it a good opportunity for traders who are "late to the party" to consider entering, as the trend still looks strong and continuation is likely.
As for upside targets, the 23,000 level is a natural extension. It aligns with the middle of the channel and fits within the current rate of expansion. If we don’t see any warning signs (like impulsive bearish candles), this target remains both technically justified and psychologically relevant.
Just sharing my thoughts on support and resistance, this isn’t financial advice. Always confirm your setups and manage your risk properly.
Disclosure: I am part of Trade Nation's Influencer program and receive a monthly fee for using their TradingView charts in my analysis.
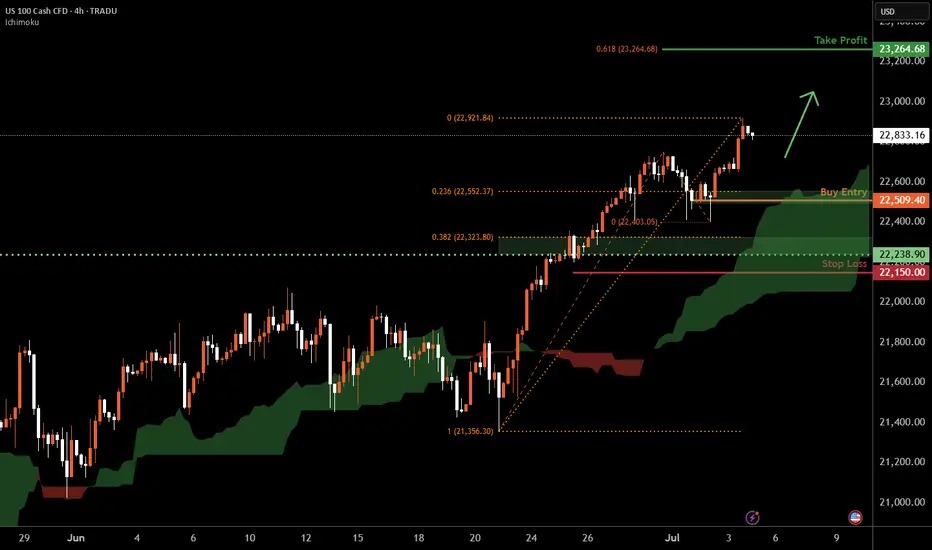
Nasdaq-100 H4 | Bullish uptrend to extend higher?The Nasdaq-100 (NAS100) is falling towards a swing-low support and could potentially bounce off this level to climb higher.
Buy entry is at 22,509.40 which is a swing-low support that aligns closely with the 23.6% Fibonacci retracement.
Stop loss is at 22,150.00 which is a level that lies underneath an overlap support and the 38.2% Fibonacci retracement.
Take profit is at 23,264.68 which is a resistance that aligns with the 61.8% Fibonacci projection.
High Risk Investment Warning
Trading Forex/CFDs on margin carries a high level of risk and may not be suitable for all investors. Leverage can work against you.
Stratos Markets Limited (tradu.com ):
CFDs are complex instruments and come with a high risk of losing money rapidly due to leverage. 63% of retail investor accounts lose money when trading CFDs with this provider. You should consider whether you understand how CFDs work and whether you can afford to take the high risk of losing your money.
Stratos Europe Ltd (tradu.com ):
CFDs are complex instruments and come with a high risk of losing money rapidly due to leverage. 63% of retail investor accounts lose money when trading CFDs with this provider. You should consider whether you understand how CFDs work and whether you can afford to take the high risk of losing your money.
Stratos Global LLC (tradu.com ):
Losses can exceed deposits.
Please be advised that the information presented on TradingView is provided to Tradu (‘Company’, ‘we’) by a third-party provider (‘TFA Global Pte Ltd’). Please be reminded that you are solely responsible for the trading decisions on your account. There is a very high degree of risk involved in trading. Any information and/or content is intended entirely for research, educational and informational purposes only and does not constitute investment or consultation advice or investment strategy. The information is not tailored to the investment needs of any specific person and therefore does not involve a consideration of any of the investment objectives, financial situation or needs of any viewer that may receive it. Kindly also note that past performance is not a reliable indicator of future results. Actual results may differ materially from those anticipated in forward-looking or past performance statements. We assume no liability as to the accuracy or completeness of any of the information and/or content provided herein and the Company cannot be held responsible for any omission, mistake nor for any loss or damage including without limitation to any loss of profit which may arise from reliance on any information supplied by TFA Global Pte Ltd.
The speaker(s) is neither an employee, agent nor representative of Tradu and is therefore acting independently. The opinions given are their own, constitute general market commentary, and do not constitute the opinion or advice of Tradu or any form of personal or investment advice. Tradu neither endorses nor guarantees offerings of third-party speakers, nor is Tradu responsible for the content, veracity or opinions of third-party speakers, presenters or participants.
LONG NASDAQ50% Monthly candle breakout
50% Weekly ob
50% Candle weekly
Fibonacci retracement to golden ratio 61.8 TO 79%
Break out of a London high .
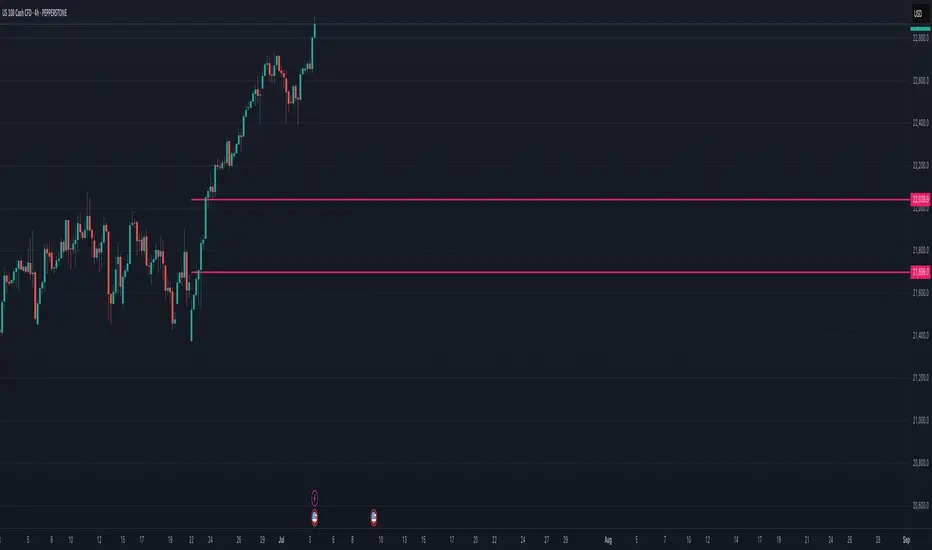
US100 Very Strong Uptrend!
HI,Traders !
#US100 is trading in a
Very strong uptrend and
broke a key horizontal
Level around 22688.6 which
Is now a support and we
Are already seeing a rebound
So we are bullish biased
And we will be expecting
A further move up !
Comment and subscribe to help us grow !
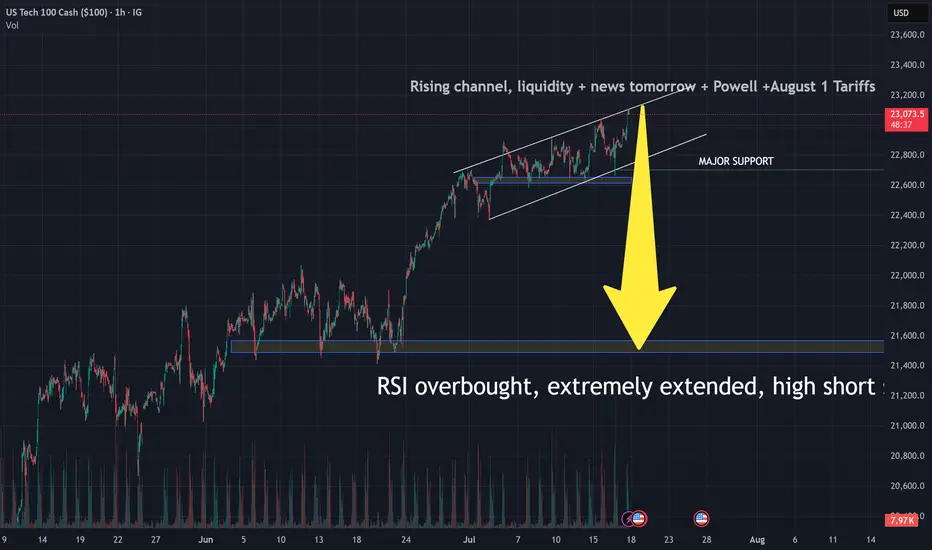
NASDAQ Outlook – Coming WeeksIn the coming weeks, we may see a potential downward move in the NASDAQ, provided that it fails to hold above the current level at 23,100.
If the index remains unstable below this level, a sharp decline toward the 22,800 zone is likely.
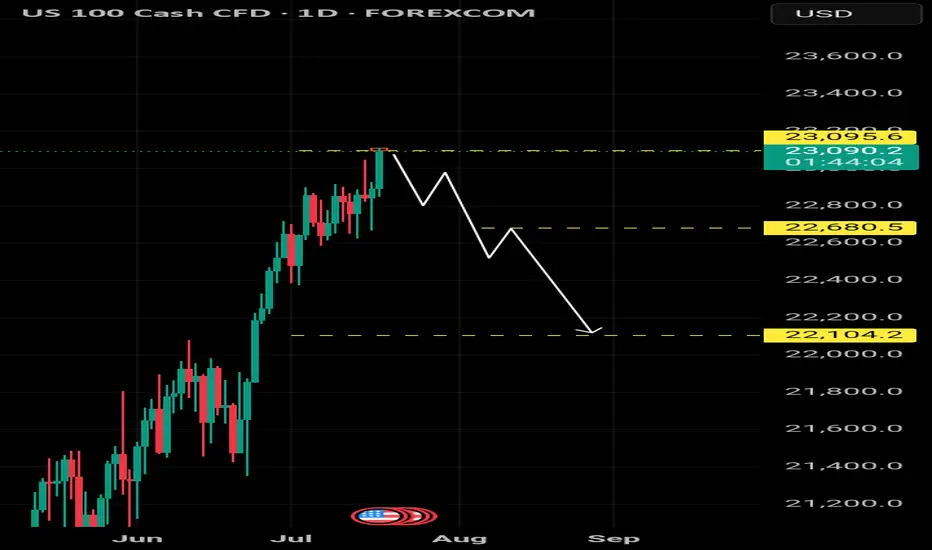
NASDAQ will fall to 21500 until August 1Nearly all Indicators, Geopolitics, uncertainties, Trade Tariffs, Powell vs Trump- tell us to sell, marking a bearish perception on Stock Market. Although your right analysis to sell is still bougt by super fast algorithms, there are facts that neither investors nor programms can ignore, and they are about to come. If housing market stambles tomorrow, which, probably, will be the fact, it will be the first step towards this deep dive. Wish us all profitable trading. Remember, it is not about being right or wrong, it is about making money, so even if you are wrong-dont compete with your own money against you, stay focused falks. See ya.
NAS100 (CASH100) SHORT - Double Top H8Risk/reward = 4.6
Entry price = 23 063
Stop loss price = 23 190
Take profit level 1 (50%) = 22 635
Take profit level 2 (50%) = 22 303
Still waiting for confirmation on some variables.
For example, need H8 candle to close in range and volume to validate, amongst other variables.
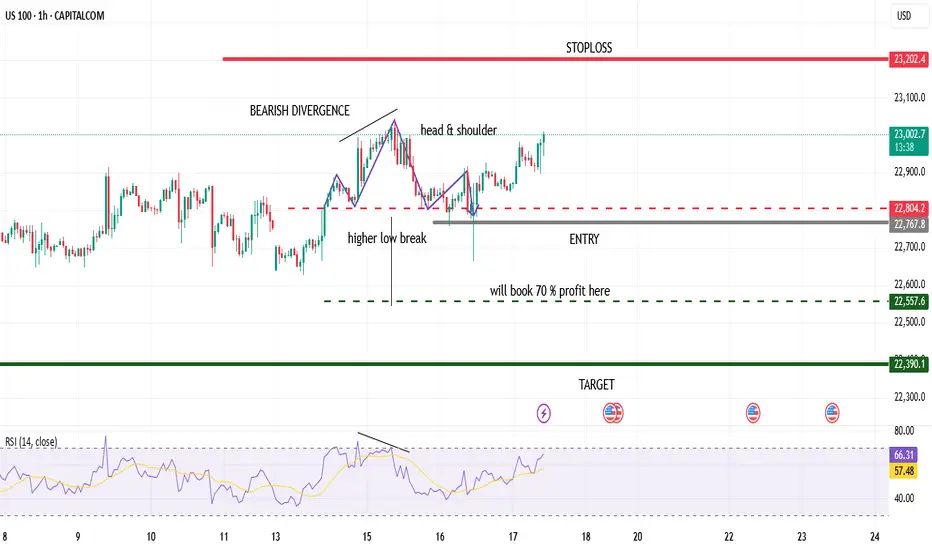
US 100 ShortUS 100 short
1st us100 formed bearish divergence
then break last higher low
also formed bearish head & shoulder
DXY index is bullish it also indicates for bearish stock
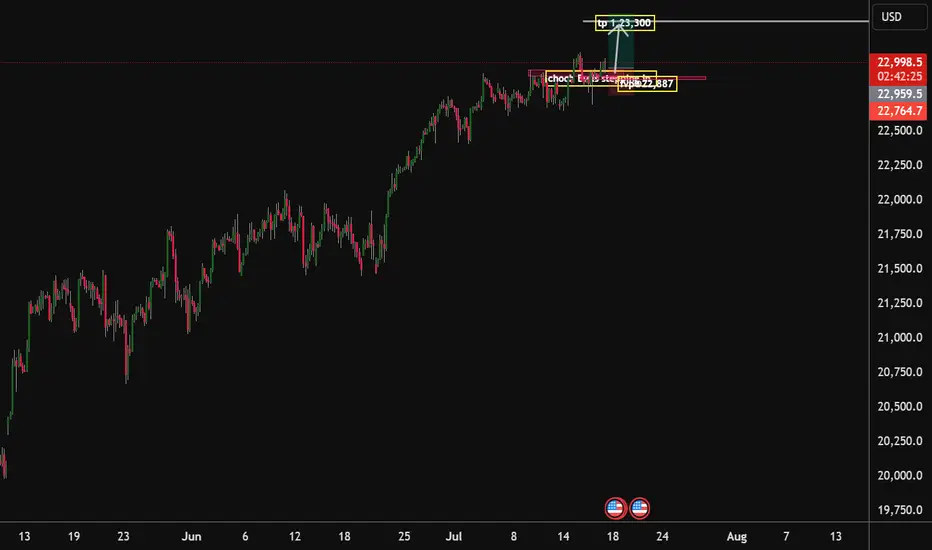
Nasdaq100 Bulls ready to drive the price to 23,300 handle With the choch on the market structure and with Key data released on Thursday, reflected strength in the U.S. economy. Stocks rose this Thursday, buoyed by fresh economic data reports and a slew of corporate earnings releases. The tech-heavy Nasdaq Composite has advanced 0.4%, and quarterly earnings reports released this week have exceeded Wall Street’s expectations, fueling investor confidence. I am expecting that by the end of this week or the beginning of next week will see the bulls drive the market to our 23,300 handle. I am with the bulls on this one
Tp1.23,300.
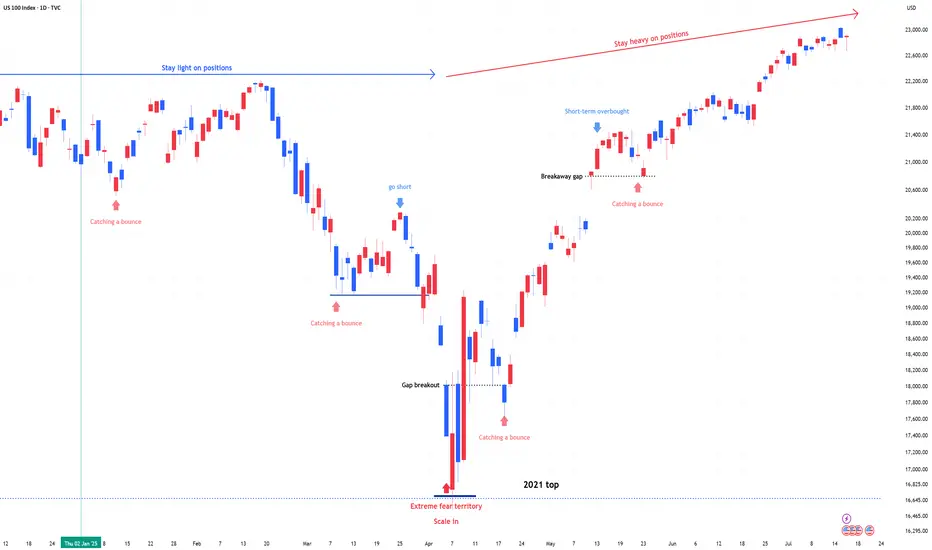
US 100 (NDQ) : Stay Heavy on Positions1) April Fear & Buy Signals
In early April, the Nasdaq 100 experienced a sharp sell-off, triggering extreme fear sentiment across the market.
At that point, scale-in buy signals appeared—classic "buy the fear" conditions.
2) Current Market State: No More Fear, but Watching
Since then, the market has stabilized.
The fear has disappeared, but we are still in a wait-and-see mode as traders assess the next move.
Momentum is holding, but participation remains cautious.
3) Stay Heavy on Positions
Despite short-term uncertainty, I’m maintaining an overweight position on the Nasdaq 100.
As long as we don’t see a major breakdown, the bias remains bullish.
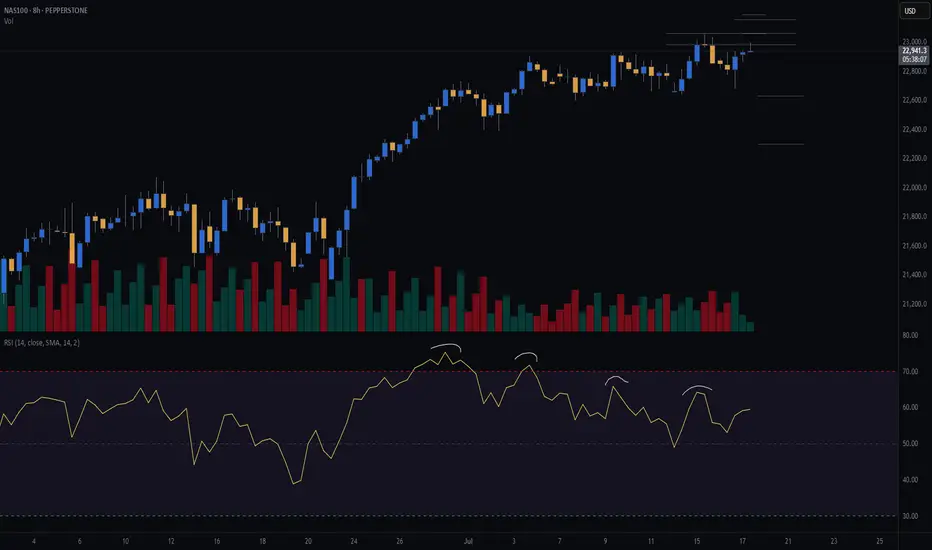
NAS100 - Follow Progress 3Dear Friends in Trading,
How I see it,
Remember:
"NASDAQ IS IN EXTREME GREED/OVERBOUGHT TERRITORY"
1) NASDAQ formed new key support/demand levels post CPI + PPI
2) Price needs to stabilize above 23046 next.
3) As long as both key support levels hold, the potential for more
bull runs remains high.
I sincerely hope my point of view offers a valued insight.
Thank you for taking the time to study my analysis.
Trade, Fed, and Policy Developments Impacting NASDAQ 100Tariff Expansion Threat:
Donald Trump signaled upcoming tariffs on pharmaceuticals and semiconductors, two sectors heavily represented in the NASDAQ 100. These measures could:
Raise consumer costs.
Disrupt tech and healthcare supply chains.
Add margin pressure on multinational firms.
Corporate Impact:
Rio Tinto revealed $300M in losses from US aluminum tariffs on Canadian output.
Canada-US trade talks will intensify, but tariffs appear likely to remain, adding to cost overhang for manufacturers and downstream users.
Fed Leadership Uncertainty:
Kevin Hassett is emerging as the frontrunner to replace Fed Chair Jerome Powell in 2026.
Trump is critical of Powell, even citing Fed building renovation costs as a potential fireable offense.
This adds uncertainty to monetary policy continuity, especially as inflation rises and rate path expectations diverge.
401(k) and Private Equity Access:
The administration is finalizing an executive order allowing 401(k) plans to invest in private equity, a move that could:
Increase alternative asset exposure.
Boost private market valuations.
Signal a policy tilt toward financial market liberalization, which may help sustain risk sentiment in the medium term.
Conclusion for NASDAQ 100 (NSDQ100) Trading
The near-term risk for NASDAQ 100 is tilted negative due to the tariff threats on semiconductors and pharma, both major index components.
Fed leadership uncertainty could inject volatility into rate expectations, pressuring tech valuations sensitive to discount rate changes.
However, the longer-term policy shift toward broader 401(k) access to private markets could support overall market sentiment and capital flows.
Bias: Cautiously Bearish in the short term due to trade and Fed risks; neutral to slightly bullish medium term if private capital access reforms proceed and trade escalation is contained.
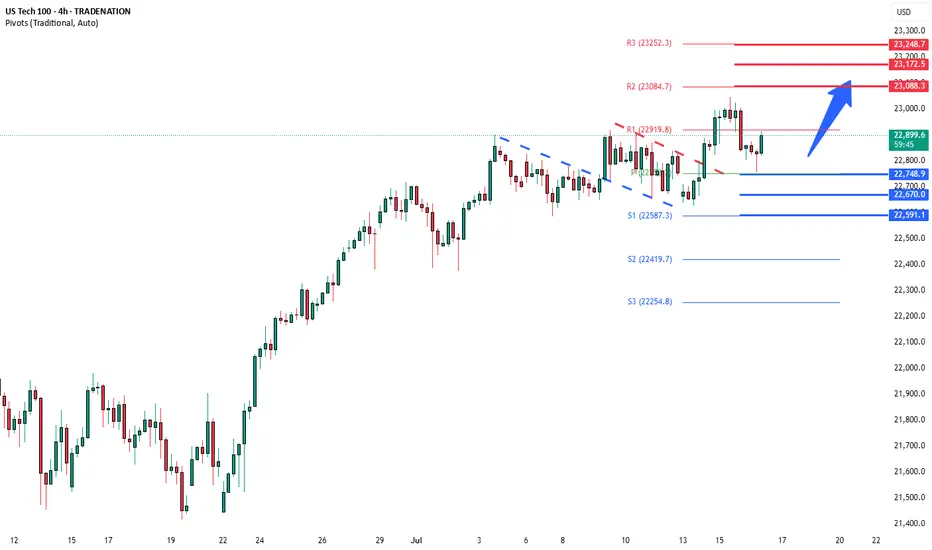
Key Support and Resistance Levels
Resistance Level 1: 23080
Resistance Level 2: 23170
Resistance Level 3: 23250
Support Level 1: 22750
Support Level 2: 22670
Support Level 3: 22590
This communication is for informational purposes only and should not be viewed as any form of recommendation as to a particular course of action or as investment advice. It is not intended as an offer or solicitation for the purchase or sale of any financial instrument or as an official confirmation of any transaction. Opinions, estimates and assumptions expressed herein are made as of the date of this communication and are subject to change without notice. This communication has been prepared based upon information, including market prices, data and other information, believed to be reliable; however, Trade Nation does not warrant its completeness or accuracy. All market prices and market data contained in or attached to this communication are indicative and subject to change without notice.