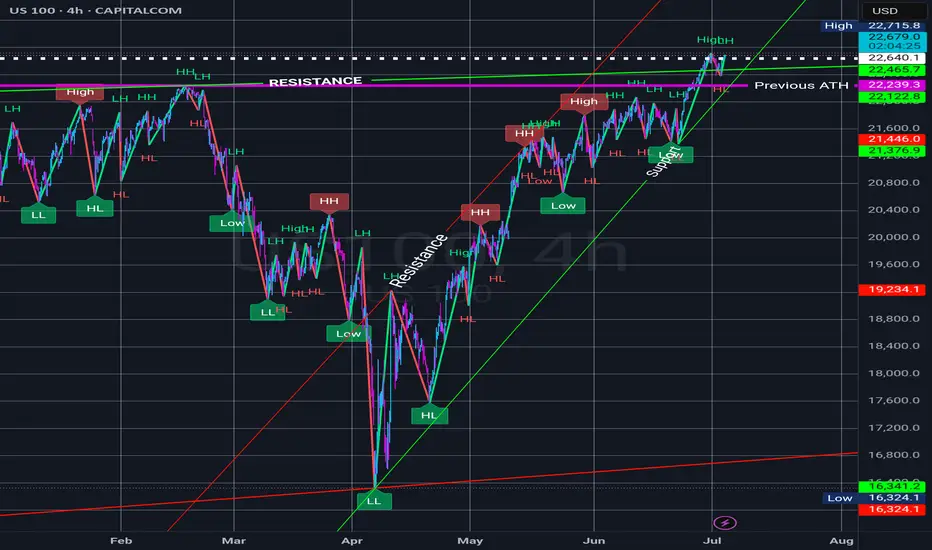
Nasdaq ready for pullback??Hi Guys,
The US indices have been ripping back to all time highs without any meaningful pullbacks from the lows.
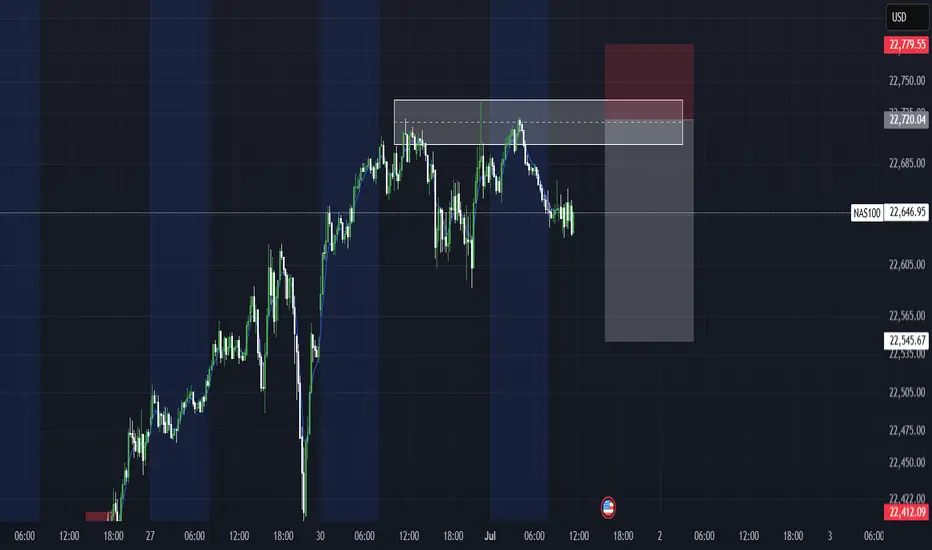
The Nasdaq is approaching a price level where we may see a pullback and some selling pressure.
The shaded box above the chart is that area and it contains two important fib levels. The bottom of the box is the 1.13 retracement of the recent high to the low after the tarrif news. The black line drawn through the box is the 2.0 retracement of the bear market high to low. This level is always important but it is more significant in this case because the SP 500 and Dow Jones both had the big drops from pretty much exactly this level. The Nasdaq failed to reach this level so if the other two indices are anything to go by we may see some selling here.
Daily RSI is showing divergence. Sell setups using break of structure chart pattern and candlestick patterns on lower time frame could result in nice risk to reward trades.
The red line coming from the bottom is the AVWAP and its no coincidence that it is in line with a n obvious support area should we get a deep enough pullback.
Safe Trading all
USTEC trade ideas
NAS100 SHORTElite Strategy.
Price at structured liquidity.
Targeting lower liquidity pools, lower structured liquidity zone.
Executed off the 10 minute time frame.
Clear uptrend continuation to 23000+As you can see. We are ascending. All details on chart.
Beware of over leveraged trades. Shorts especially.
NASDAQ:TQQQ NASDAQ:QQQ SKILLING:US100
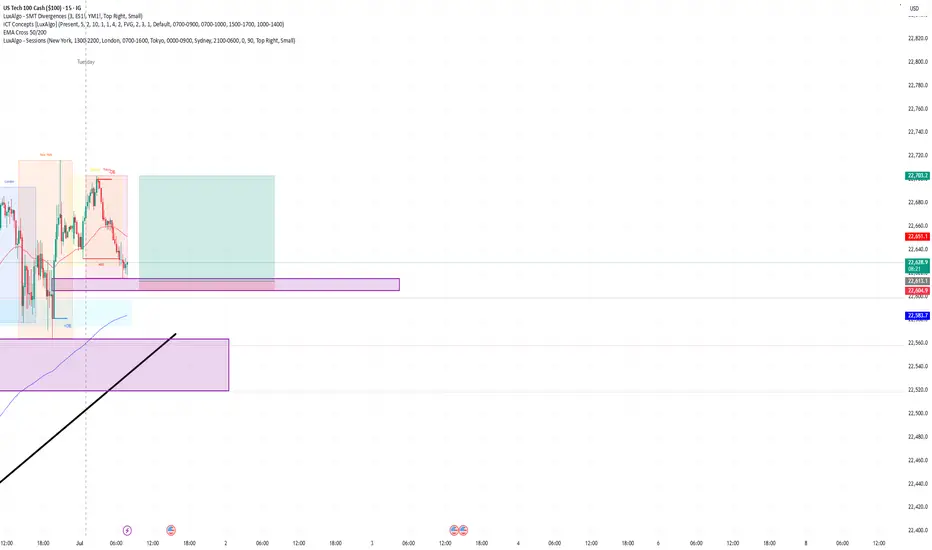
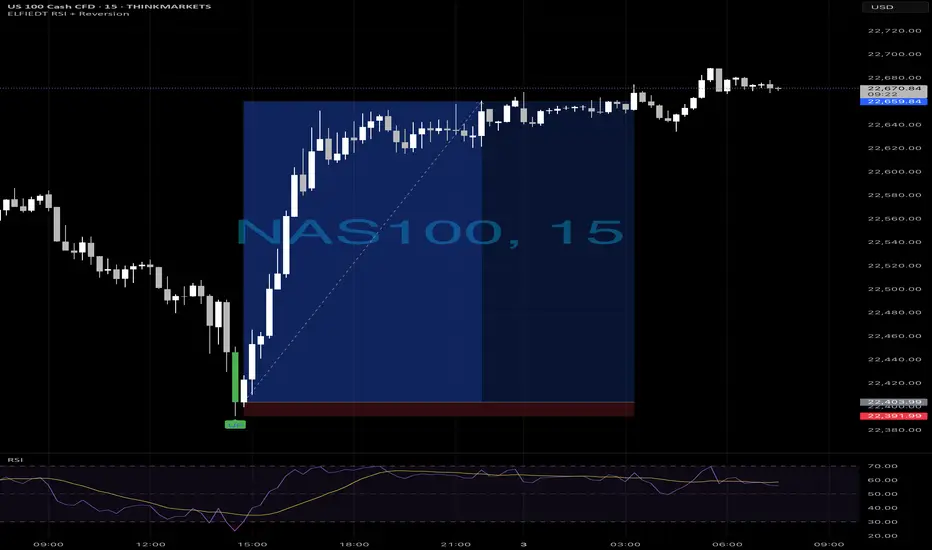
Ustec - longs📈 NAS100 Long Reversal — Powered by ELFIEDT RSI + Reversion Indicator
Timeframe: 15-min
Instrument: NAS100 (US Tech 100)
⸻
✅ Signal Setup (Long Entry)
This clean reversal was captured using my custom ELFIEDT RSI + Reversion indicator, which detects:
• RSI-based exhaustion conditions
• Precise reversal signals (green “UP” label on the chart)
• Trend-aligned confirmations
⸻
📌 Entry Criteria:
1. Oversold RSI conditions signaled potential exhaustion of the downtrend.
2. A clear bullish reversal candle closed with confirmation from the indicator.
3. The “UP” label marked the ideal entry candle just before the impulsive breakout.
4. RSI momentum shifted positively at the point of signal.
⸻
🎯 Execution Plan:
• Entry: At close of the signal candle with the “UP” label
• Stop-Loss: Placed just below the recent swing low (see red zone on chart)
• Target: Up to previous intraday structure and recovery zone
⸻
💡 Key Observations:
• Early signal allowed high RR entry before breakout
• RSI structure confirmed direction shift
• Strong sustained price action into close
⸻
📚 Learn More:
This trade is part of a larger system combining:
• RSI signal dynamics
• Momentum shift detection
• Session and structure alignment
If you’d like more information about the indicator or how to use it in your own strategy, feel free to follow or reach out.
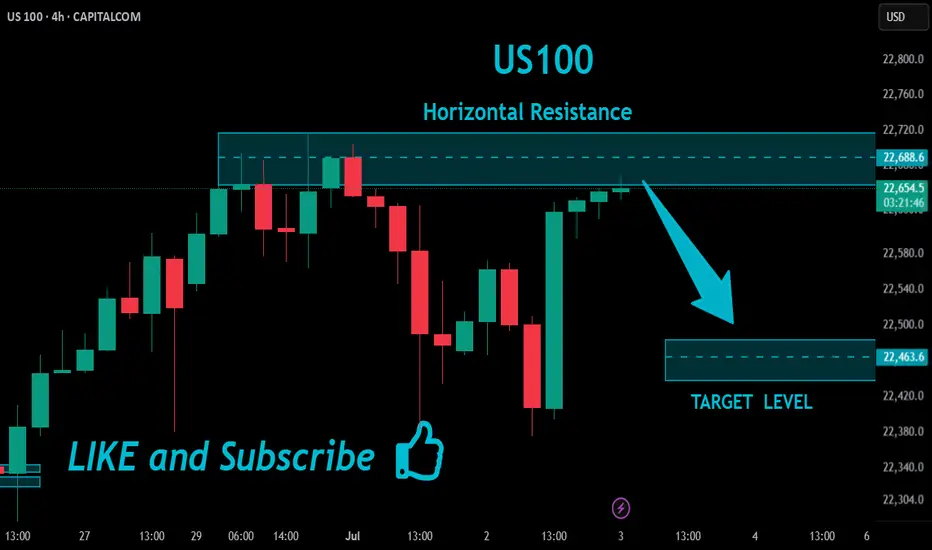
US100 Will Go Down!
HI,Traders !
#US100 made a retest
Of the wide horizontal
Resistance around 22688.6
And we are already seeing a
Local bearish reaction so
We will be expecting a
Further bearish move down !
Comment and subscribe to help us grow !
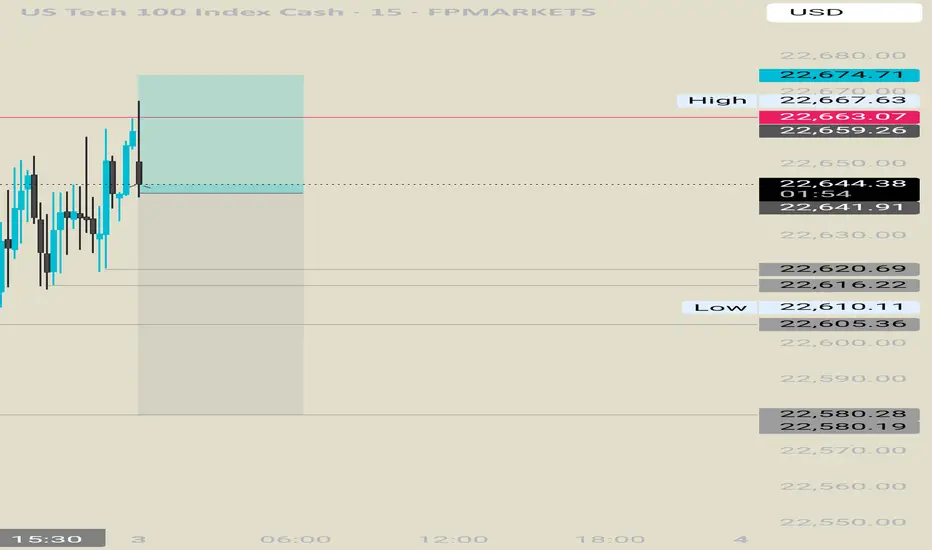
Nasdaq shortI think it is time to take the lows on the lower time frame.
Time for a small reversal.
1min entry and bos .
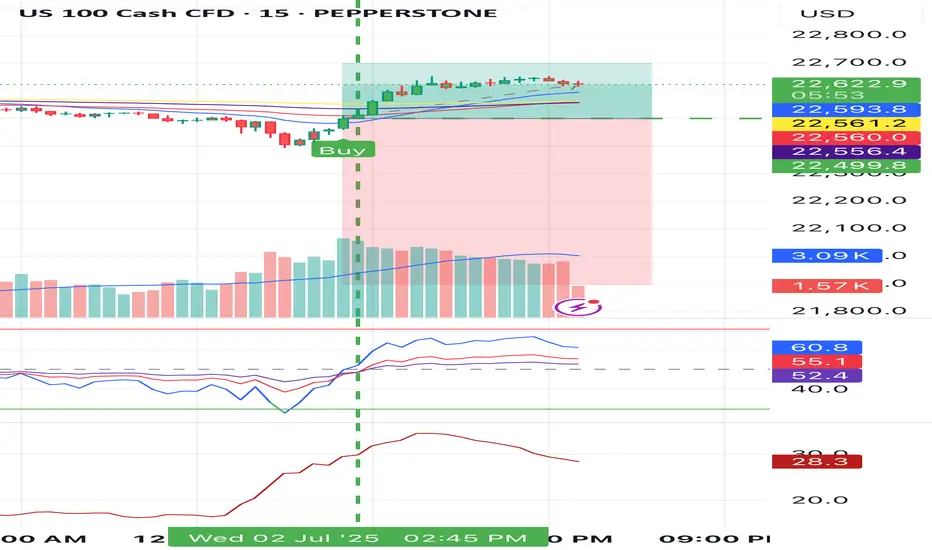
#NAS100 Buy 22499.8#NAS100 Buy 22499.8
SL 21899.8
TP 22699.8
TP 23499.8
TP 24899.8
Trade at your own risk
Protect your capital
The Wizard 🧙♂️ SWFX
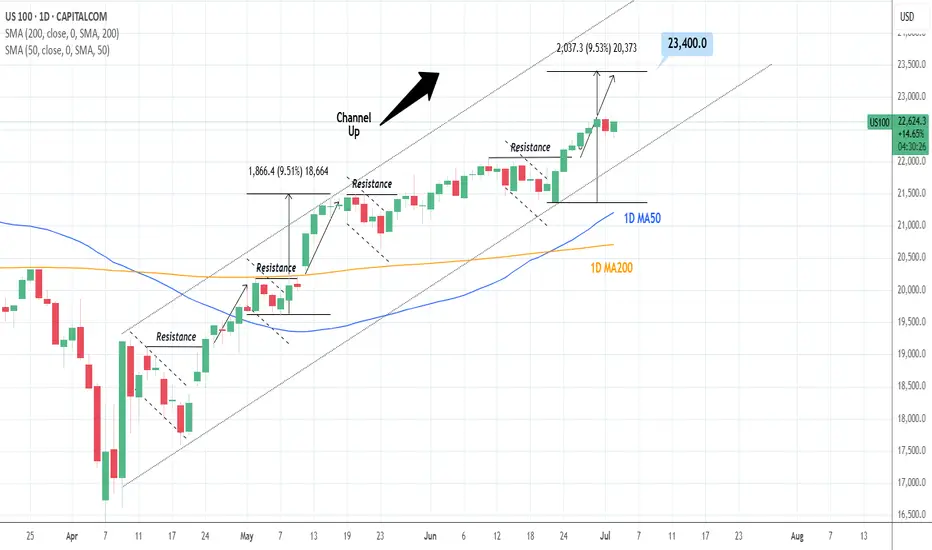
NASDAQ: Almost overbought but with no stop on this uptrend.Nasdaq is about to turn overbought on its 1D technical outlook (RSI = 68.420, MACD = 402.410, ADX = 22.800) but the current bullish wave shows no signs of stopping yet. The Channel Up since the April bottom indicates that a +9.50% rise is very likely before the next technical pullback, especially as long as the 1D MA50 is holding. Stay long, TP = 23,400.
## If you like our free content follow our profile to get more daily ideas. ##
## Comments and likes are greatly appreciated. ##
ICTTrading foreign currencies can be a challenging and potentially profitable opportunity for investors. However, before deciding to participate in the Forex market, you should carefully consider your investment objectives, level of experience, and risk appetite. Most importantly, do not invest money you cannot afford to lose.
There is considerable exposure to risk in any foreign exchange transaction. Any transaction involving currencies involves risks including, but not limited to, the potential for changing political and/or economic conditions that may substantially affect the price or liquidity of a currency. Investments in foreign exchange speculation may also be susceptible to sharp rises and falls as the relevant market values fluctuate. The leveraged nature of Forex trading means that any market movement will have an equally proportional effect on your deposited funds. This may work against you as well as for you. Not only may investors get back less than they invested, but in the case of higher risk strategies, investors may lose the entirety of their investment. It is for this reason that when speculating in such markets it is advisa

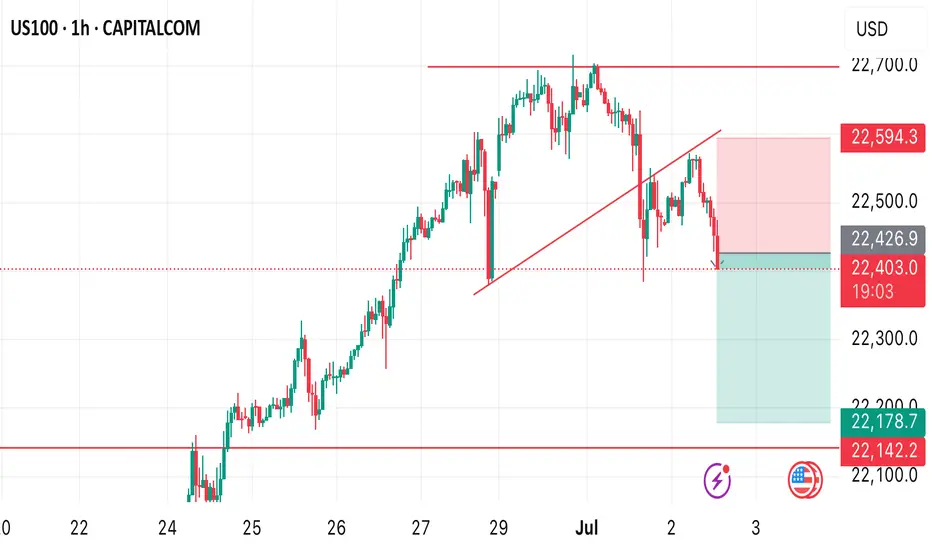
US100 POSSIBLE SELL OPPORTUNITY!!We’re going to see a possible sell opportunity on US100 from the current market price. SL 22594 take profit at 22178
NSDQ100 lower after ADP Employment shrank to 33K in JuneTrump Trade Tensions:
Donald Trump reaffirmed his July 9 deadline for higher tariffs, intensifying criticism of Japan, particularly over auto sector issues. While Japan insists talks are in good faith, market fears of a breakdown are rising.
US Tax Policy in Focus:
Trump’s “Big Beautiful” tax and spending bill faces potential resistance in the House despite narrowly passing the Senate. The proposal’s scale and political friction are drawing investor attention.
Apple Supply Chain Worry:
Foxconn has pulled hundreds of Chinese staff from its Indian iPhone factories, sparking fresh concerns about Apple’s supply chain and Wall Street’s potentially overheated tech optimism.
Paramount Settlement:
Paramount resolved a lawsuit with Trump over alleged election interference via CBS’s coverage. Meanwhile, the company awaits FCC approval for its Skydance merger.
Auto Sector Weakness:
Stellantis reported a 10% drop in U.S. Q2 deliveries despite some brand gains. Tesla is expected to post a 12% annual decline in vehicle deliveries, reinforcing signs of cooling demand in the sector.
Conclusion:
Markets remain cautious but resilient amid political tensions, supply chain disruptions, and weaker auto sales. Attention is now turning to upcoming trade deadlines, policy decisions, and Q2 corporate results.
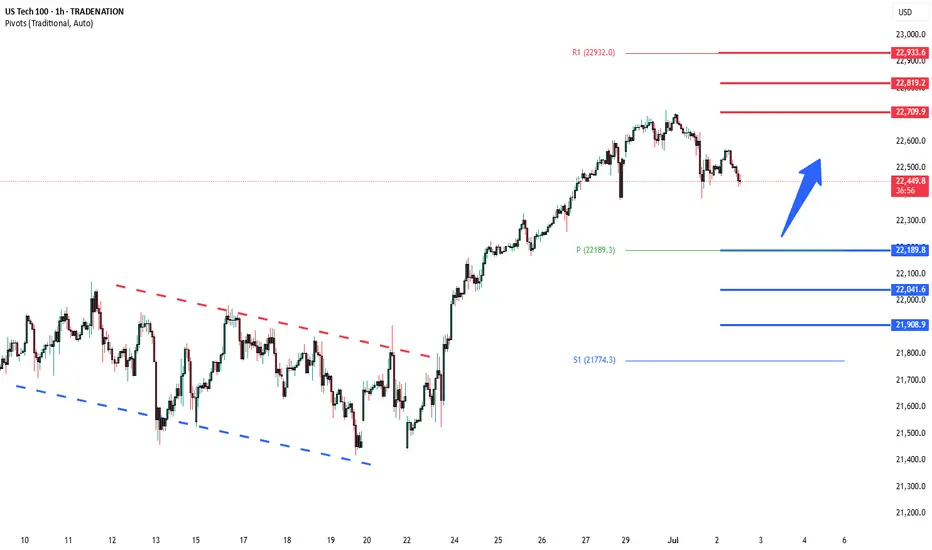
Key Support and Resistance Levels
Resistance Level 1: 22710
Resistance Level 2: 22820
Resistance Level 3: 22930
Support Level 1: 22190
Support Level 2: 22040
Support Level 3: 21900
This communication is for informational purposes only and should not be viewed as any form of recommendation as to a particular course of action or as investment advice. It is not intended as an offer or solicitation for the purchase or sale of any financial instrument or as an official confirmation of any transaction. Opinions, estimates and assumptions expressed herein are made as of the date of this communication and are subject to change without notice. This communication has been prepared based upon information, including market prices, data and other information, believed to be reliable; however, Trade Nation does not warrant its completeness or accuracy. All market prices and market data contained in or attached to this communication are indicative and subject to change without notice.
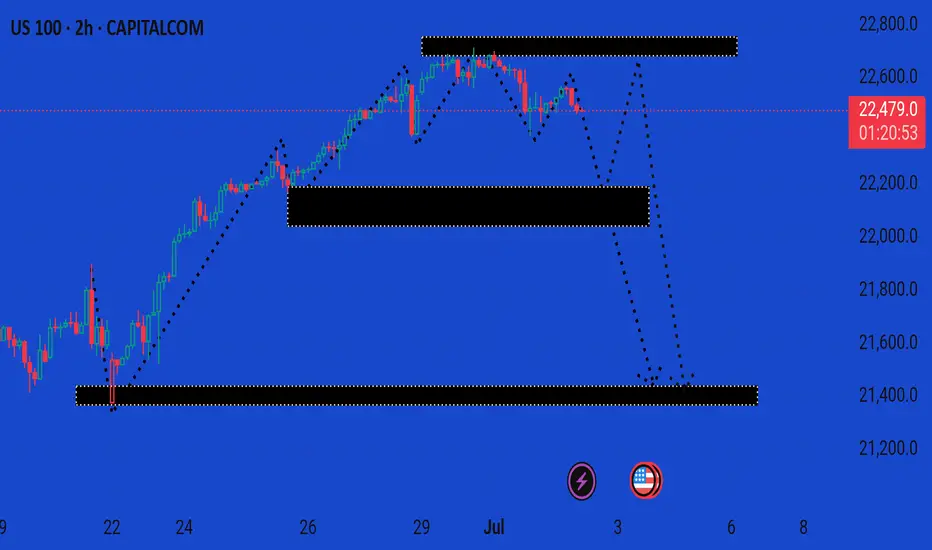
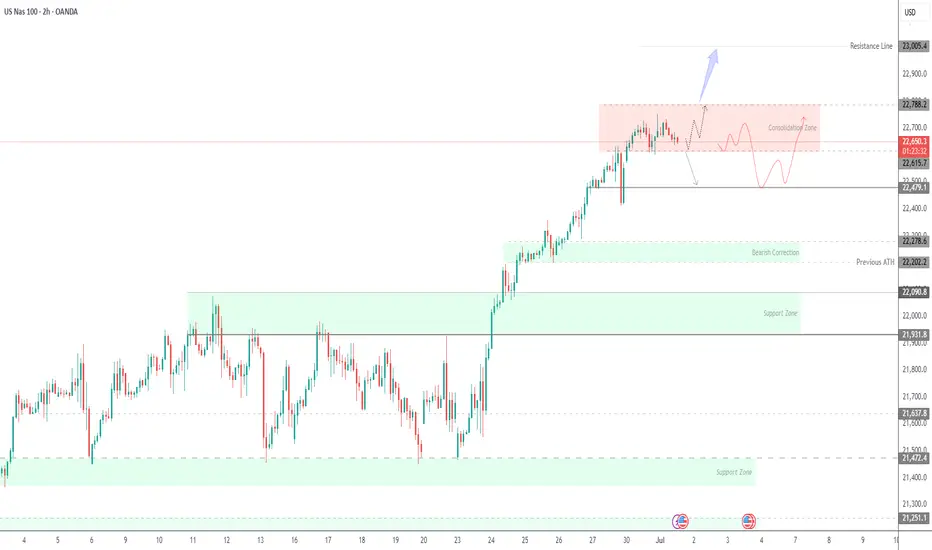
US100 update market The chart you've shared is a 2-hour timeframe for the US 100 index (NASDAQ 100) with a clear bearish outlook marked by projected price levels and potential demand zones.
Key Observations:
1. Current Price:
22,478.5 (near-term consolidation with recent bearish pressure)
2. Highlighted Zones:
Resistance Zone: Around 22,750–22,800 — where price previously reversed.
First Demand Zone: Around 22,100–22,200 — potential support.
Second Demand Zone: Around 21,500–21,600 — deeper support level.
Third Major Demand Zone: Near 21,200 — long-term support.
3. Bearish Structure:
Price has broken below recent support levels.
Black dotted line shows a projected move toward lower demand zones.
Momentum appears to be weakening after a strong bullish rally from June 21–28.
4. Technical Bias:
This is a bearish correction or possible trend reversal setup.
The presence of strong demand zones suggests potential bounce zones if price reaches those levels.
---
Summary:
This chart implies a bearish move is underway on the US 100 with expected targets near 22,100, then 21,600, and potentially 21,200. Watch for bullish reaction or reversal signals at those zones. If price reclaims 22,800+, bearish outlook would be invalidated.
Let me know if you want a trade setup or confirmation strategy based on this analysis.
Tesla Drop Pressures Nasdaq – 22,470 Key to Hold RecoveryUSNAS100 | Overview
Tesla dropped approximately 5%, weighing heavily on the Nasdaq, amid public tensions between Elon Musk and Donald Trump.
Yesterday, the price declined below 22,610 due to the impact of Tesla’s fall but remained above 22,470. As long as it trades above this level, a recovery attempt is likely, with the price expected to break through the consolidation zone between 22,615 and 22,740.
However, if the 1h candle closes below 22,470, the bearish trend is expected to continue toward 22,280 and potentially lower.
Pivot: 22,470
Resistance: 22,615 – 22,740 –23,000
Support: 22,280 – 22,200
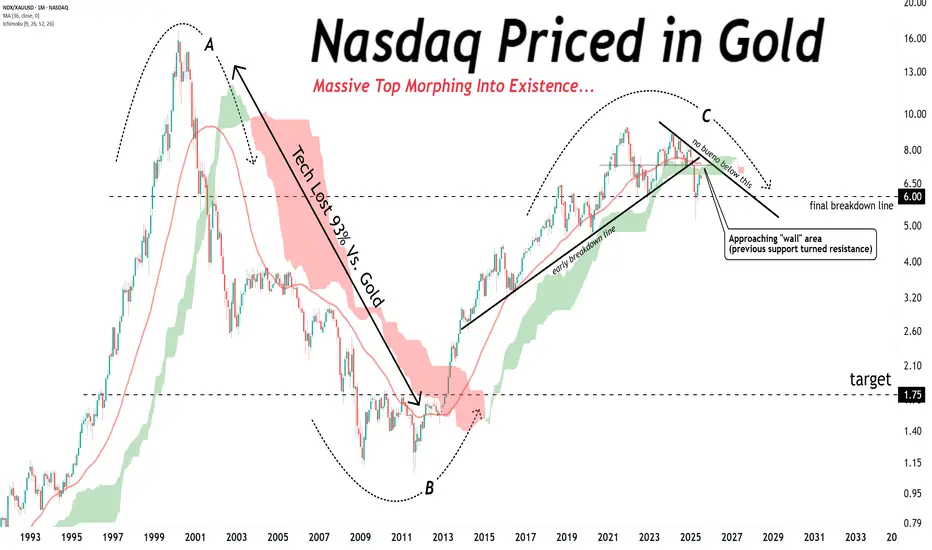
The Nasdaq rally might be reaching its limits… The Nasdaq rally might be reaching its limits…
When priced in gold, a massive topping structure is morphing into existence.
Final breakdown coming?
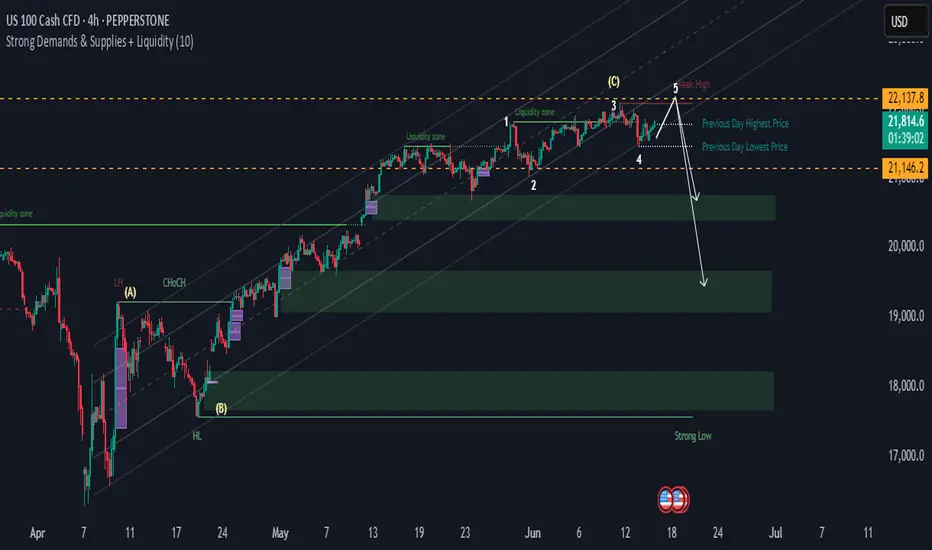
NAS100 Potential ReversalHi there,
The NAS100 is slightly bullish and fairly stagnant. It is consolidating between two key levels (orange lines). A break below the price might fall into deeper demand zones.
Short Notes
- **Elliott Wave**: 5-wave structure appears complete at resistance (22,137.8), signalling a possible reversal.
- **Liquidity Zones**: Price is at/near a major liquidity zone, increasing reversal risk.
- **Break High**: There's a potential for a false breakout above wave 5 before dropping.
- **Support Levels**: The 21,800.6 (previous day high) and 21,146.2 (previous day low) for first support.
- **Demand Zones**: Strong demand below 21,146.2, with deeper support near 20,000 and 18,800.
- **Overview: A possible bearish move ahead from current highs, targeting lower demand zones.
Happy Trading,
K.
Not trading advice
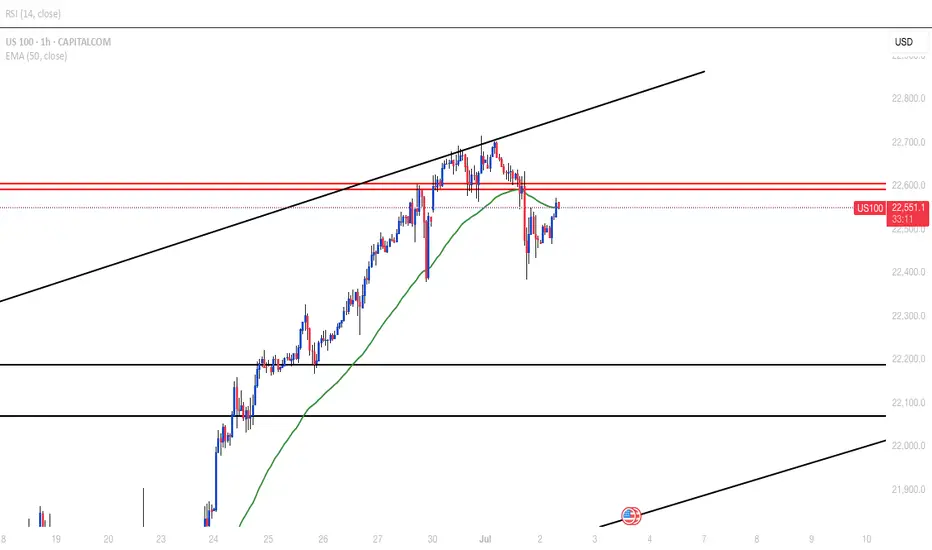
US100Price broke daily resistance last week and now looks like a retracement is on the way. H4 gave a double top at the rising channel resistance. Pulling back to retest the neckline. target is 22,200.
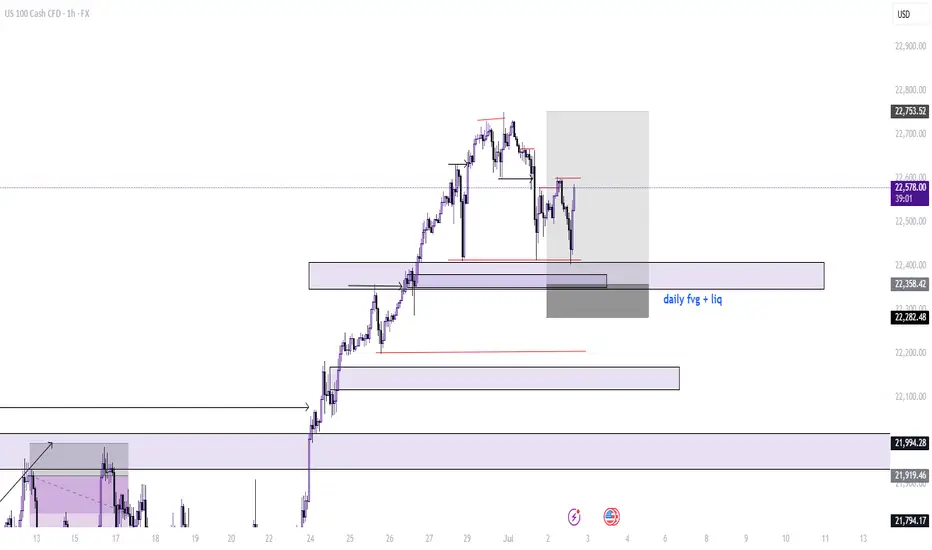
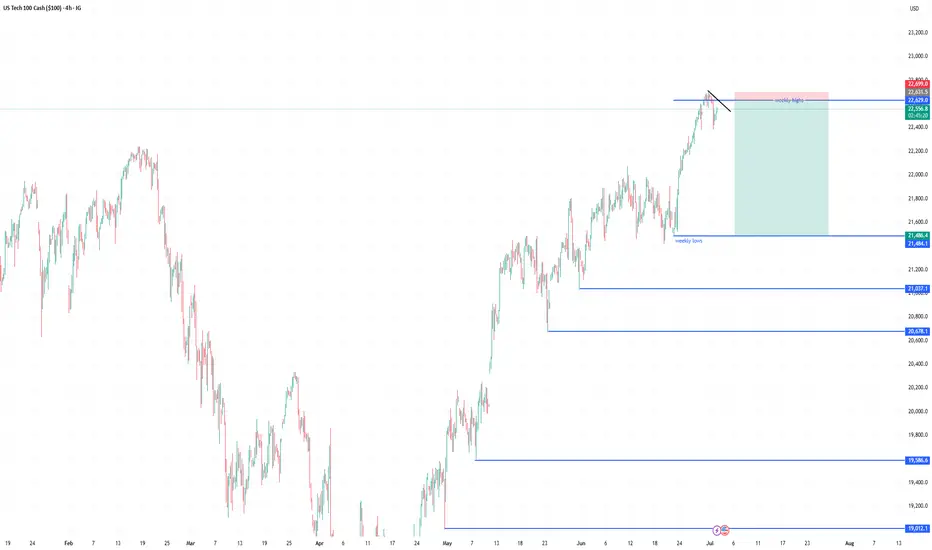
Weekly highs swept, aiming for weekly lows now.Liquidity Grab above Weekly Highs
Bearish Rejection Wicks
Trendline Break
Imbalance / Fair Value Gaps below
Reversion to Mean / Higher Timeframe Discount Zones
Usrec longs after drop📈 US Tech 100 | 15-Min Chart
✅ Live Trade Example using ELFIEDT RSI + Reversion
⸻
This setup was captured using the ELFIEDT RSI + Reversion indicator. A clean BUY signal was triggered after an extended move, followed by a sharp reversal — perfectly timed and visually confirmed by the indicator’s built-in logic.
💡 The result? A precise entry with a strong follow-through.
This tool is built to spot high-probability reversals with confluence — across timeframes, instruments, and volatility conditions.
⸻
👥 Want to trade with structure and clarity?
Join our community of traders who use this system daily to simplify their decisions and sharpen their edge.
📩 Comment “🔥” or send a DM to learn more.

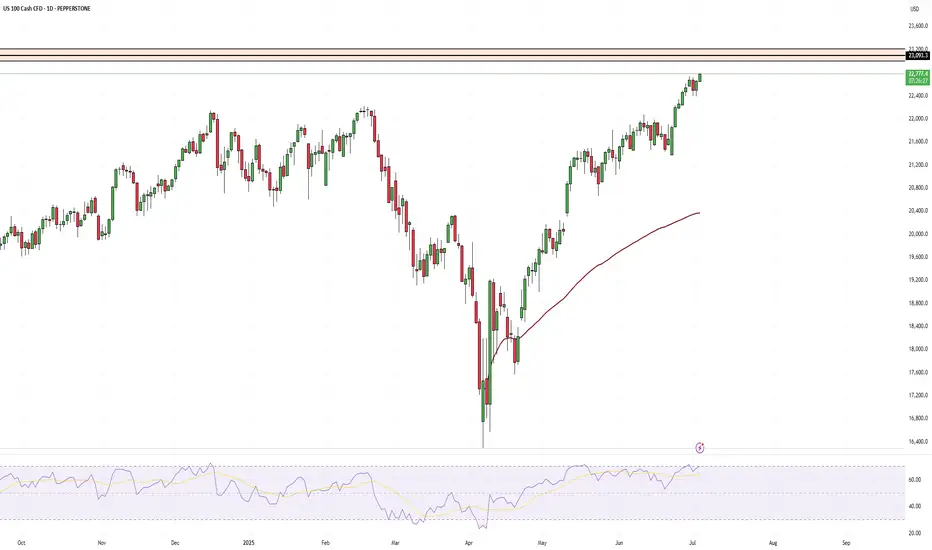
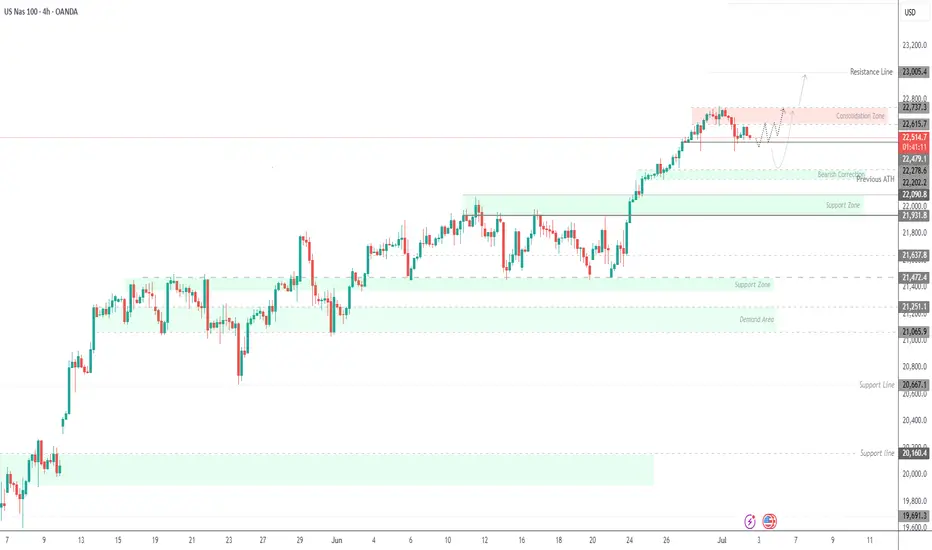
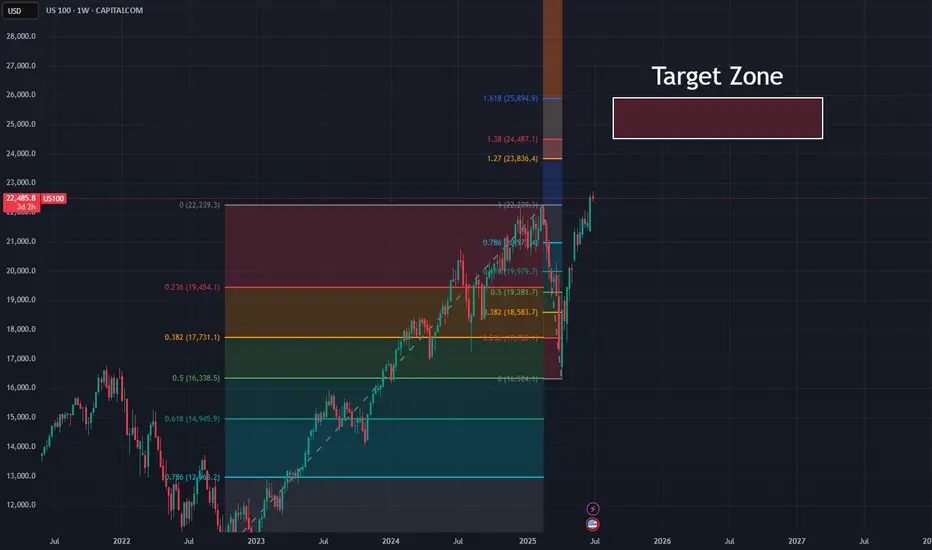
Up Up Up... Nothing Can Stop NAS From RisingLet's take a look at the big picture in the NASDAQ: Do you see how nicely the spring crash landed on the 50% retracement of the upward movement since fall 2022?
Now that we've crossed the old ATH, the targets are clear, and they're way up in the NASDAQ.
The summer correction is therefore likely to fail and probably turn into a listless sideways slide. By September at the latest, however, the NAS should pick up speed again and head for targets between 25,000 and 26,000 - at the very least.
Clear skies!
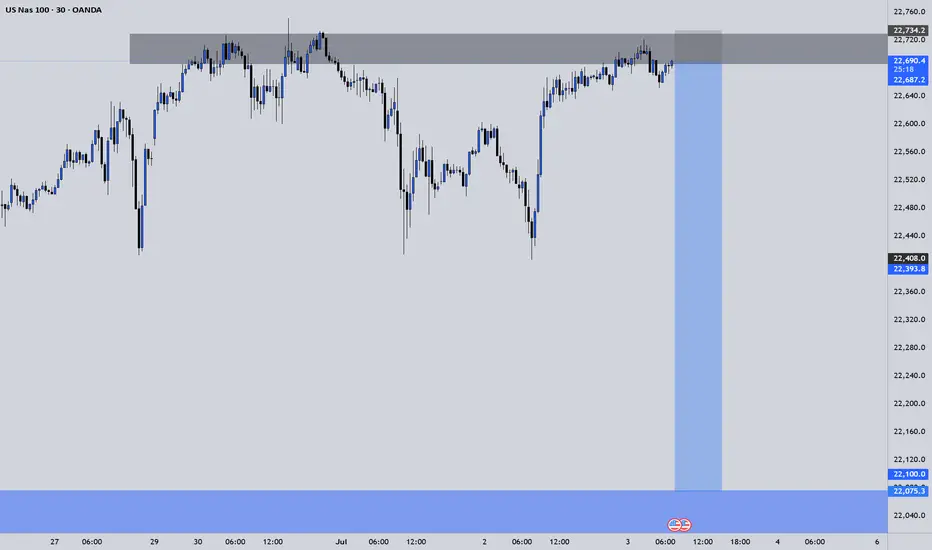
USNAS100 Bullish Momentum Holds Above Key PivotUSNAS100 – Overview
The price successfully retested the 22,610 level and resumed its bullish trend, reaching 22,750 as anticipated in our previous idea.
Currently, the index needs to maintain stability above the 22,610 pivot line to sustain the upward momentum toward the next resistance at 22,790. A sustained move above this level may open the path toward 23,000.
However, a 1H candle close below 22,610 could trigger a corrective move down to 22,480. A break below this support would expose the next key level at 22,280.
Pivot: 22,610
Resistance: 22,790 – 23,000
Support: 22,480 – 22,280
Nas100With speculation about no rate cuts we can expect to see Nas100 plumet with Fed Powells upcoming speech.
If we look at the technical side we can see that Nas has been somewhat consolidating over the past 2 days creating a fair amount of Sell side liquidity. We can expect Powell to speak about rat cuts today in his upcoming speech and we will use this to our advantage waiting for early buyers to push up the market triggering our setup.
We can look for a plus minus 100 pip move before Nas turns around, we will however closely monitor the movement of Nas now until the speech so that we can execute a trade with the least amount of risk.
Remember to like and subscribe for more A+ setups.
London session long 01/07/2025Clear AMD, london manipulates into remaining 15min fvg, aim for asian highs.