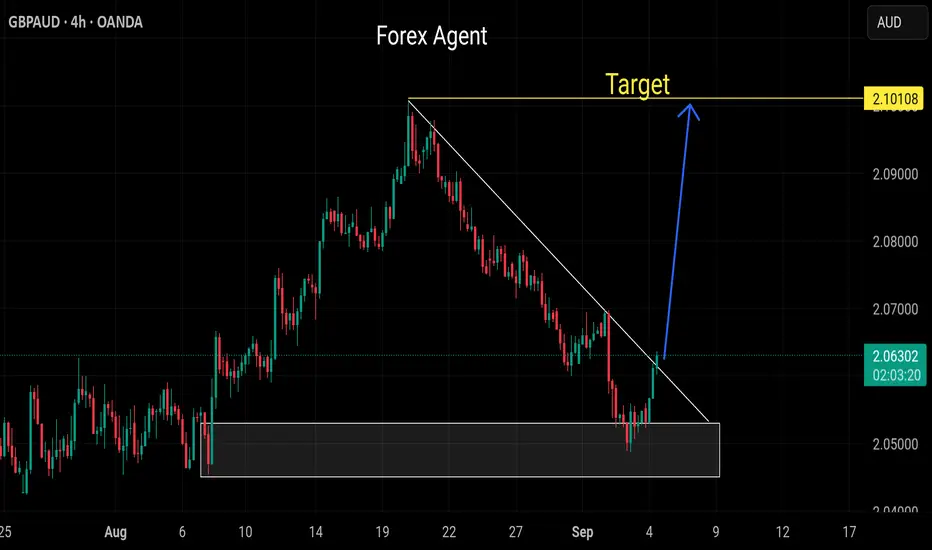
GBP/AUD - Triangle Breakout (08.09.2025)The GBP/AUD Pair on the M30 timeframe presents a Potential Selling Opportunity due to a recent Formation of a Triangle Breakout Pattern. This suggests a shift in momentum towards the downside in the coming hours.
Possible Short Trade:
Entry: Consider Entering A Short Position around Trendline Of The Pattern.
Target Levels:
1st Support – 2.0493
2nd Support – 2.0457
🎁 Please hit the like button and
🎁 Leave a comment to support for My Post !
Your likes and comments are incredibly motivating and will encourage me to share more analysis with you.
Best Regards, KABHI_TA_TRADING
Thank you.
Disclosure: I am part of Trade Nation's Influencer program and receive a monthly fee for using their TradingView charts in my analysis.
GBPAUD trade ideas

04.09.25 Morning ForecastPairs on Watch -
FX:GBPAUD
FX:EURJPY
FOREXCOM:COFFEE
FX:NZDCAD
A short overview of the instruments I am looking at for today, multi-timeframe analysis down to what I will be looking at for an entry. Enjoy!

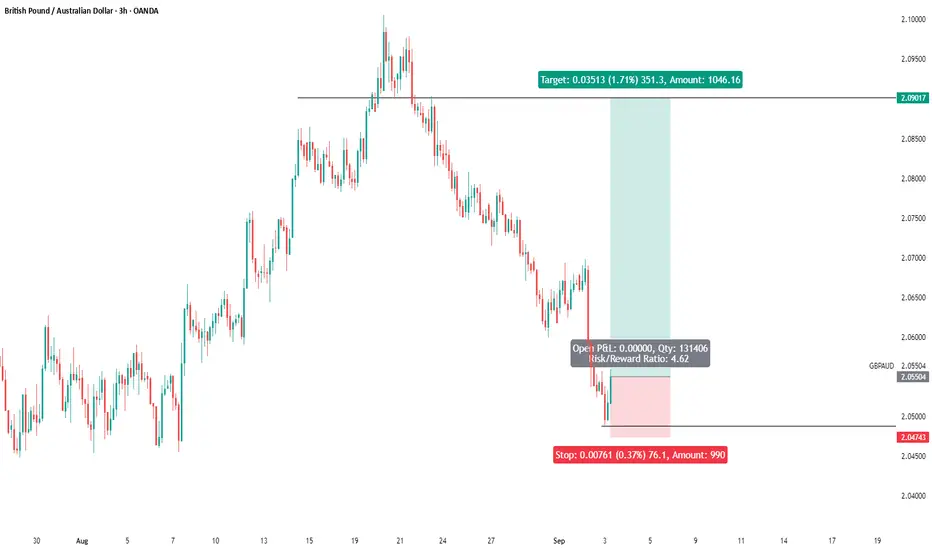
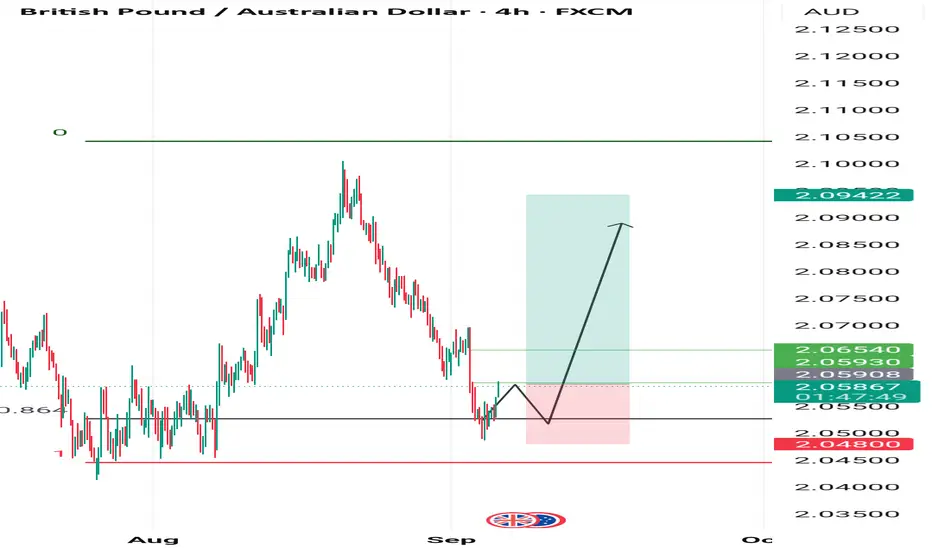
GBPAUD Long Trade OANDA:GBPAUD Long Trade
Entry: 2.05480 - 2.06345
TP: 2.07344
This is good trade.
Don't overload your risk like Greedy gambler!!!
Be Disciplined Trader, risk what you can afford.
Use proper risk management.
Disclaimer: Trading is risky, only idea, not advice.

GBPAUD Ready for a Breakdown?1. Retail Sentiment
62% of retail traders are long on GBPAUD, while 38% are short.
Historically, retail positioning tends to be contrarian: an excess of longs often signals further downside pressure.
Volume: 824 long lots vs 506 short lots → net long exposure.
➡ Bias: Contrarian short
2. COT Report
GBP (August 26, 2025)
Non-commercials (speculators): 76k longs vs 107k shorts → net short of -31k.
Commercials: net long, but mainly for hedging purposes.
Trend: large speculators are slightly increasing shorts (+866) while reducing longs (-5,302).
➡ Bias: GBP weakness
AUD (August 26, 2025)
Non-commercials: 28k longs vs 129k shorts → heavily net short AUD.
Commercials have significantly increased long positions (+10,892).
Speculators remain bearish, but defensive positioning is building up.
➡ Bias: AUD still weak, but showing early signs of stabilization
3. Seasonality (September)
GBP: historically negative in September (weakness).
AUD: historically shows a moderately positive trend in September, especially in the last 10 years.
➡ Bias: GBPAUD historically bearish in September
4. Technical Analysis
Structure: the market rejected the 2.09 supply zone and is now consolidating within the 2.03–2.09 range.
Price action suggests a possible rebound towards 2.07–2.08 before a potential breakdown towards 2.03.
➡ Technical bias: Short from supply zones at 2.07–2.08 targeting 2.04–2.03
5. Summary & Trading Scenarios
Macro/COT: GBP remains weak, AUD under pressure but with accumulation signs → mixed outlook, but seasonality favors AUD.
Sentiment: retail traders excessively long → confirms short bias.
Technical: bearish structure with key supports at 2.0430 and 2.0318.
👉 Conclusion: At the moment, GBPAUD shows a bearish bias supported by retail sentiment, seasonality, and price action. The most likely scenario is a test of the 2.04–2.03 zone in the coming weeks.

GBPAUD to continue in the downward move?GBPAUD - 24h expiry
Our short term bias remains negative.
Intraday rallies continue to attract sellers and there is no clear indication that this sequence for trading is coming to an end.
2.0650 has been pivotal.
50 4hour EMA is at 2.0622.
Risk/Reward would be poor to call a sell from current levels.
We look to Sell at 2.0615 (stop at 2.0665)
Our profit targets will be 2.0465 and 2.0435
Resistance: 2.0585 / 2.0620 / 2.0650
Support: 2.0487 / 2.0450 / 2.0400
Risk Disclaimer
The trade ideas beyond this page are for informational purposes only and do not constitute investment advice or a solicitation to trade. This information is provided by Signal Centre, a third-party unaffiliated with OANDA, and is intended for general circulation only. OANDA does not guarantee the accuracy of this information and assumes no responsibilities for the information provided by the third party. The information does not take into account the specific investment objectives, financial situation, or particular needs of any particular person. You should take into account your specific investment objectives, financial situation, and particular needs before making a commitment to trade, including seeking, under a separate engagement, as you deem fit.
You accept that you assume all risks in independently viewing the contents and selecting a chosen strategy.
Where the research is distributed in Singapore to a person who is not an Accredited Investor, Expert Investor or an Institutional Investor, Oanda Asia Pacific Pte Ltd (“OAP“) accepts legal responsibility for the contents of the report to such persons only to the extent required by law. Singapore customers should contact OAP at 6579 8289 for matters arising from, or in connection with, the information/research distributed.

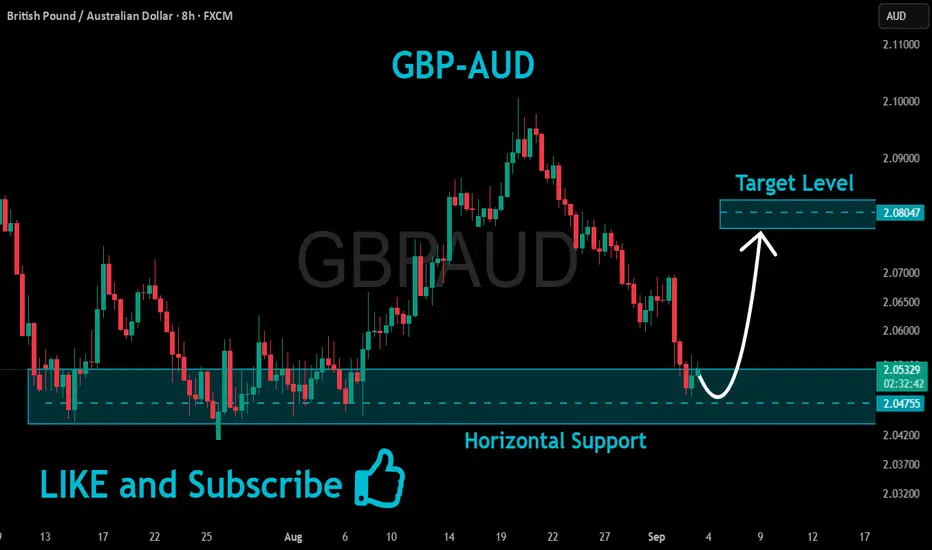
GBPAUD Support Ahead!
HI,Traders !
#GBPAUD keeps falling down
In a strong local downtrend
And the pair is locally oversold
So after the pair hits the
Horizontal support of 2.04755
A local bullish correction
Is to be expected !
Comment and subscribe to help us grow !
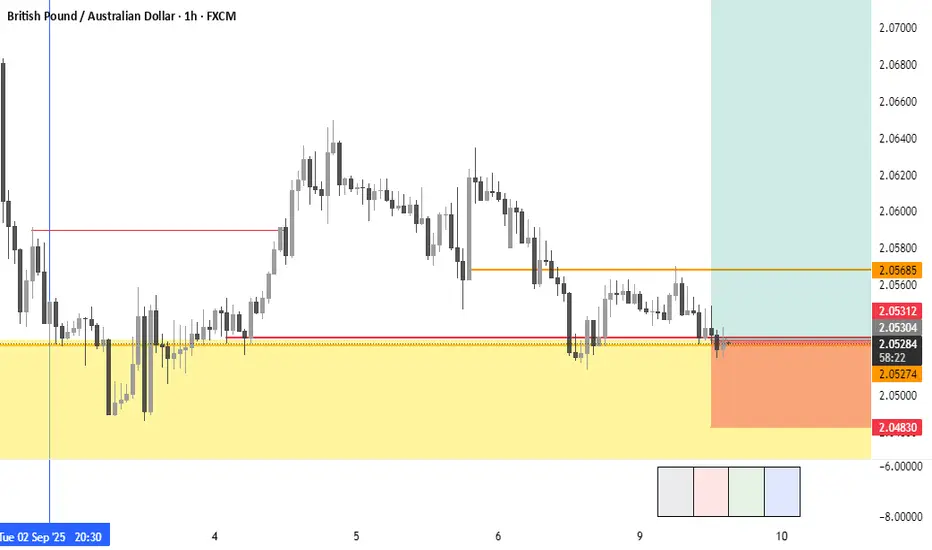
GBPAUD | Possible Re-entry on 15Min When analyzing price movements on a 4-hour chart, it's important to note that the price is currently coming from a fresh demand zone. This return to the demand zone indicates a potential bullish intent, suggesting that buyers may be stepping in at this level.
Now, if we scale down to the 15-minute chart, we can observe a subtle shift in the price action. There is a trendline liquidity that is positioned just above our identified point of interest (POI), which is complemented by a fair value gap (FVG). This trendline presents an additional confluence that supports the possibility of continued upward movement.
As market participants, we should proceed with caution and closely monitor how price reacts when it approaches this zone once more. It is also beneficial to take the time to observe these patterns and phenomena in your own analysis to deepen your understanding. Happy trading!

Example of a Pass – GBP/AUDHere’s a pullback on GBP/AUD that checked almost every box:
Volume: Strong
Momentum: Hooked and aligned
Signal: Clean engulfing candle
But one thing was missing — Structure. The so-called support/resistance zone had only a single touch. In other words, it wasn’t really a zone at all.
⚔️ War Room Lesson: No S/R zone = no trade. Even when Volume, Momentum, and Signal look great, if the foundation isn’t there, the setup doesn’t qualify. Structure comes first — always.

GBPAUD 30Min Engaged ( Buy & Sell Reversal Entry Detected )Time Frame: 30-Minute Warfare
Entry Protocol: Only after volume-verified breakout
🩸Bullish Reversal - 2.05450
🩸Bullish Reversal - 2.06100
➗ Hanzo Protocol: Volume-Tiered Entry Authority
➕ Zone Activated: Dynamic market pressure detected.
The level isn’t just price — it’s a memory of where they moved size.
Volume is rising beneath the surface — not noise, but preparation.

Buy gbpaudDaily chart Already oversold
Strong bullish level respecting
Daily down trend already broken
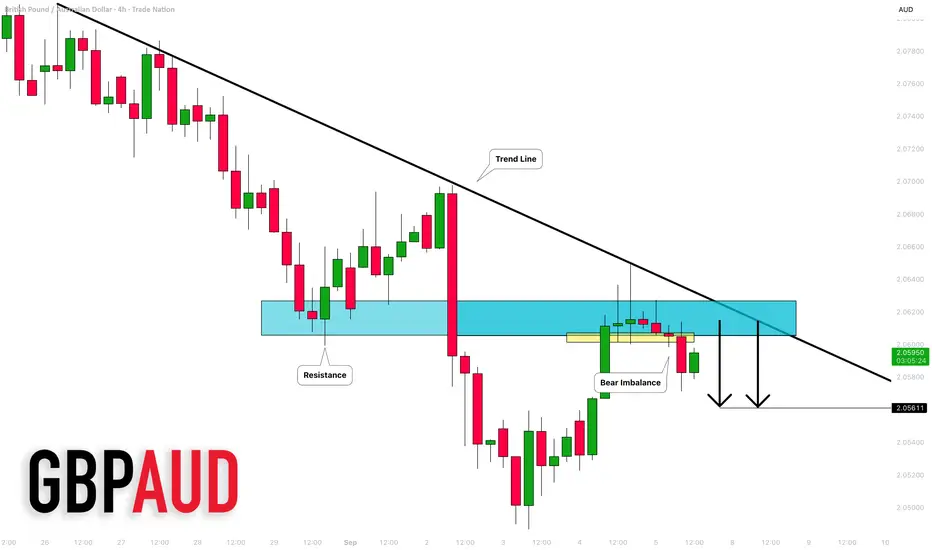
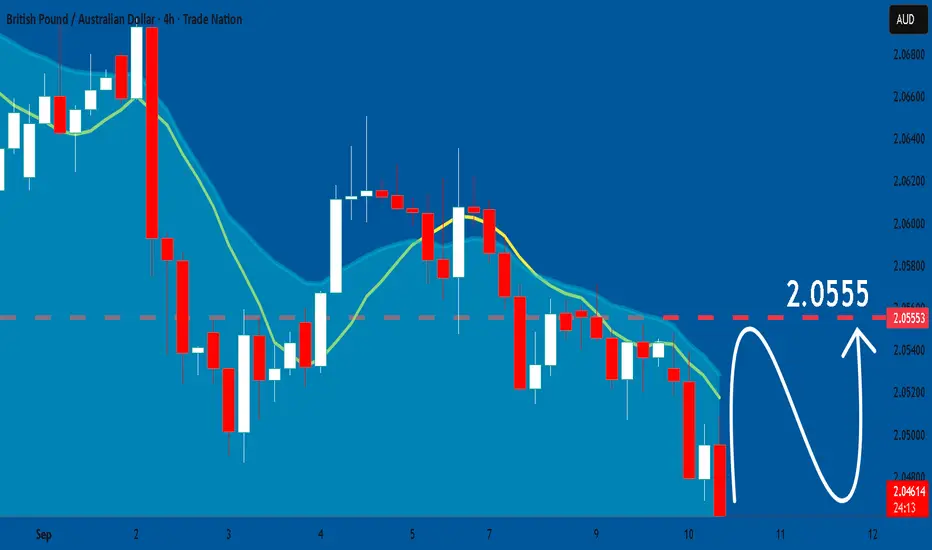
GBPAUD: Time to Sell?! 🇬🇧🇦🇺
GBPAUD nicely respected a supply zone based on a falling
trend line and a horizontal resistance.
A formation of a bearish imbalance candle on a 4H time frame
after an extended consolidation leaves a strong bearish clue.
I expect a retracement at least to 2.056
❤️Please, support my work with like, thank you!❤️
I am part of Trade Nation's Influencer program and receive a monthly fee for using their TradingView charts in my analysis.
GBPAUD chart analysis"Please take a look at my analysis—what do you think?"
Disclaimer: This is not financial advice. Please do your own research before making any investment decisions.
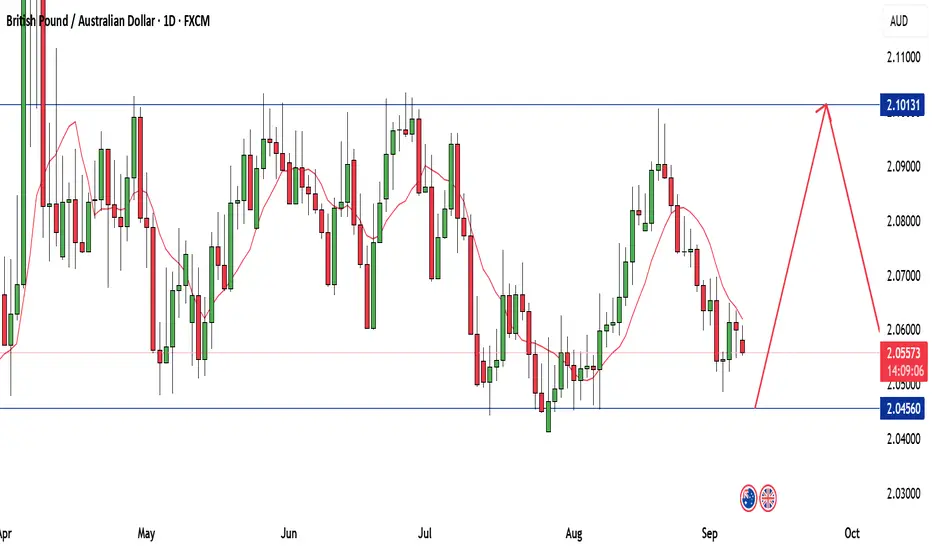
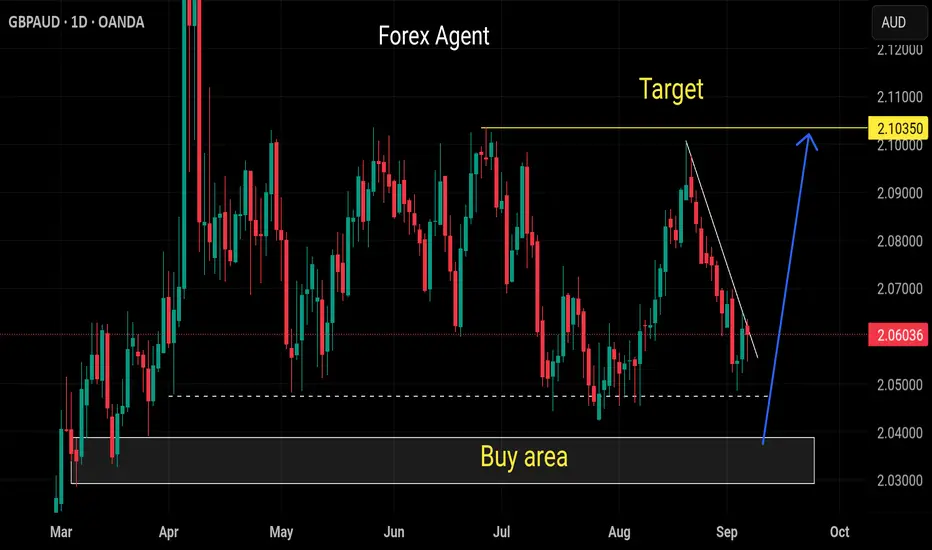
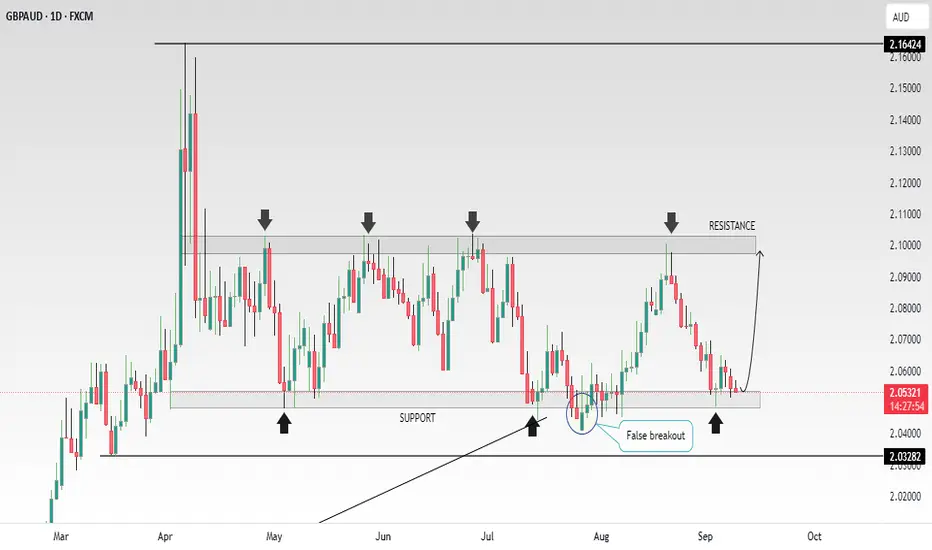
GBP/AUD : Lets Make Crazy Money From This Sideway Movement!This is GBP/AUD chart on the daily timeframe. if u take a close look you will see that the price is moving perfectly in a sideway between absolutely 2 strong resistance and support no break for months so far.
Trading the sideway if very fun for me because i know the price boundaries and the stronger these boundaries are the less risk you take in trading the sideway movement.
in the GBP/AUD case i will enter a buy trade @ 2.04600 u can wait and enter directly or you can sell a limit order just like me to make sure that u enter the trade even if you are sleeping.
regarding the target usually the space between the support and the resistance is your target but for me taking between 300 to 400 pips will be enough i can't wait longer that this :)
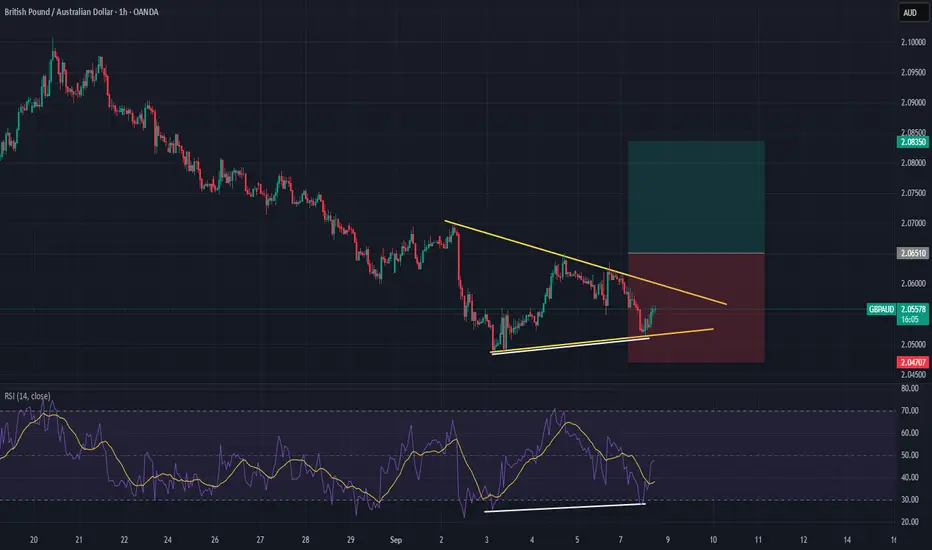
GBPAUD LONG 1HFalling Wedge + Bullish Divergence
Expecting it will break last LH and start its bullish trend
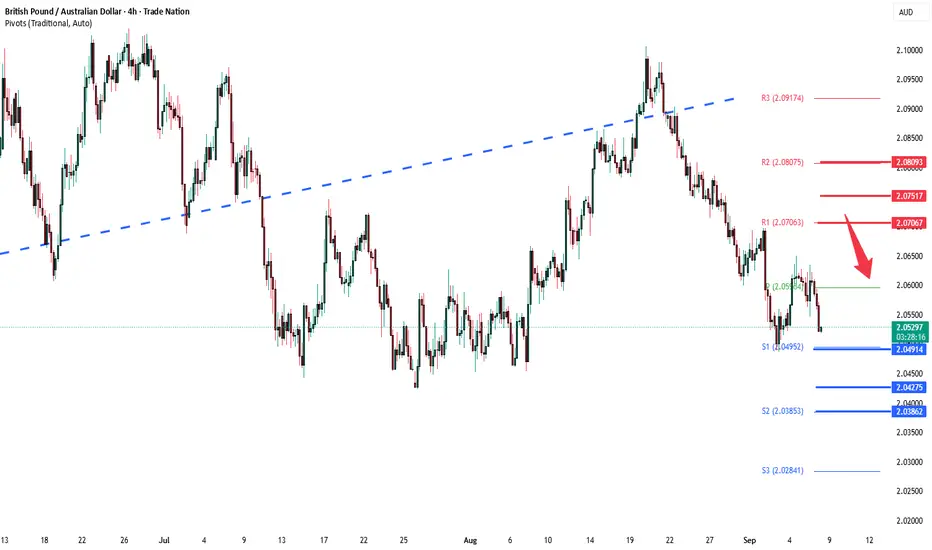
GBPAUD oversold bounce backs capped at 2.0700The GBPAUD pair is currently trading with a bearish bias, aligned with the broader downward trend. Recent price action shows a retest of the resistance, suggesting a temporary relief rally within the downtrend.
Key resistance is located at 2.0700, a prior consolidation zone. This level will be critical in determining the next directional move.
A bearish rejection from 2.0700 could confirm the resumption of the downtrend, targeting the next support levels at 2.0490, followed by 2.0430 and 2.0390 over a longer timeframe.
Conversely, a decisive breakout and daily close above 2.0700 would invalidate the current bearish setup, shifting sentiment to bullish and potentially triggering a move towards 2.0750, then 2.0800.
Conclusion:
The short-term outlook remains bearish unless the pair breaks and holds above 2.0700. Traders should watch for price action signals around this key level to confirm direction. A rejection favours fresh downside continuation, while a breakout signals a potential trend reversal or deeper correction.
This communication is for informational purposes only and should not be viewed as any form of recommendation as to a particular course of action or as investment advice. It is not intended as an offer or solicitation for the purchase or sale of any financial instrument or as an official confirmation of any transaction. Opinions, estimates and assumptions expressed herein are made as of the date of this communication and are subject to change without notice. This communication has been prepared based upon information, including market prices, data and other information, believed to be reliable; however, Trade Nation does not warrant its completeness or accuracy. All market prices and market data contained in or attached to this communication are indicative and subject to change without notice.
GBP/JPY – Support Bounce SetupPrice has once again respected the 198.70 support zone, rejecting further downside.
Support: 198.70 – 198.80
Resistance: 200.00 – 200.20
Structure: Lower-highs but strong support defense
Bias: Bullish short-term reversal
📊 Idea: Long from support with SL below 198.70, TP near 200.20.
If support breaks, downside momentum could accelerate – so risk management is key.
#GBPJPY #Forex #TradingView #PriceAction #SupportResistance
Strong buy area gbpaudWait to Reached at our strong buy level
Currently respecting our weak down trend
Wait to sweep low then straight buy
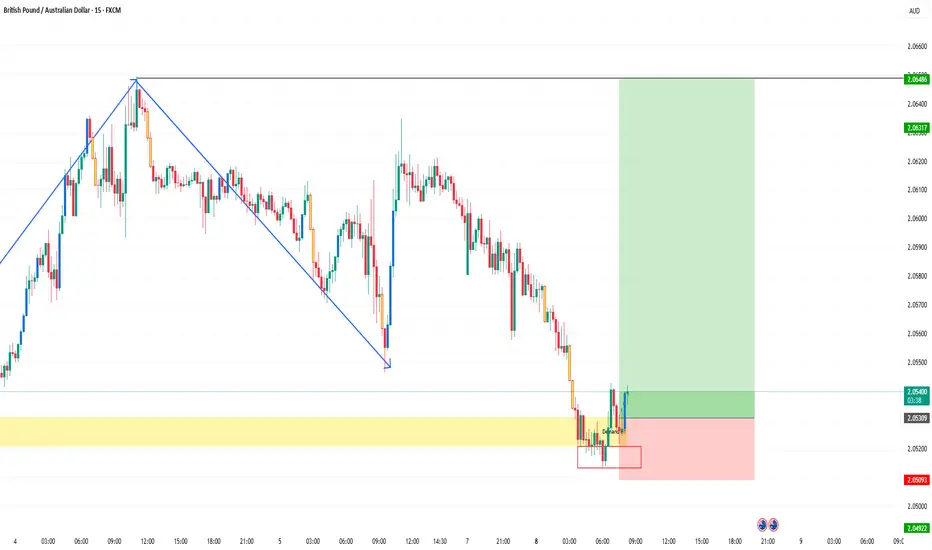
GBPAUD Buy Opportunity! Trend Context:
Price had a sharp bearish move after forming a swing high (left side with blue zigzag).
The downtrend has been consistent with lower highs and lower lows.
Demand Zone
The yellow zone marks a demand/support area where buyers stepped in before.
Price tested this area multiple times and wicked down into the red rectangle, showing rejection.
Entry Setup
You entered around 2.0534 after price reacted strongly from the demand zone.
Stop loss (SL): 2.0492 (below the demand rejection area). Take profit (TP): 2.0648 (at previous supply/structure level).
Risk-to-Reward (RR)
Approximate RR ≈ 3.5:1 → strong risk-to-reward setup. This means if the trade wins, the reward is about 3.5x the risk.
Bullish Signs
Demand zone held firmly. Small consolidation inside red box → accumulation before breakout.
Buyers are showing strength with rejection wicks.
Bearish Risks
Overall market structure is still bearish (downtrend). If buyers fail to push above 2.0550–2.0560, sellers may re-enter. A break below 2.0490 would invalidate the bullish setup.
This is a counter-trend long trade from demand. If bullish momentum sustains above 2.0560, TP is realistic. But since the higher trend is bearish, manage risk strictly.
👉 Safer play: trail SL once price moves above 2.0570–2.0580.
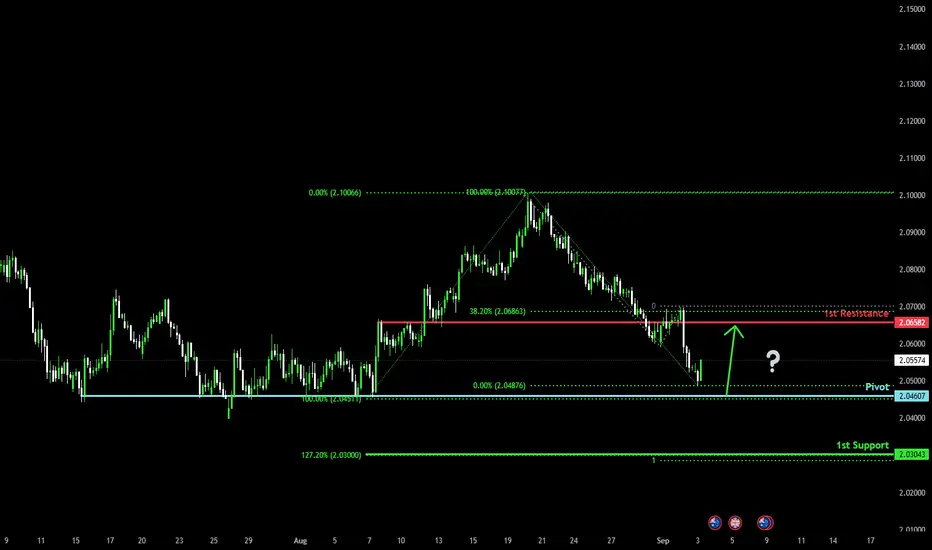
Bullish reversal off major support?GBP/AUD is falling towards the pivot which is a multi swing low support and could bounce to the 1st resistance.
Pivot: 2.0460
1st Support: 2.0304
1st Resistance: 2.0658
Risk Warning:
Trading Forex and CFDs carries a high level of risk to your capital and you should only trade with money you can afford to lose. Trading Forex and CFDs may not be suitable for all investors, so please ensure that you fully understand the risks involved and seek independent advice if necessary.
Disclaimer:
The above opinions given constitute general market commentary, and do not constitute the opinion or advice of IC Markets or any form of personal or investment advice.
Any opinions, news, research, analyses, prices, other information, or links to third-party sites contained on this website are provided on an "as-is" basis, are intended only to be informative, is not an advice nor a recommendation, nor research, or a record of our trading prices, or an offer of, or solicitation for a transaction in any financial instrument and thus should not be treated as such. The information provided does not involve any specific investment objectives, financial situation and needs of any specific person who may receive it. Please be aware, that past performance is not a reliable indicator of future performance and/or results. Past Performance or Forward-looking scenarios based upon the reasonable beliefs of the third-party provider are not a guarantee of future performance. Actual results may differ materially from those anticipated in forward-looking or past performance statements. IC Markets makes no representation or warranty and assumes no liability as to the accuracy or completeness of the information provided, nor any loss arising from any investment based on a recommendation, forecast or any information supplied by any third-party.
GBPAUD: Growth & Bullish Continuation
The analysis of the GBPAUD chart clearly shows us that the pair is finally about to go up due to the rising pressure from the buyers.
Disclosure: I am part of Trade Nation's Influencer program and receive a monthly fee for using their TradingView charts in my analysis.
❤️ Please, support our work with like & comment! ❤️
gbpaud buy signal. Don't forget about stop-loss.
Write in the comments all your questions and instruments analysis of which you want to see.
Friends, push the like button, write a comment, and share with your mates - that would be the best THANK YOU.
P.S. I personally will open entry if the price will show it according to my strategy.
Always make your analysis before a trade