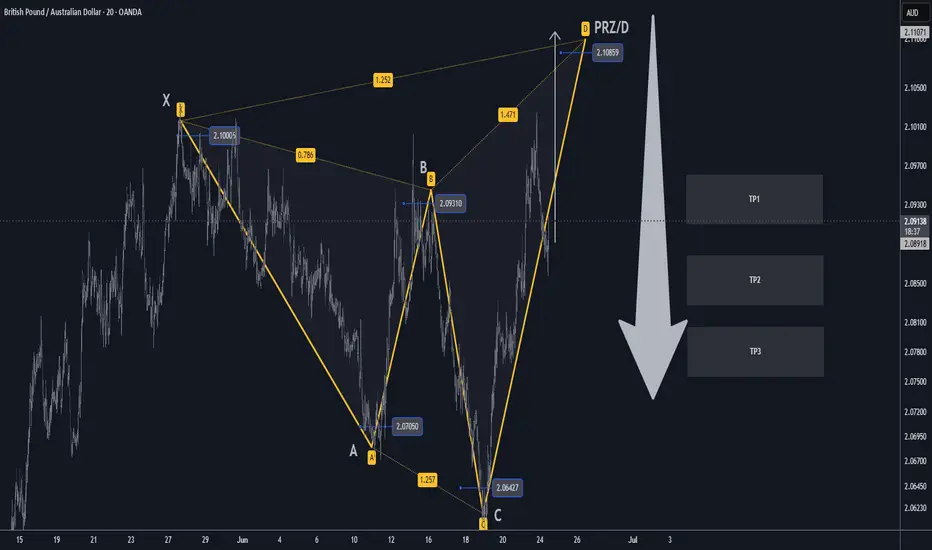
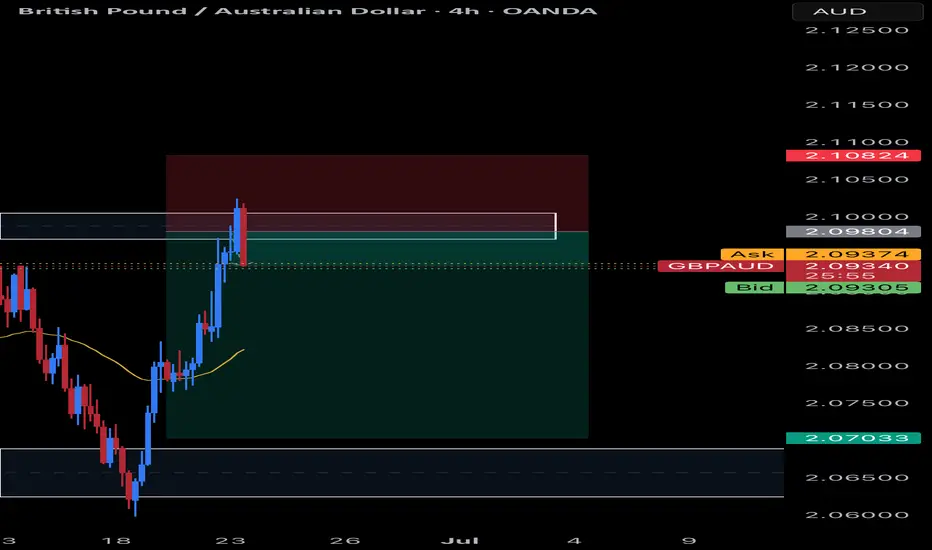
GBPAUD XABCD Short from PRZ/D TP1/TP2 Swing Trade🔸Hello traders, let's review the 20 MINUTE chart for GBPAUD. Strong gains off the lows recently, however price getting overextended and expecting reversal later at/near PRZ/D.
🔸Speculative XABCD structure defined by point X 1000 point A 0700 point B 0930 point C 0640 point D/PRZ 1080 still pending.
🔸Currently most points validated, point D/PRZ still pending 1080, so traders should wait until we hit D before SHORTING.
🔸Recommended strategy for GA traders: wait for price to max out to complete at point D near 1080, short/hold, SL 80 pips, TP1/TP2/TP3 0940/0840/0780. SHORT/HOLD at point D/PRZ at 1080 swing trade setup. keep in mind this is a swing trade setup, patience required.
🎁Please hit the like button and
🎁Leave a comment to support our team!
RISK DISCLAIMER:
Trading Futures , Forex, CFDs and Stocks involves a risk of loss.
Please consider carefully if such trading is appropriate for you.
Past performance is not indicative of future results.
Always limit your leverage and use tight stop loss.
GBPAUD trade ideas
Trade Idea: Buy GBPAUD (Short-Term Push With Trend) **📈 Trade Idea: Buy GBPAUD (Short-Term Push With Trend)**
**Bias:** 🔼 Bullish (Short-Term & Medium-Term)
**Idea:** Uptrend’s still alive — this looks like a pause, not a reversal
---
### **💡 Why Buy?**
**🇬🇧 GBP Holding Up:**
* UK data is soft, sure — but GBP isn’t breaking 💪
* Market already pricing in BoE cuts, so downside feels limited 📉
* GBP gaining ground on weaker currencies — it’s playing the relative game ⚖️
**🇦🇺 AUD Struggling:**
* China slowdown = AUD under pressure 🐉
* RBA is dovish, room for more cuts 🔻
* Risk-off tone not helping commodity currencies 🌍💨
* Traders still short AUD — not a sign of strength 🚩
---
### **📊 Technical Feel (No Fixed Levels):**
* **Uptrend still in play:** Pullbacks are shallow, and price keeps stepping up 🔁
* **Price keeps bouncing off the same dynamic zone:** Almost like muscle memory — buyers show up when they’re supposed to 🧠
* **Candles showing rejection of lows:** Wicks are long, bodies small — sellers try, buyers answer back 📈
* **Momentum indicators cooling but stable:** Feels like a breather, not a breakdown 🧊
* **Moving averages holding the structure:** Price respects the base — clean, steady rhythm 🪘
* **No panic selling:** Nothing dramatic — just quiet consolidation = potential launchpad 🚀
---
### **⚠️ Invalidation Clue:**
> If price starts printing strong red candles through prior reaction zones with volume — bulls may be losing control 🧨
> Otherwise, still looks like controlled strength
---
### **🎯 Summary:**
GBPAUD is riding a healthy uptrend — no fireworks, just steady ground gained.
This pullback feels more like a **pause to reload** than a change in direction.
If nothing shifts, the next push could stretch higher before any real correction.
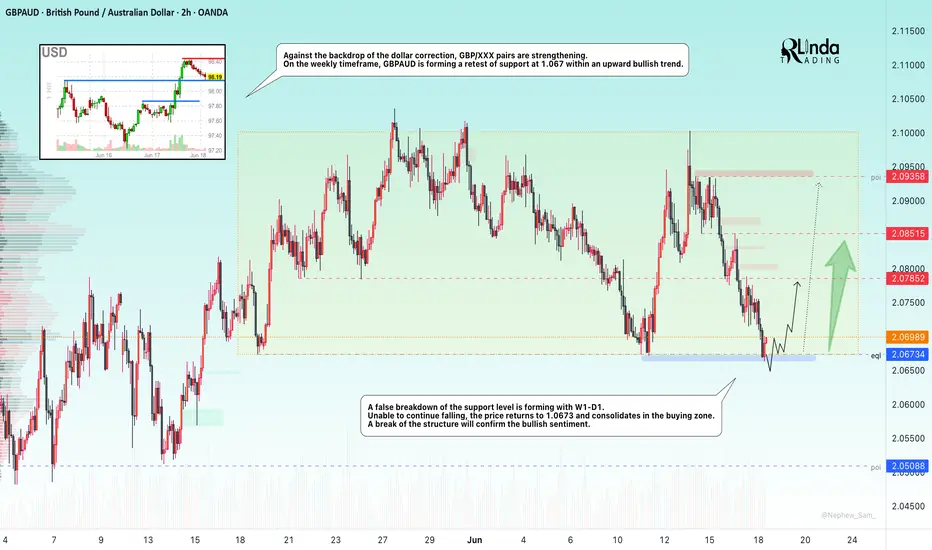
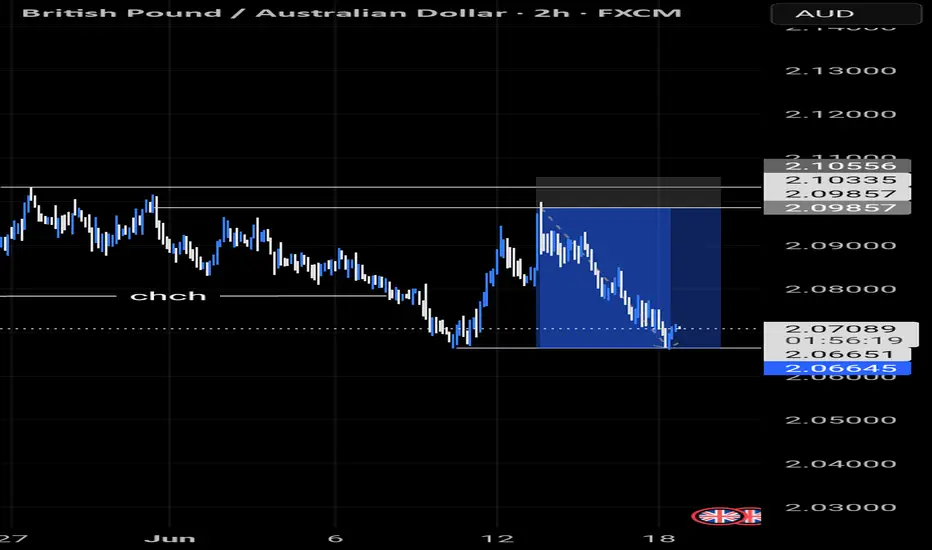
GBPAUD → Countertrend liquidity captureFX:GBPAUD is forming a countertrend correction within a global uptrend and testing the support level with W1-D1, forming a false breakdown...
Against the backdrop of the dollar's correction, GBP/XXX pairs are strengthening. On the weekly timeframe, GBPAUD is forming a retest of support at 1.067 (false breakdown) within an upward bullish trend.
Unable to continue falling, the price returns above 1.0673 and consolidates in the buying zone. A breakdown of the structure will confirm the bullish sentiment.
Support levels: 2.0673
Resistance levels: 2.0785, 2.0852
If the bulls manage to hold their ground above the 2.067 support level within the current structure, the currency pair will have a good chance of returning to the bullish trend.
Best regards, R. Linda!
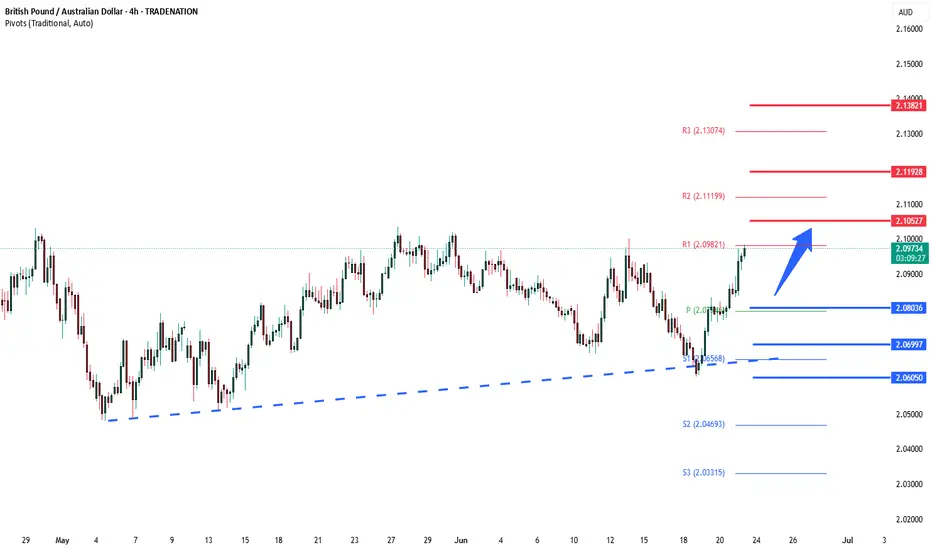
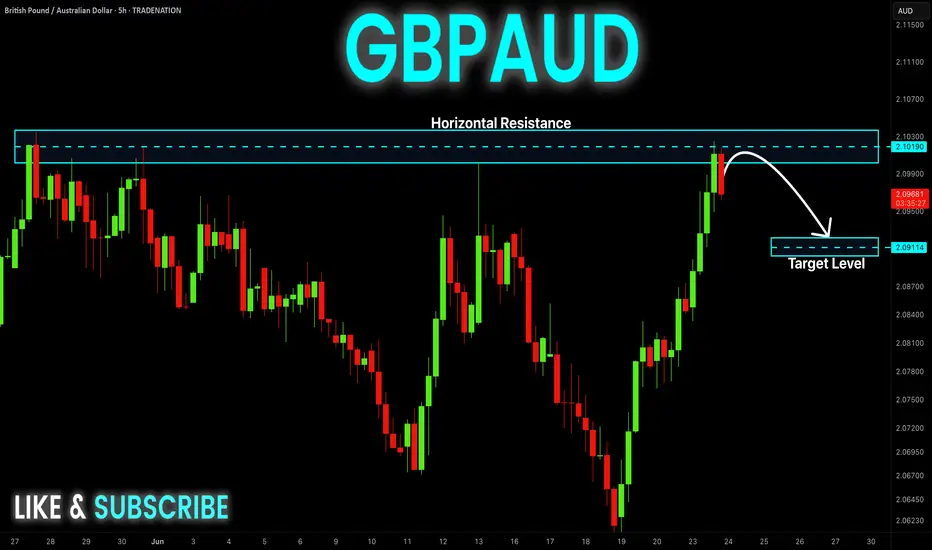
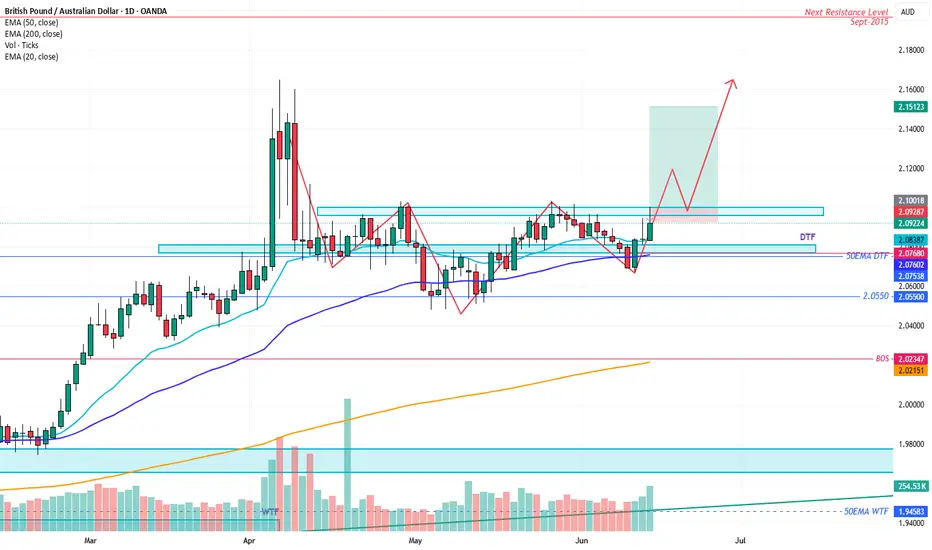
GBPAUD INTRADAY Bullish breakout support at 2.0800Trend Overview:
The GBPAUD currency price remains in a bullish trend, characterised by higher highs and higher lows. The recent intraday price action is forming a continuation consolidation pattern, suggesting a potential pause before a renewed move higher.
Key Technical Levels:
Support: 2.0690 (primary pivot), followed by 2.0600 and 2.0535
Resistance: 2.1056 (initial), then 2.1190 and 2.1384
Technical Outlook:
A pullback to the 2.0800 level, which aligns with the previous consolidation zone, could act as a platform for renewed buying interest. A confirmed bounce from this support may trigger a continuation toward the next resistance levels at 2.1056, 2.1190, and ultimately 2.1384.
Conversely, a daily close below 2.0800 would suggest weakening bullish momentum. This scenario would shift the bias to bearish in the short term, potentially targeting 2.0690 and 2.0600 as downside levels.
Conclusion:
GBPAUD maintains a bullish structure while trading above the 2.0800 support. A bounce from this level would validate the consolidation as a continuation pattern, with upside potential toward the 2.1056 area. A breakdown below 2.0690, however, would invalidate this view and suggest deeper corrective risk.
This communication is for informational purposes only and should not be viewed as any form of recommendation as to a particular course of action or as investment advice. It is not intended as an offer or solicitation for the purchase or sale of any financial instrument or as an official confirmation of any transaction. Opinions, estimates and assumptions expressed herein are made as of the date of this communication and are subject to change without notice. This communication has been prepared based upon information, including market prices, data and other information, believed to be reliable; however, Trade Nation does not warrant its completeness or accuracy. All market prices and market data contained in or attached to this communication are indicative and subject to change without notice.
GBPAUD Trading Opportunity! SELL!
My dear friends,
Please, find my technical outlook for GBPAUD below:
The price is coiling around a solid key level - 2.0968
Bias - Bearish
Technical Indicators: Pivot Points Lowanticipates a potential price reversal.
Super trend shows a clear sell, giving a perfect indicators' convergence.
Goal - 2.0858
Safe Stop Loss - 2.1029
About Used Indicators:
The pivot point itself is simply the average of the high, low and closing prices from the previous trading day.
Disclosure: I am part of Trade Nation's Influencer program and receive a monthly fee for using their TradingView charts in my analysis.
———————————
WISH YOU ALL LUCK
GBPAUD BEARISHTechnically:
GBPAUD Printed bearish divergence on 1H TF
GBPAUD after printing it's Lower low it retraced and continue to it's bearish direction.
THE PILLARS OF PRICE ACTION - This is what I look for!!!!All the information you need to find a high probability trade are in front of you on the charts so build your trading decisions on 'the facts' of the chart NOT what you think or what you want to happen or even what you heard will happen. If you have enough facts telling you to trade in a certain direction and therefore enough confluence to take a trade, then this is how you will gain consistency in you trading and build confidence. Check out my trade idea!!
tradingview.sweetlogin.com

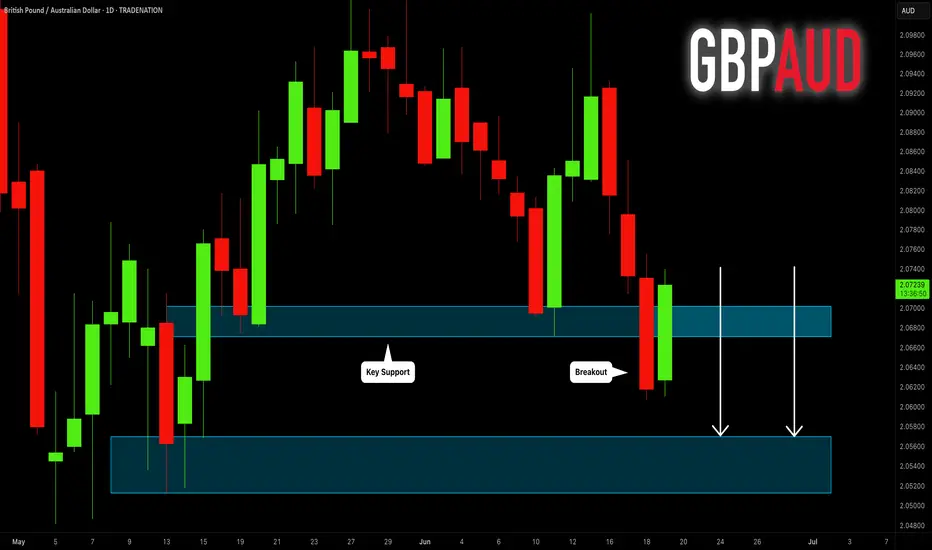
GBPAUD: Important Breakout 🇬🇧🇦🇺
GBPAUD successfully violated a significant daily horizontal
support cluster.
I think that the pair may drop lower after a pullback.
Next key support - 2.057
❤️Please, support my work with like, thank you!❤️
I am part of Trade Nation's Influencer program and receive a monthly fee for using their TradingView charts in my analysis.
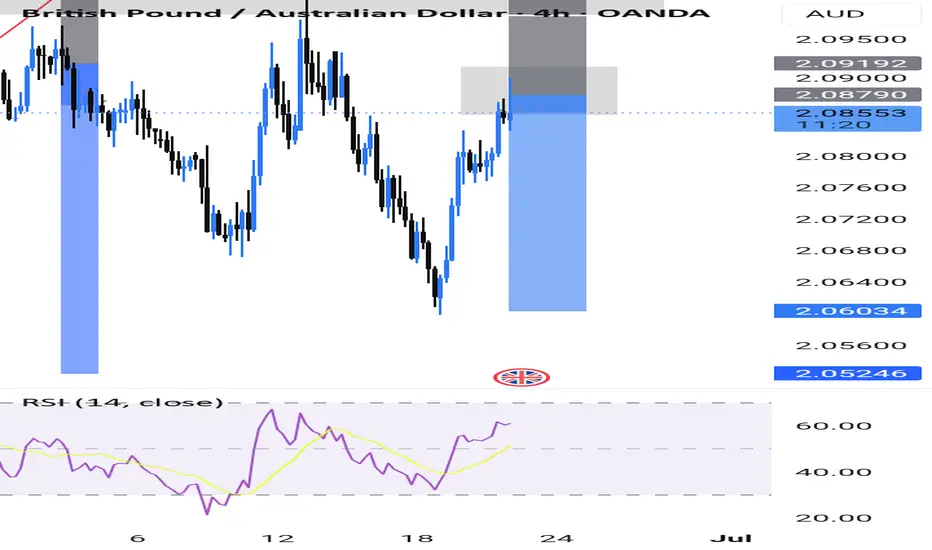
Another short opportunity?This pair is also at a very strong resistance level. Depending on how the next few candles close, this might be a good short opportunity….
Anything could happen. But so far this is looking pretty attractive… waiting on my signal, will history repeat itself? Stay tuned.
This is a 4h chart.
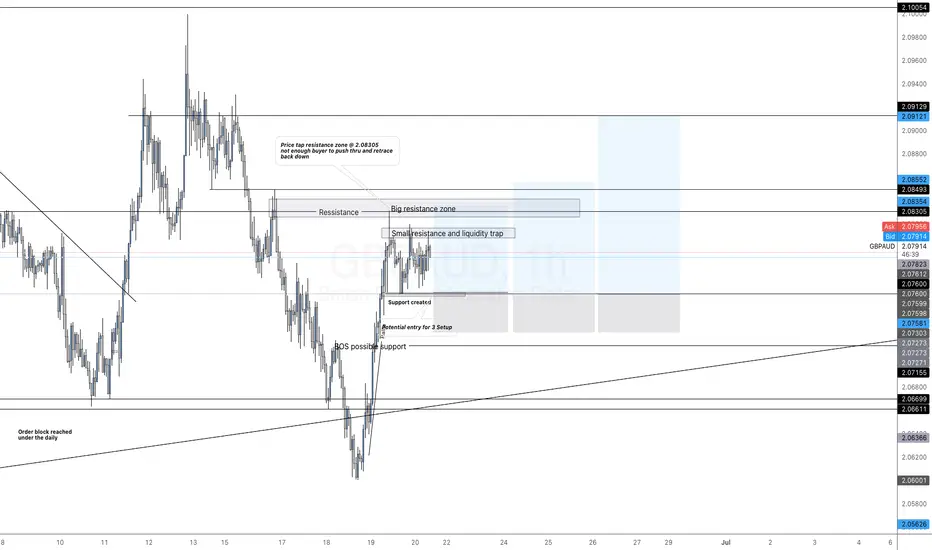
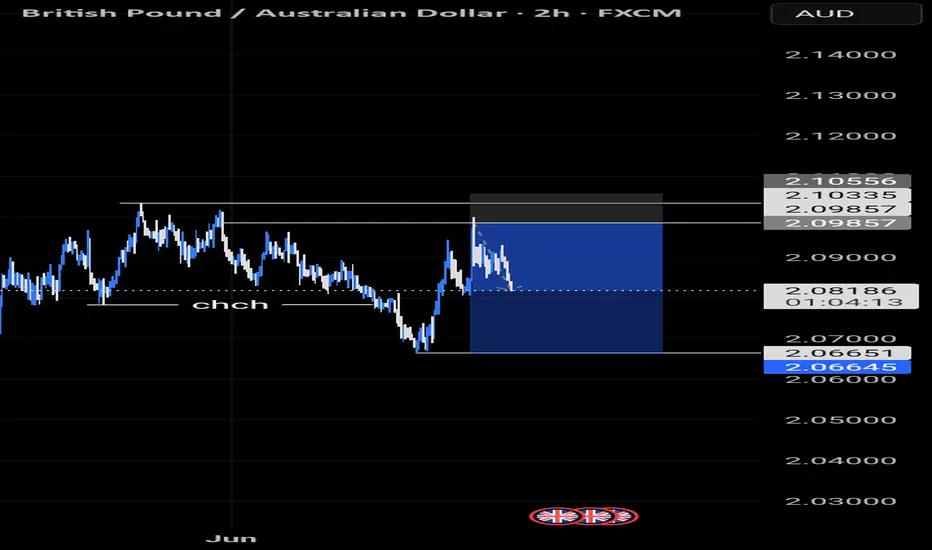
GBP/AUD 1H The pair is currently trading within a consolidation zone after forming a new higher low near the 2.07000 level. I’ve identified a liquidity trap and small resistance zone between 2.07850–2.08050, just below a larger resistance block at 2.08305, where price was previously rejected.
We have a clear break of structure (BOS) suggesting bullish momentum, followed by a support creation and potential re-test zone forming a bullish flag-type structure.
📌 Entry Idea:
I’m watching for a pullback to the 2.07300–2.07000 area (highlighted zone) for a potential long entry (3-tap setup). A bullish engulfing or momentum confirmation in this area would increase confidence.
🎯 Targets:
• TP1: 2.08300 (minor resistance)
• TP2: 2.08800
• TP3: 2.09120 (strong supply/resistance zone from previous rejection)
🛑 Stop Loss:
Below 2.06700 (beneath recent low and BOS confirmation zone)
GBP-AUD Local Short! Sell!
Hello,Traders!
GBP-AUD made a retest of
The horizontal resistance
Of 2.1037 from where we
Are already seeing a bearish
Pullback so we will be
Expecting a further local
Move down
Sell!
Comment and subscribe to help us grow!
Check out other forecasts below too!
Disclosure: I am part of Trade Nation's Influencer program and receive a monthly fee for using their TradingView charts in my analysis.
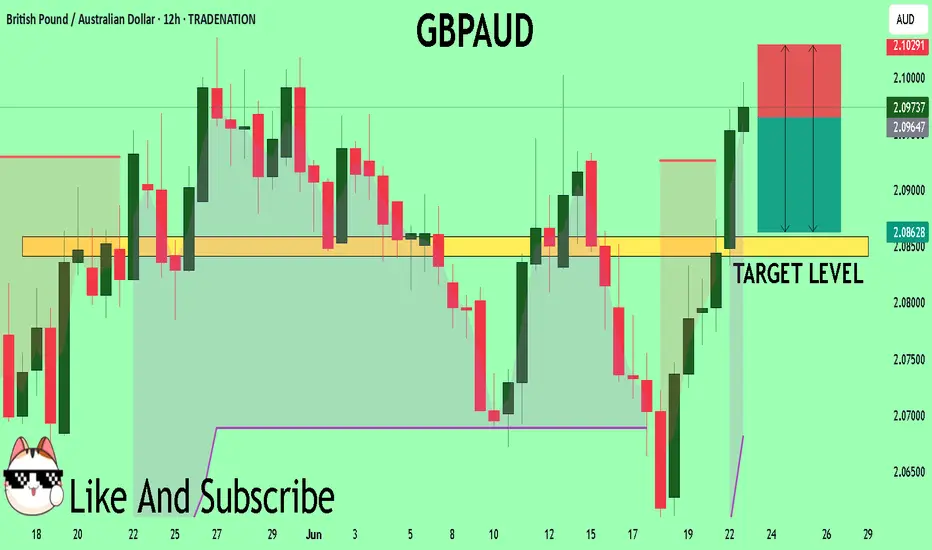
Gbpaud trade update We're also out in profit on gbpaud.
It took awhile also, but our profit target has been hit
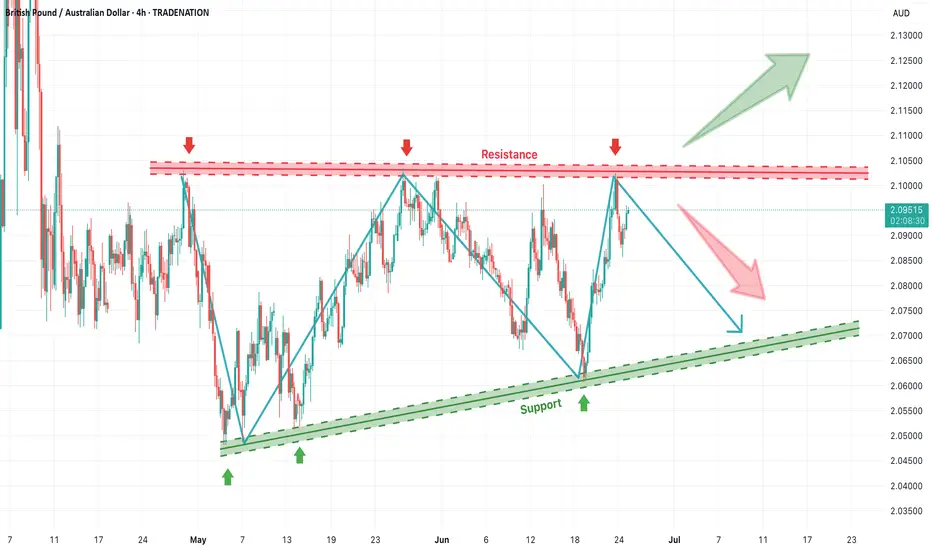
GBP/AUD Triple-Top Resistance Test – Watch for Reversal or BreakThe GBP/AUD pair is currently testing a strong horizontal resistance zone near 2.1000, which has been rejected multiple times in the past. The chart clearly highlights a triple-top formation (marked by red arrows), signaling repeated failures to break above this supply area. Meanwhile, the price action has been respecting an upward trendline support, forming a broad ascending channel or rising wedge-like structure.
This setup is now at a critical juncture — with the potential for either a strong bullish breakout or a bearish reversal.
📉 Bearish Rejection Scenario
If the resistance holds once again, we may see a pullback toward the rising support line around 2.0700. This would maintain the overall sideways-to-bullish bias within the structure. A firm rejection pattern (e.g., bearish engulfing or long upper wick) near 2.1000 could provide confirmation for short entries targeting that support.
📈 Bullish Breakout Scenario
On the other hand, a decisive breakout above 2.1000 — especially with strong volume and candle close — could trigger a breakout rally. If confirmed, the next leg up may drive GBP/AUD toward 2.1250–2.1300, based on the previous swing expansion zones.
🧭 Strategic Outlook
Sell near resistance: Target 2.0750–2.0700 with SL above 2.1020.
Buy on breakout: Enter above 2.1010–2.1025 with targets near 2.1250.
Confirmation required: Wait for candle confirmation (break or rejection) before acting.
This setup offers a clear risk-managed opportunity in either direction, ideal for breakout traders or reversal players.
=================================================================
Disclosure: I am part of Trade Nation's Influencer program and receive a monthly fee for using their TradingView charts in my analysis.
=================================================================
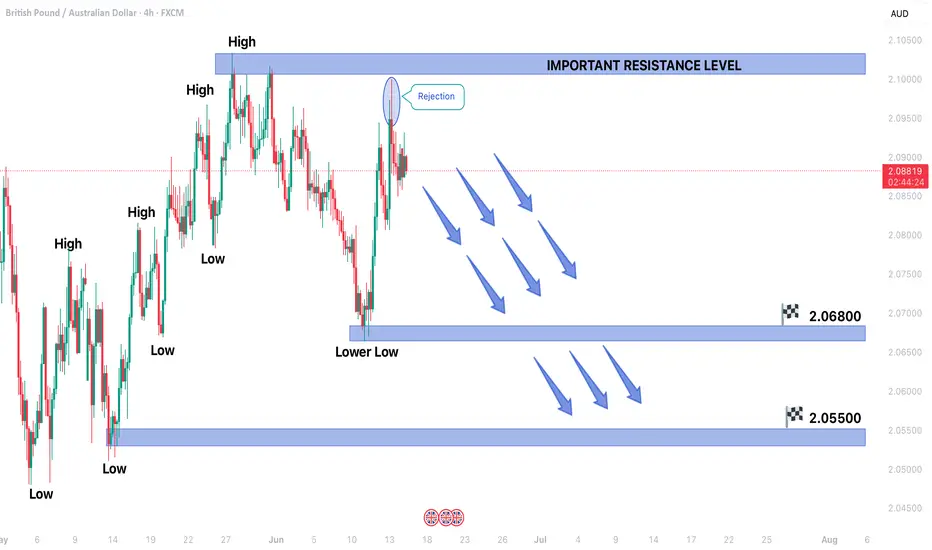
GBPAUD FORMING A DOWNTREND STRUCTUREGBPAUD FORMING A DOWNTREND STRUCTURE IN 4H TIMEFRAME.
Market recently enter into new downtrend by forming a lower low.
Market is rejecting the price near the previous high which in important resistance level.
Price may start forming another primary trend and may remain bearish in upcoming sessions.
on lower side market may hit the targets of 2.06800 & 2.05500.
On higher side market may test the resistance level of 2.10330.
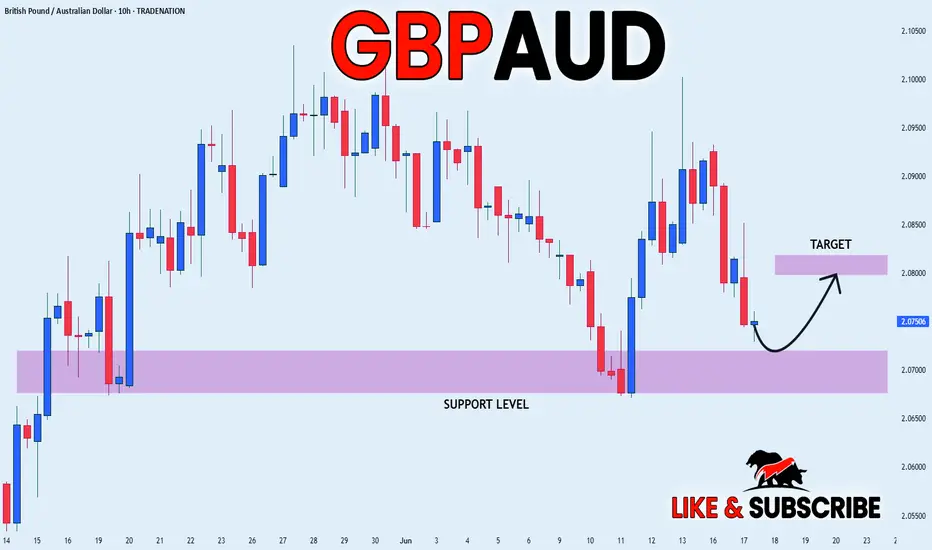
GBP_AUD LONG FROM SUPPORT|
✅GBP_AUD will soon retest a key support level of 2.0700
So I think that the pair will make a rebound
And go up to retest the supply level above at 2.0800
LONG🚀
✅Like and subscribe to never miss a new idea!✅
Disclosure: I am part of Trade Nation's Influencer program and receive a monthly fee for using their TradingView charts in my analysis.
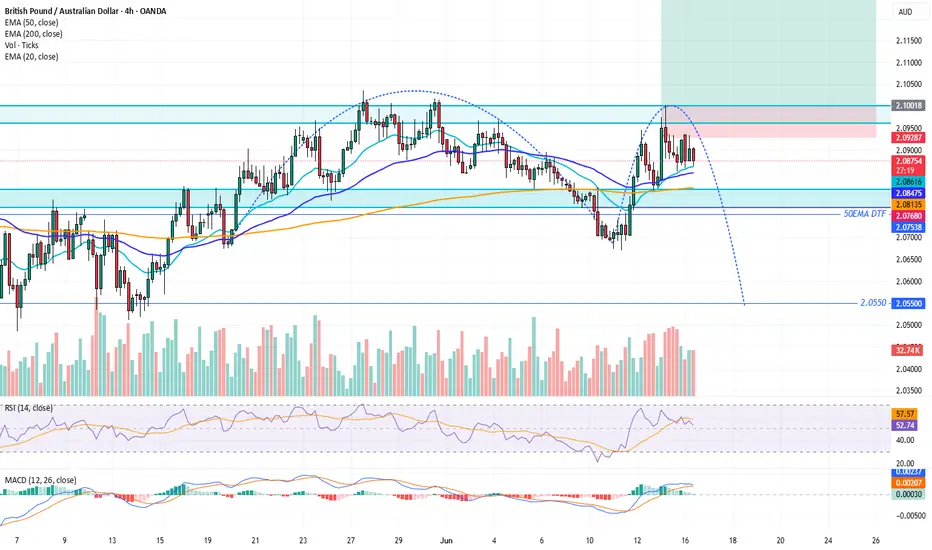
GBPAUD: Potential Head and Shoulders PatternGBPAUD: Potential Head and Shoulders Pattern
GBPAUD is showing a possible Head and Shoulders pattern on the 4-hour timeframe. The pattern suggests a possible trend reversal and a decline in GBP.
The pattern is almost complete, but this week has very low volume and could develop further.
Once the price breaks below the neckline of the pattern, a further decline should occur.
The main targets I am watching:
2.07500; 2.06750 and 2.05500
If the pattern develops as expected, GBPAUD could gradually decline towards the stated targets. However, the strength of this move will depend on market volume and conditions, as well as fundamental factors such as US tariffs or UK economic data.
You may find more details in the chart!
Thank you and Good Luck!
❤️PS: Please support with a like or comment if you find this analysis useful for your trading day❤️
Disclosure: I am part of Trade Nation's Influencer program and receive a monthly fee for using their TradingView charts in my analysis.

GBPAUD Trend UpdateThe trend at 4Hr timeframe is starting to shape as an inverted holder (Inverted cup formation completed).
In addition, on the daily time frame, it shows inverted head and shoulder pattern that I described in my previous post.
Need to keep an eye on the trend pattern , if it breaks below 2.0700 phycological level, the trend will shift to bearish targeting 2.0500 level.
Stay tuned and Good Luck!
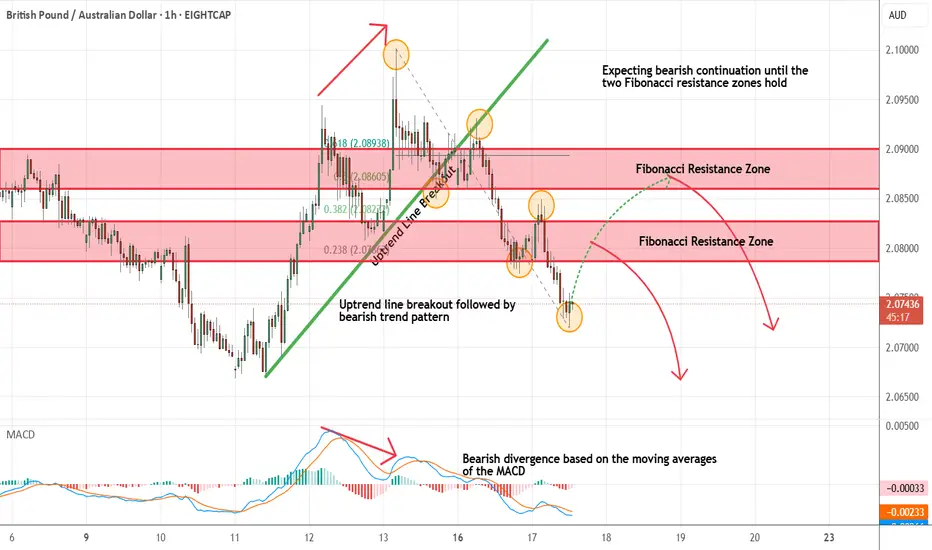
GBPAUD - Expecting Bearish Continuation In The Short TermM15 - Bearish divergence followed by the most recent uptrend line breakout.
Clean bearish trend with the price creating series of lower highs, lower lows.
No opposite signs.
Expecting further continuation lower until the two Fibonacci resistance zones hold.
If you enjoy this idea, don’t forget to LIKE 👍, FOLLOW ✅, SHARE 🙌, and COMMENT ✍! Drop your thoughts and charts below to keep the discussion going. Your support helps keep this content free and reach more people! 🚀
--------------------------------------------------------------------------------------------------------------------
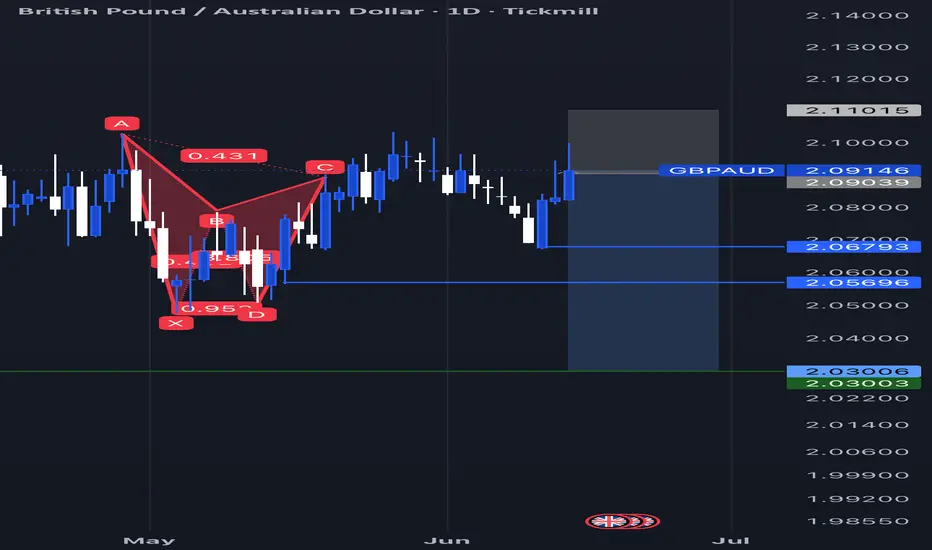
GBPAUD BearishUpon examining the daily chart for GBPAUD, the outlook appears to be bearish, bolstered by the presence of bearish butterfly harmonics that affirm this trend. As I assess the market conditions for the coming week, I am contemplating entering a short position.
For this trade, I am setting my take-profit levels as follows:
- TP1 at 2.06
- TP2 at 2.05
- TP3 at 2.03
To manage risk, I will place my stop-loss at 2.11. This strategy aims to capitalize on the anticipated downward movement while safeguarding against potential reversals.
Bullish Potential for GBPAUDPotential Formation for H&S pattern on the Daily time Frame
Waiting to break the AOI @ 2.100,to go long
GBP/AUD💰Symbol: { GBP/AUD }
🟩Price: { 2.07759 }
🟥Stop: { 2.07087 }
1️⃣profit: { 2.08495 }
2️⃣profit: { 2.09255 }
3️⃣profit: { 2.09955 }
📊Check your chart before entering.
🚨Check before use to make sure there is no important news.🚨

Gbpaud update We're also clear to the downside on gbpaud.
We all have to just manage the trade so as to ensure profits
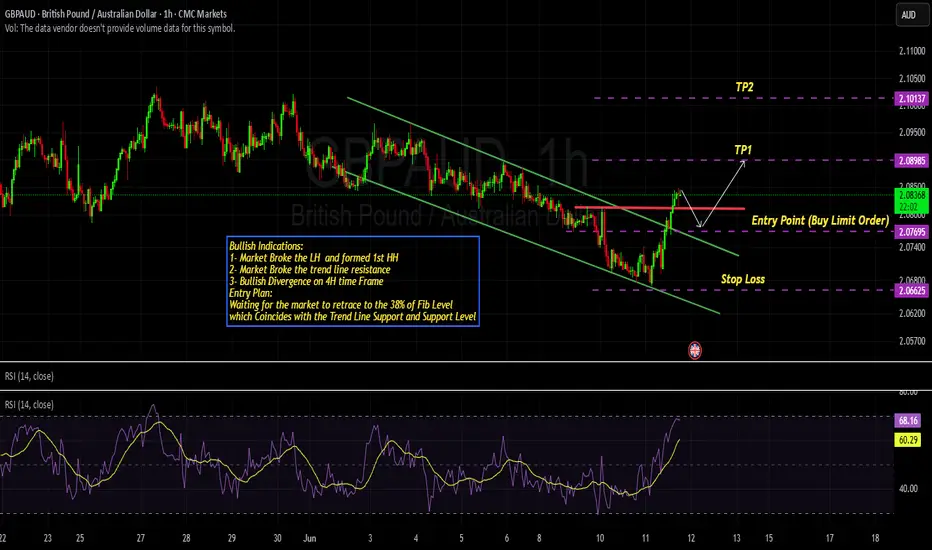
GBPAUD - Bullish BIAS Bullish Indications:
1- Market Broke the LH and formed 1st HH
2- Market Broke the trend line resistance
3- Bullish Divergence on 4H time Frame
Entry Plan:
Waiting for the market to retrace to the 38% of Fib Level
which Coincides with the Trend Line Support and Support Level