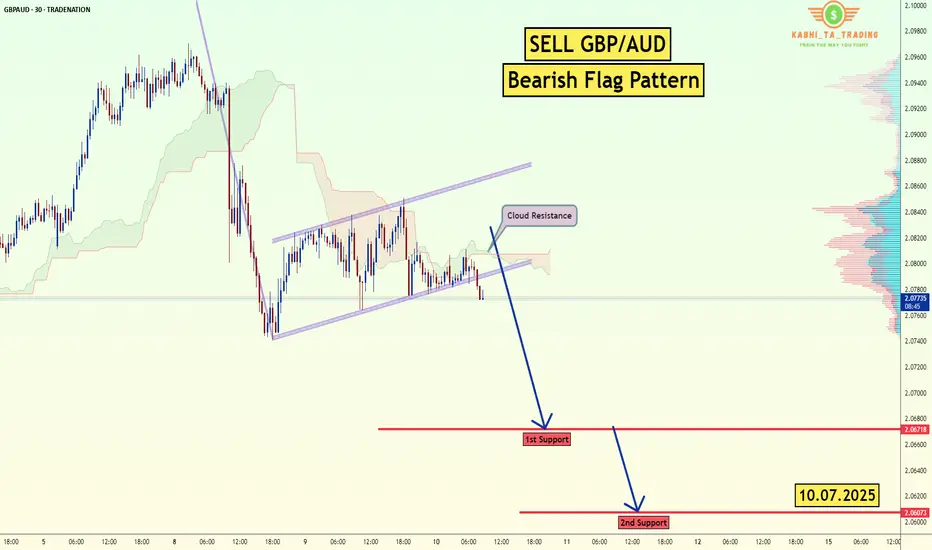
GBP/AUD - Bearish Flag (10.07.2025)The GBP/AUD Pair on the M30 timeframe presents a Potential Selling Opportunity due to a recent Formation of a Bearish Flag Pattern. This suggests a shift in momentum towards the downside in the coming hours.
Possible Short Trade:
Entry: Consider Entering A Short Position around Trendline Of The Pattern.
Target Levels:
1st Support – 2.0671
2nd Support – 2.0607
🎁 Please hit the like button and
🎁 Leave a comment to support for My Post !
Your likes and comments are incredibly motivating and will encourage me to share more analysis with you.
Best Regards, KABHI_TA_TRADING
Thank you.
Disclosure: I am part of Trade Nation's Influencer program and receive a monthly fee for using their TradingView charts in my analysis.
GBPAUD trade ideas
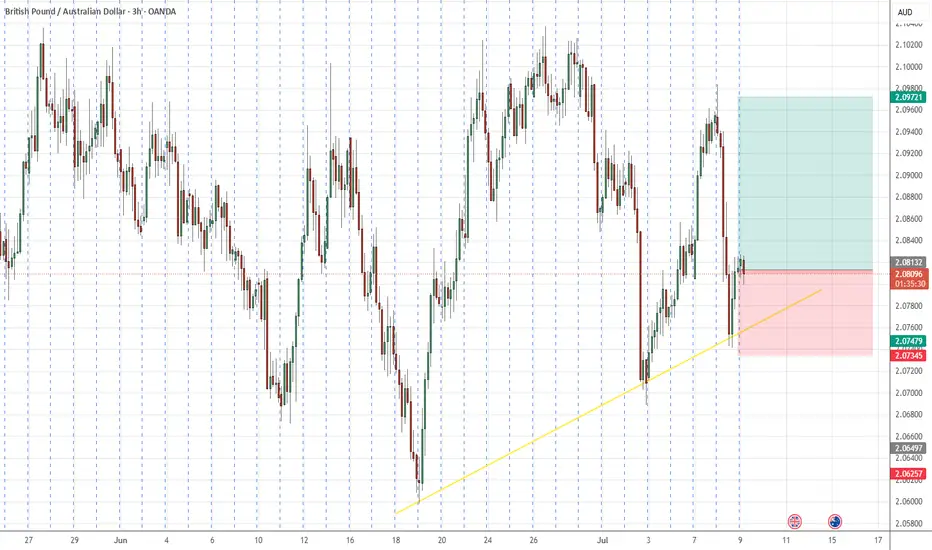
GBPAUD Buy opportunity! It is time to buy GBPAUD . Nice trendline support and rejection and bounced back from a strong support area as well. 1:2 risk rewards. You can take first tp @ 1:1 position and last one is @1:2. do not risk more than 1% from the account.
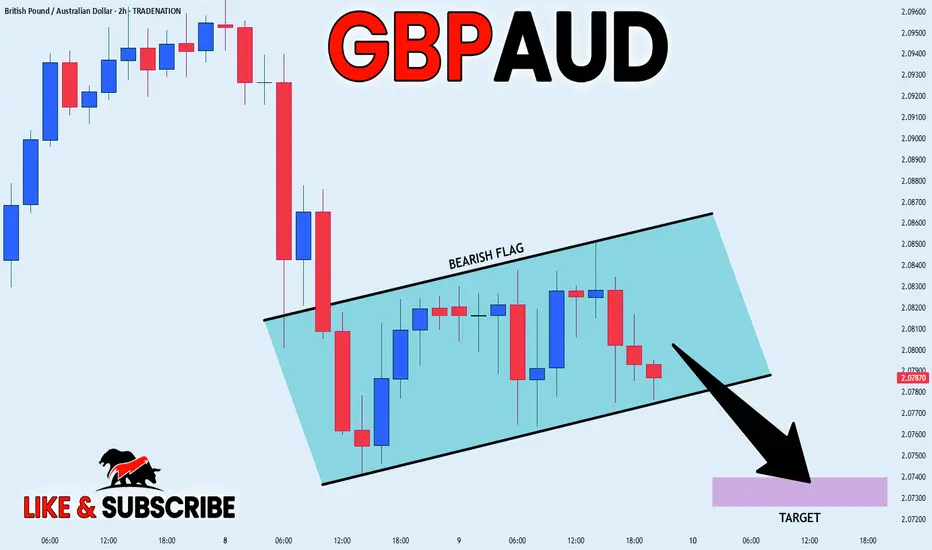
GBP_AUD BEARISH FLAG|SHORT|
✅GBP_AUD is going down now
And the pair has formed
A bearish flag pattern
Which makes me bearish biased
And after the breakout
I believe we will see bearish continuation
SHORT🔥
✅Like and subscribe to never miss a new idea!✅
Disclosure: I am part of Trade Nation's Influencer program and receive a monthly fee for using their TradingView charts in my analysis.
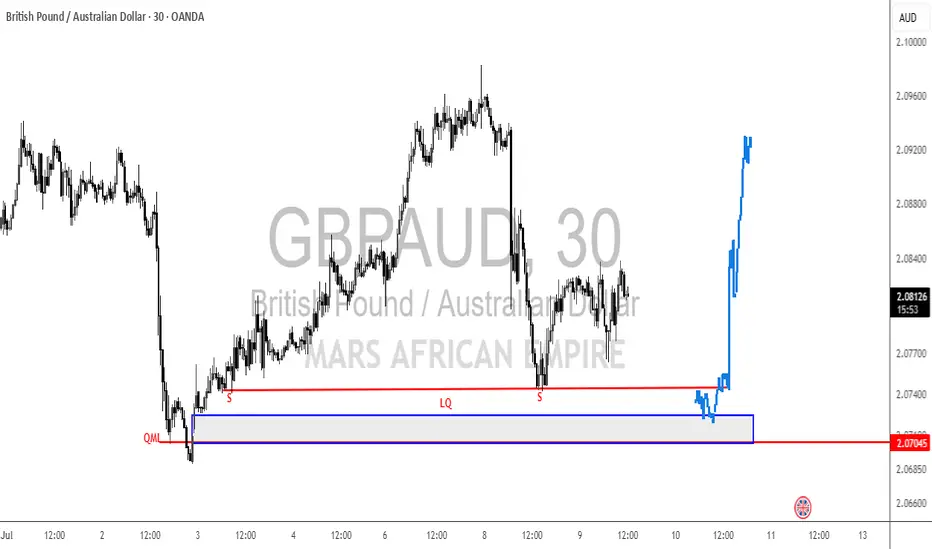
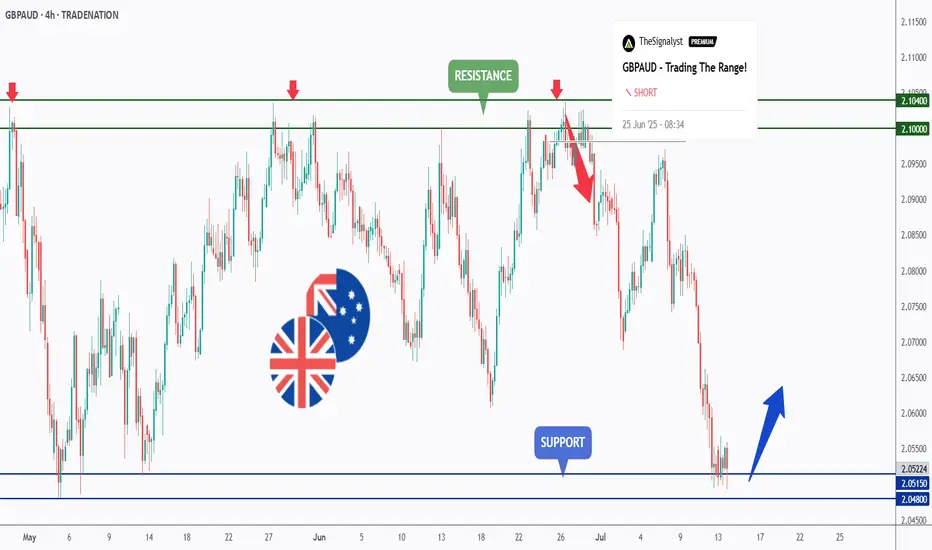
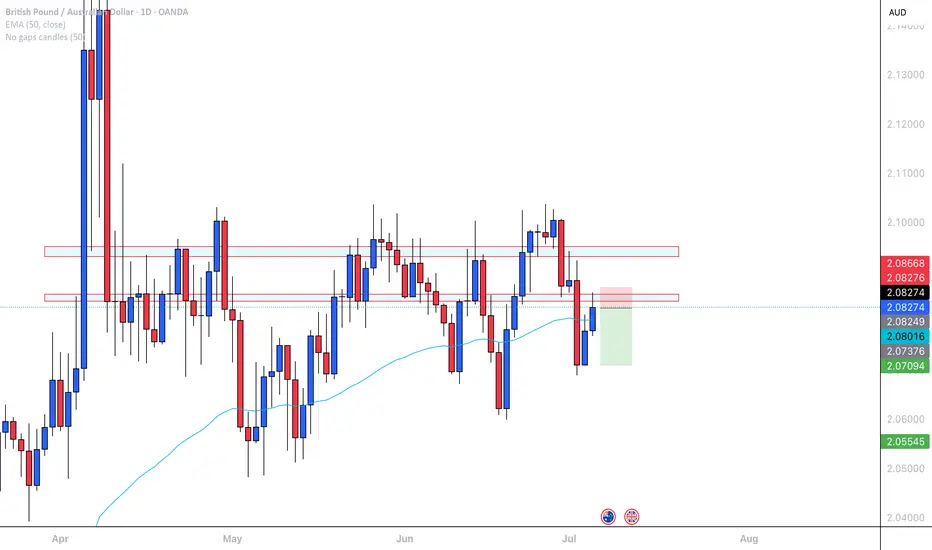
GBPAUD - Trading The Range - AGAIN!Hello TradingView Family / Fellow Traders. This is Richard, also known as theSignalyst.
📈GBPAUD has been hovering within a big range.
Last week, as per our previous analysis, GBPAUD rejected the upper bound of the range and traded lower.
This week, GA is retesting the lower bound of the range acting as a support.
As long as the support holds, we will be looking for longs on lower timeframes, targeting the upper bound of the range.
📚 Always follow your trading plan regarding entry, risk management, and trade management.
Good luck!
All Strategies Are Good; If Managed Properly!
~Rich
Disclosure: I am part of Trade Nation's Influencer program and receive a monthly fee for using their TradingView charts in my analysis.
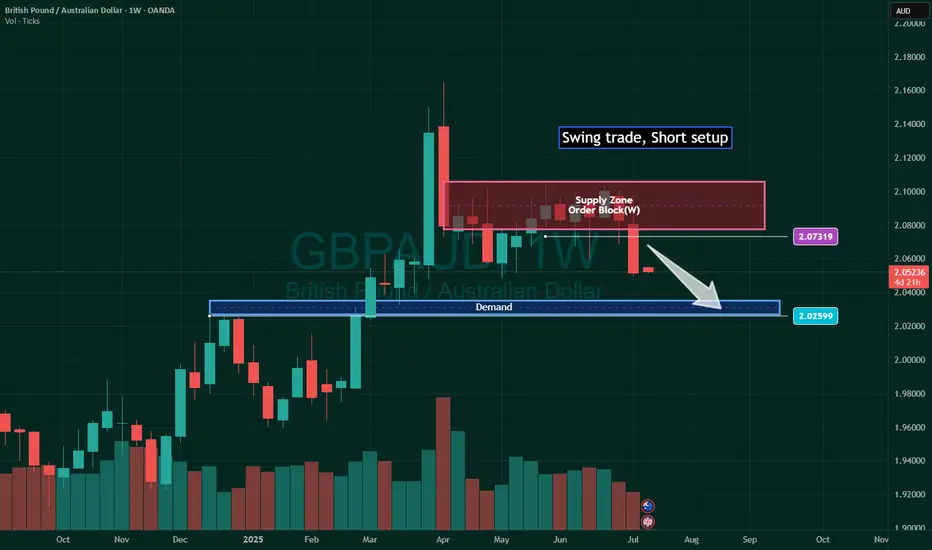
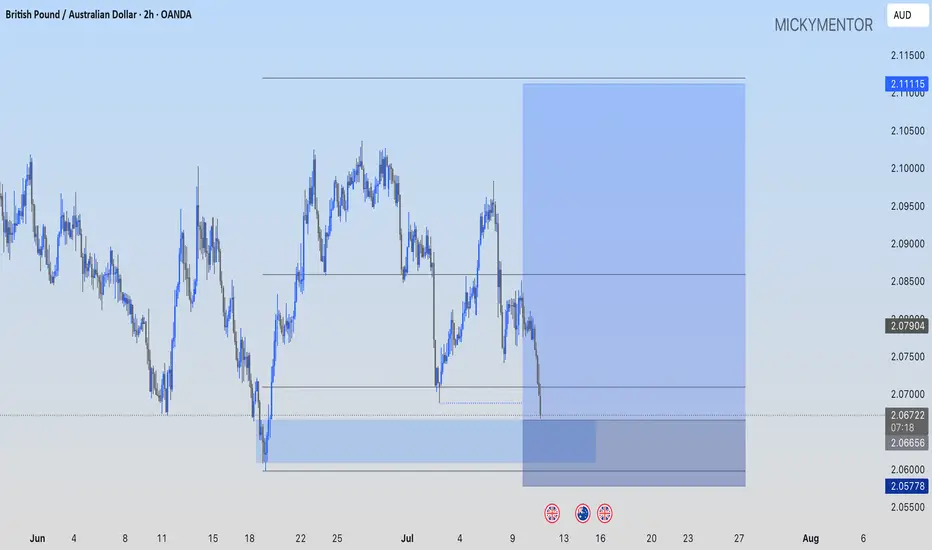
GBPAUD Weekly Chart Short setup for Swing trade💫Hello Traders, here is a new ICT Short setup in GBPAUD weekly chart.
This idea can be used for Swing trade and intraday trade main direction.
We expect GBPAUD will land on a Swing high marked by the blue Demand Zone.
Good luck.💝
GBP/AUD Tests 2.048 for Potential ReboundFenzoFx—GBP/AUD is testing the critical support level at 2.048, coinciding with the VWAP. From a technical perspective, a bullish move toward an upper resistance level is likely.
In this scenario, GBP/AUD has the potential to test the bearish FVG at approximately 2.070. Please note that the bullish outlook should be invalidated if GBP/AUD falls and stabilizes below 2.048.
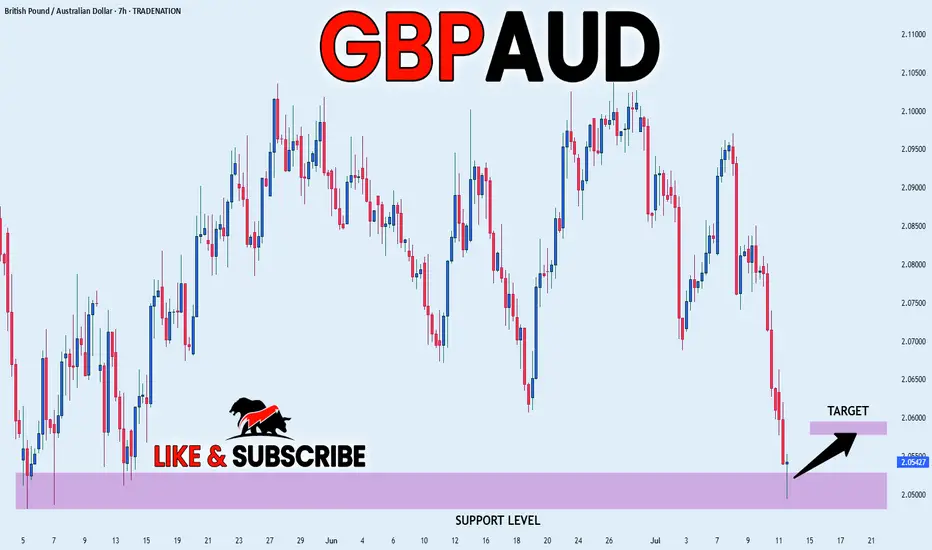
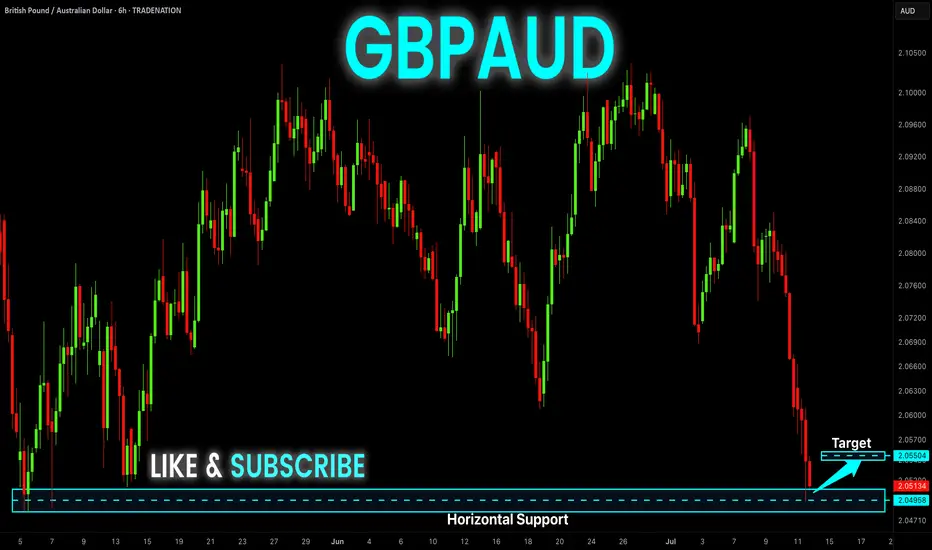
GBP_AUD LONG FROM SUPPORT|
✅GBP_AUD fell down sharply
But a strong support level was hit at 2.0500
Thus I am expecting a rebound
And a move up towards the target of 2.0580
LONG🚀
✅Like and subscribe to never miss a new idea!✅
Disclosure: I am part of Trade Nation's Influencer program and receive a monthly fee for using their TradingView charts in my analysis.
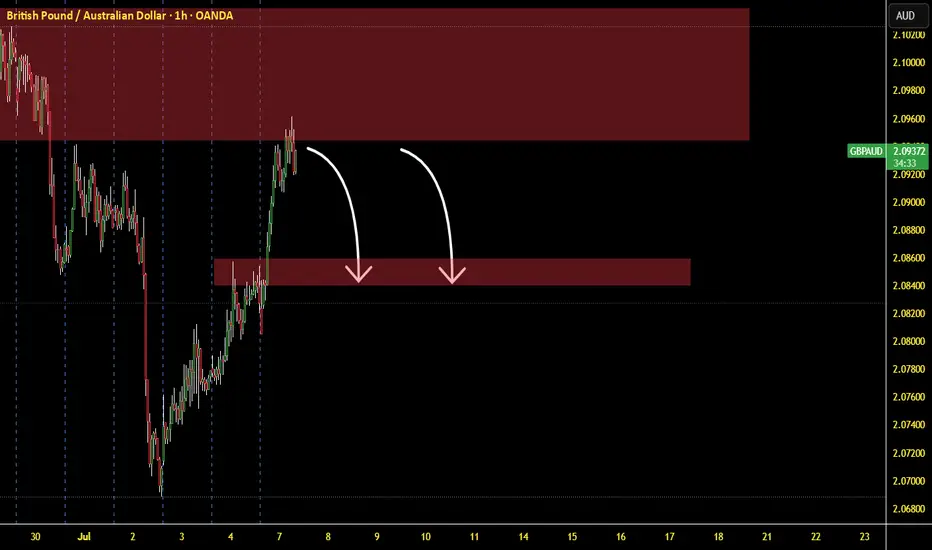
GBP/AUD Trade Setup – Short Bias📉 GBP/AUD Trade Setup – Short Bias
🕒 Timeframe: 1H
📍 Entry Zone: 2.09300–2.09400
🎯 Target Zone: 2.08400
🔍 Analysis:
Price is rejecting a key supply zone after a strong impulsive move. I'm anticipating a return to the previous demand area around 2.08400.
📌 Arrows indicate possible retracement entries within the supply zone for optimal short execution. Watch for bearish confirmation on LTF.
📲
#GBP #FXTrade #GBPUSD #SupplyAndDemand #PriceAction #ForexSignals #SellSetup
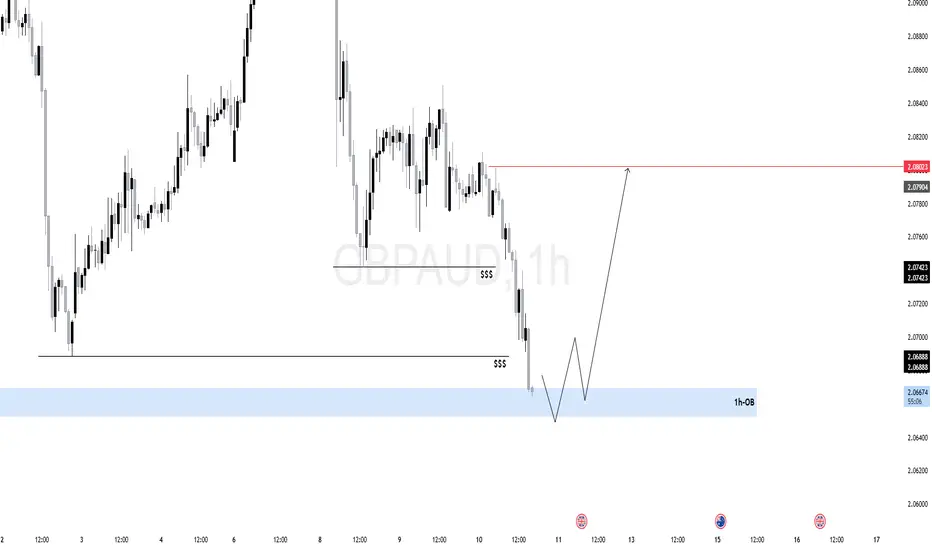
$GA (GBPAUD) 1HIf price holds and reacts from the OB, expect a short-term bullish leg toward:
Internal liquidity first (2.07400), Then external buy-side liquidity above 2.08000.
Price has been in a clear bearish structure, printing lower highs and lower lows.
Recently, price swept multiple layers of internal liquidity (marked as $$$) before tapping into a key Order Block (OB) just above the 2.06500 zone.
The OB zone aligns with a higher timeframe demand area, suggesting this could be a reaccumulation phase.
The OB zone has previously led to strong expansions, making it a valid area for institutional re-entry.
The current liquidity grab beneath the previous lows appears intentional — a trap for breakout sellers.
Smart money often waits for such sweeps to absorb sell-side liquidity before shifting the structure.
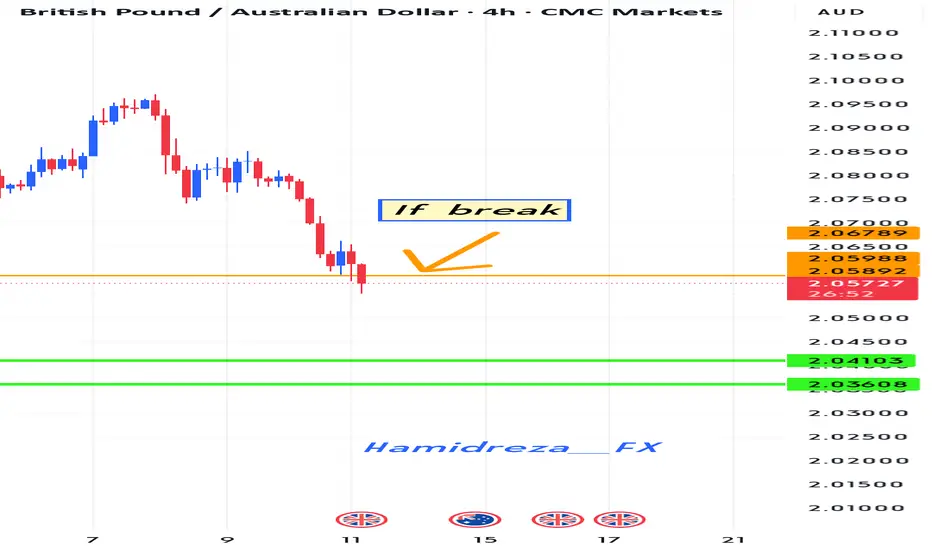
Is the currency GBPAUD depreciating?
Hi dears
I think that if the colored trend line is broken, the downtrend will probably continue until it reaches the target.
Thank you for supporting me by liking, commenting, and subscribing.
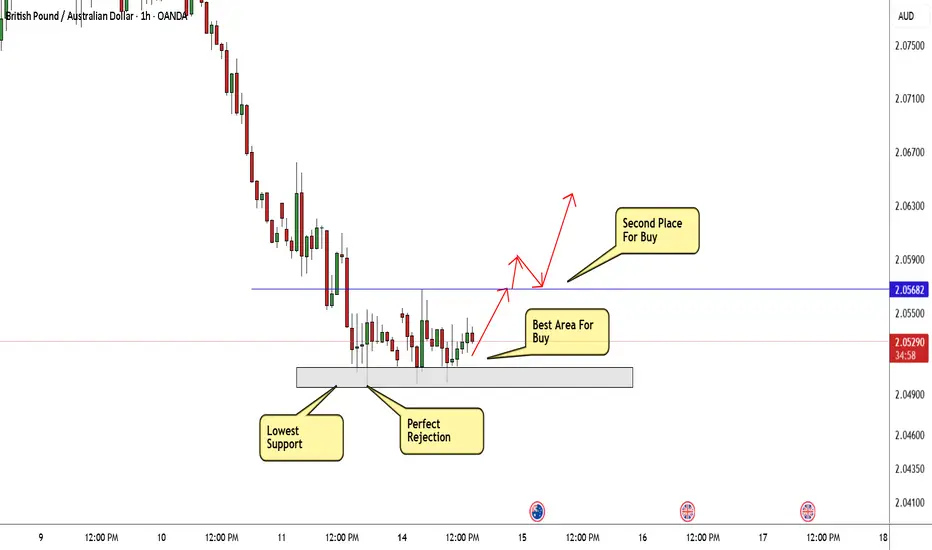
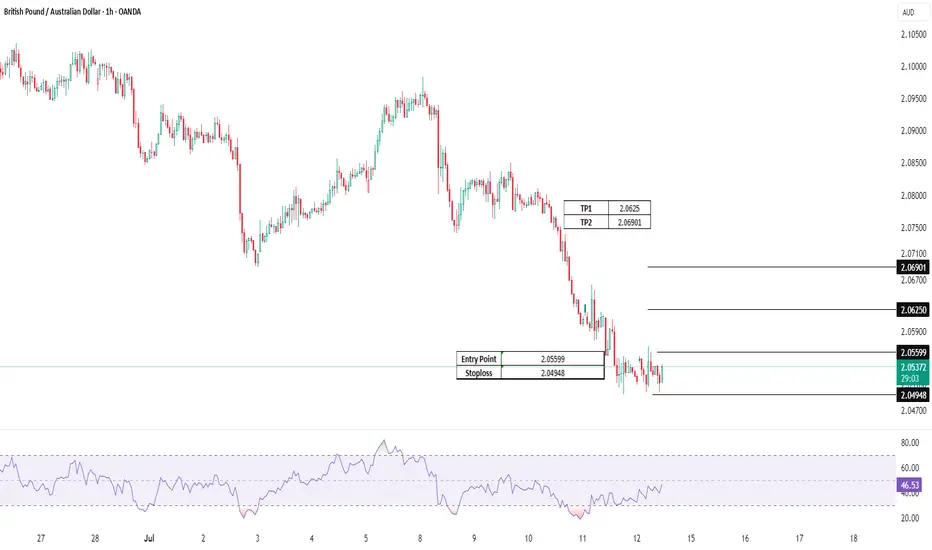
GBP/AUD Ready To Go Up After Melted , 2 Entries Valid !Here is my GBP/AUD 1H Chart and this is my opinion , the price moved very hard to downside without any correction and the price at strong support now 2.05000 which is forced the price many times to go up , so it`s my best place to enter a buy trade , and if you checked the chart you will see the price now creating a reversal pattern and i put my neckline and if we have a closure above it to confirm the pattern we can enter another entry to increase our contracts . if we have a daily closure below my support area then this idea will not be valid anymore .
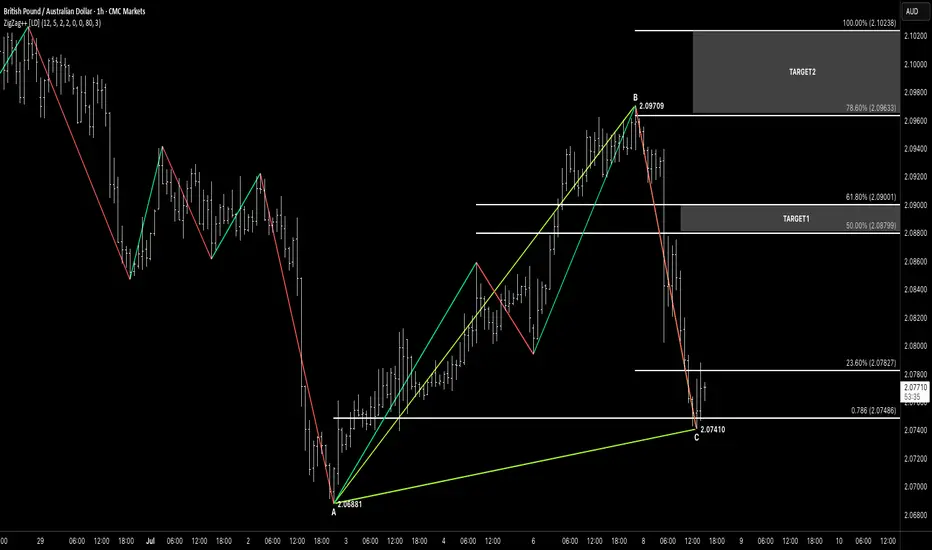
ABCHey traders, hope you’re crushing it this week! 🚀
Just spotted a clean ABC Bullish setup on the GBP/AUD 1-Hour chart. Here’s the breakdown:
🧠 Pattern Breakdown
A→B (Impulse Up): 2.06881 → 2.09709
B→C (Retrace Down): 2.09709 → 2.07410
Point C landed right on our rising A→C trendline and just under the 78.6% Fib of A→B (~2.07486)—double confluence!
✅ Why This Works
ABC Structure: Clear impulse then corrective leg into support
Trendline Support: A→C line guiding our C pivot
Fib Confluence: C sits in the 23.6%–78.6% zone of A→B (2.07827–2.07486)
⚔️ Trade Plan
Entry: Long after an hourly close above 2.07827 (23.6% level), ideally within 2.07827–2.07410 (PCZ)
Stop-Loss: Just below point C at 2.07410 (e.g. 2.07380)
Size: Keep risk sensible—1–2% of your account
🎯 Profit Targets
T1: 50% retrace of B→C → 2.08799 (take partial)
T2: 61.8% retrace → 2.09001
T3: 78.6% retrace → 2.09633–2.10238
🔍 Confirmation & Invalidation
Confirm: Look for a bullish pin-bar or engulfing candle closing above 2.07827 before entering
Invalidate: If price dips below 2.07410 (point C), scrap the idea—this setup needs that level to hold
💡 Keep It Simple:
ABC → PCZ → 23.6% close → Trigger → Ride.
Let the chart guide you, not your emotions, and watch for any GBP/AUD news for extra context.
Here’s to tight stops, smart entries, and smooth profits! ✌️
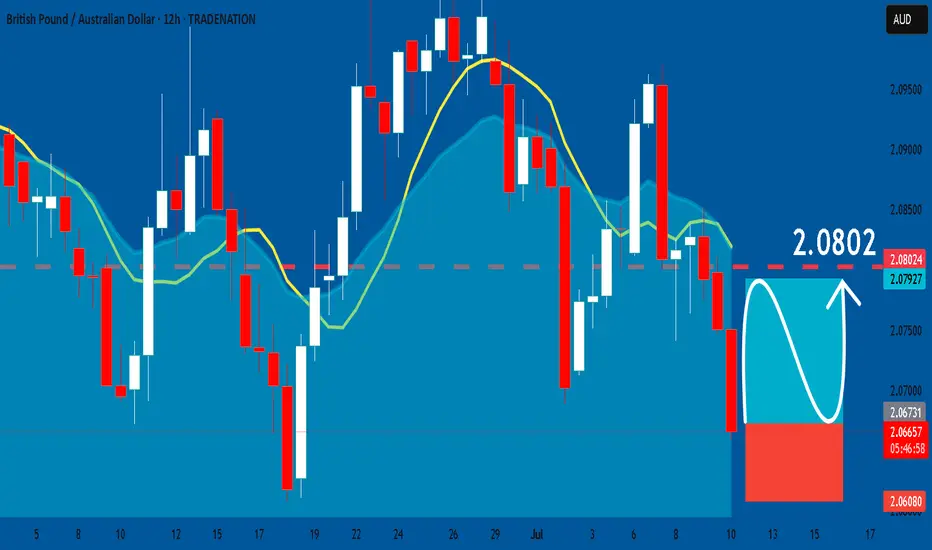
GBPAUD: Long Trade Explained
GBPAUD
- Classic bullish formation
- Our team expects growth
SUGGESTED TRADE:
Swing Trade
Buy GBPAUD
Entry Level - 2.0672
Sl - 2.0608
Tp - 2.0802
Our Risk - 1%
Start protection of your profits from lower levels
Disclosure: I am part of Trade Nation's Influencer program and receive a monthly fee for using their TradingView charts in my analysis.
❤️ Please, support our work with like & comment! ❤️
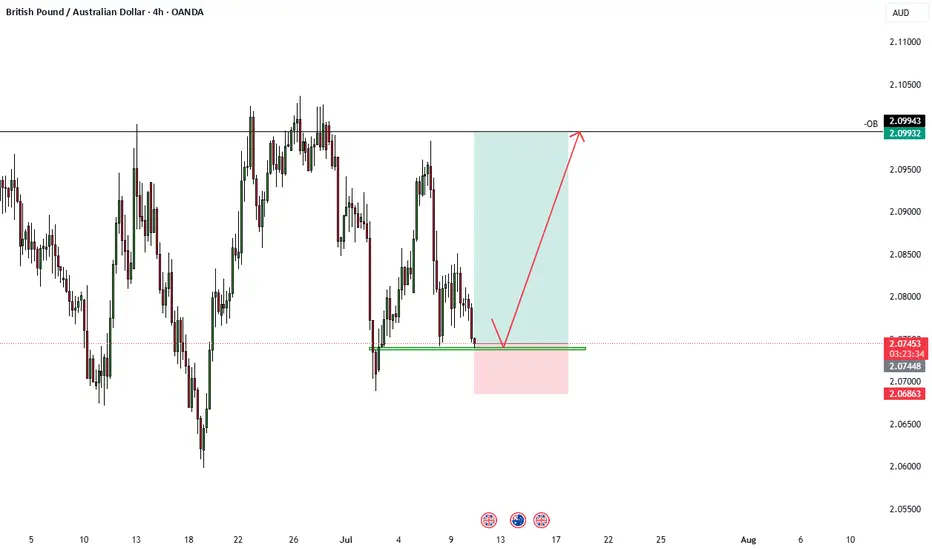
GBPAUD 1:4.25 Trade Idea - ICT1:4.25 Trade Idea on GBPAUD, bullish on the pair looking good to re-test the -OB on the daily.
GBP-AUD Risky Long! Buy!
Hello,Traders!
GBP-AUD keeps falling and
The pair is locally oversold
So as the pair is retesting
The horizontal support
Of 2.0480 we will be expecting
A local bullish correction
On Monday
Buy!
Comment and subscribe to help us grow!
Check out other forecasts below too!
Disclosure: I am part of Trade Nation's Influencer program and receive a monthly fee for using their TradingView charts in my analysis.
GBPAUD: Bounce-and-Fill into 2.0830
Price just tagged 2.0731 the former ceiling that’s now acting as intraday support, and printed a clean rejection wick. If that level holds, I’m looking for bulls to squeeze us back toward the 2.0810-2.0830 supply zone . From there, I’ll watch for fresh sell signals. Bias flips only if 2.0731 breaks convincingly.

GBPAUD Pre-Market Analysis📉 GBPAUD Pre-Market Analysis – Weekly Outlook
Date: July 13, 2025
Session: Pre-London Open
Analyst: Papalui | Sub Saharan Technicals
🕵️♂️ Macro Outlook
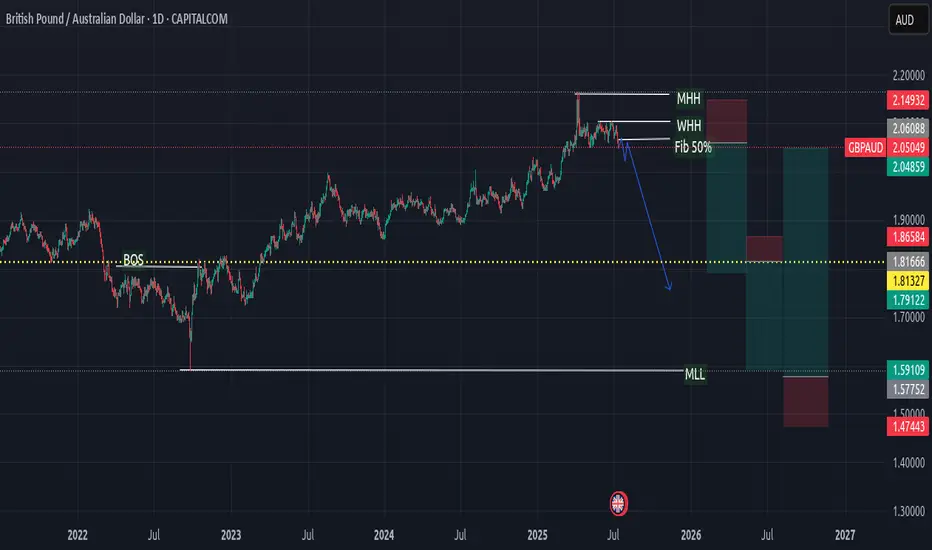
The British Pound / Australian Dollar (GBPAUD) is currently showing signs of trend exhaustion after reaching major highs around the 2.14932 zone (Marked MHH – Most Recent Higher High). A strong bearish reaction is emerging from this area, suggesting potential for long-term downside retracement or even a reversal.
🔍 Technical Structure Breakdown (1W)
MHH (Major Higher High): 2.14932
WHH (Weekly Higher High): 2.06088
Current Price: 2.05049
Fib 50% Level: Aligned around recent resistance and acting as a pivot zone.
BOS (Break of Structure): Occurred in early 2022, later invalidated by strong bullish rally.
MLL (Major Lower Low Target Zone): Projected zone around 1.59109 - 1.57752
📉 Bearish Scenario: Reversal Play
🔽 Bias: Bearish Reversal
Context: Price has formed a new high but is rejecting near the 50% Fibonacci retracement and supply zone.
Plan: Watch for lower timeframe confirmations (e.g., D1 or H4 structure breaks) below 2.04859 to initiate short positions.
Target Zones:
TP1: 1.86584
TP2: 1.81327
TP3: 1.59109 – aligning with weekly demand and structural lows
🔧 Invalidation: A sustained weekly close above 2.14932 would invalidate this bearish scenario and signal bullish continuation.
🔁 Trade Management Zones
Zone Type Action
2.06088 - 2.14932 Supply/Resistance Monitor for rejections or confirmations of reversal
1.86584 - 1.81327 Intermediate Support Partial TP or structure reassessment
1.59109 Major Demand Full TP / Trend reversal opportunity
🧠 Sentiment & Strategy
This pair has rallied over the past year, but the bearish impulse from the recent high suggests large players may be unloading positions. With key Fibonacci confluence and price action showing weakness, the current zone is a strong sell interest region. Traders should:
Stay alert for weekly or daily lower lows
Use smaller timeframes to refine entries
Avoid premature entries before price confirms lower timeframe structure breaks
📌 Summary
Bias Key Resistance POI Bearish Target
Bearish 2.14932 2.04859 1.59109
Risk Disclosure:
All trading involves risk. This analysis is for educational purposes only and should not be taken as financial advice. Always manage risk appropriately.
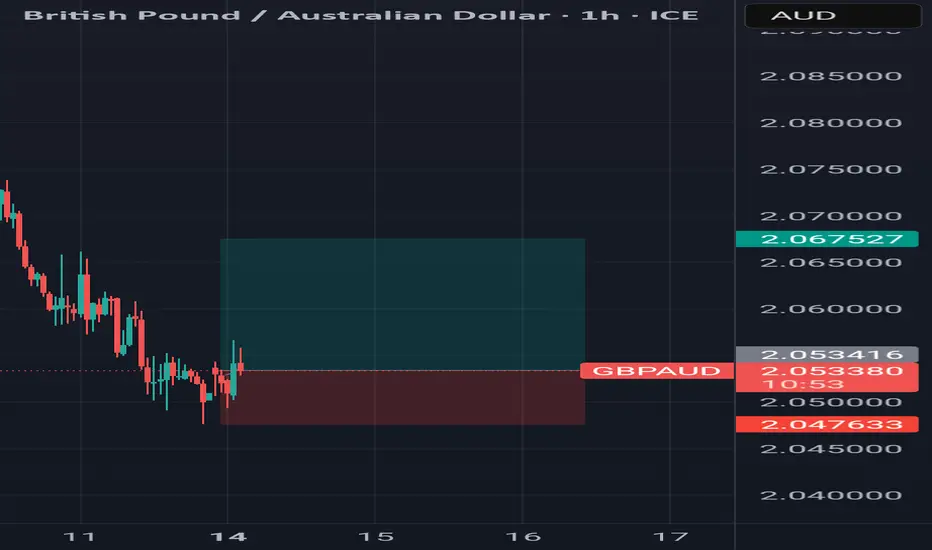
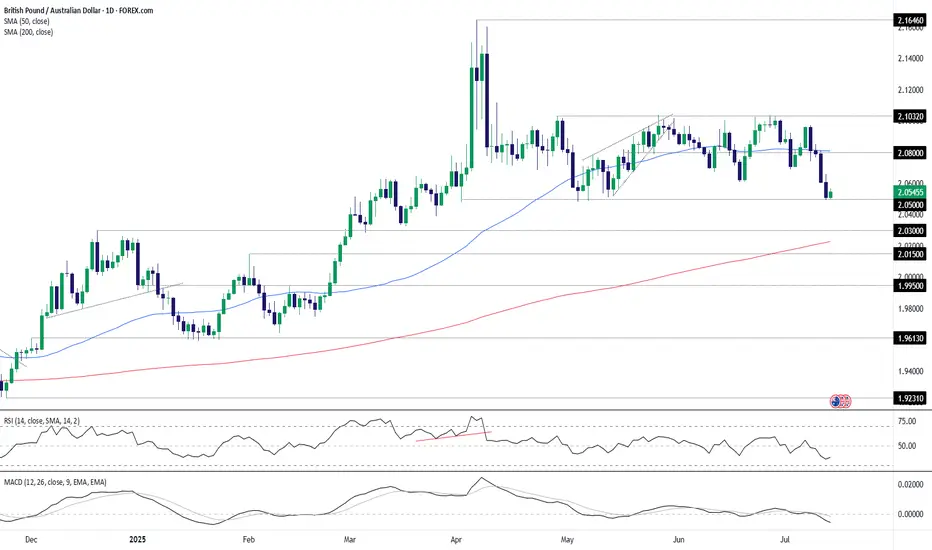
GBP/AUD: Familiar support holds as global growth fears biteThe bearish unwind in GBP/AUD stalled in familiar territory, bouncing from 2.0500 in Asian trade, continuing the pattern seen since April when Donald Trump first unveiled reciprocal tariff rates on U.S. trading partners. Now, like then, the bounce likely reflects concern about the outlook for the global economy following the unveiling of 30% tariff rates on E.U. imports entering the United States from August 1. The headline-driven nature of the move overrides the deeply bearish message coming from momentum indicators like RSI (14) and MACD.
If the pair were to move towards 2.0500 again, it would create a decent long setup where positions could be established above the level with a stop beneath for protection. 2.0600 and 2.0700 screen as possible targets, although the most appealing target would be 2.0800 from a risk-reward perspective—that level has seen plenty of work either side of it over recent months and has the 50-day moving average located just above.
If the pair were to reverse back through 2.0500 and close there, the bullish setup would be invalidated, opening the door for bearish trades to be set targeting support at 2.0300.
Good luck!
DS
Tap and goWe might see this guy tapping on that POI after taking out that previous low, then push up