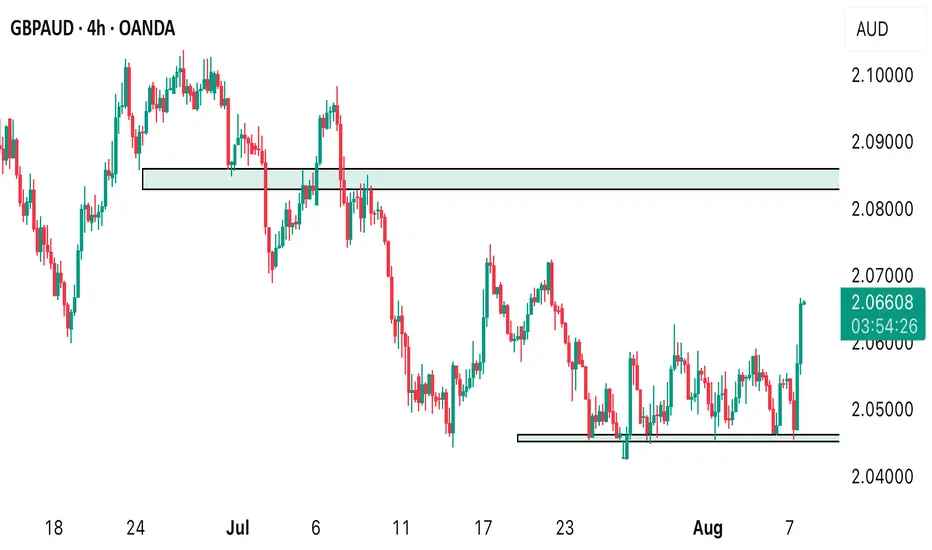
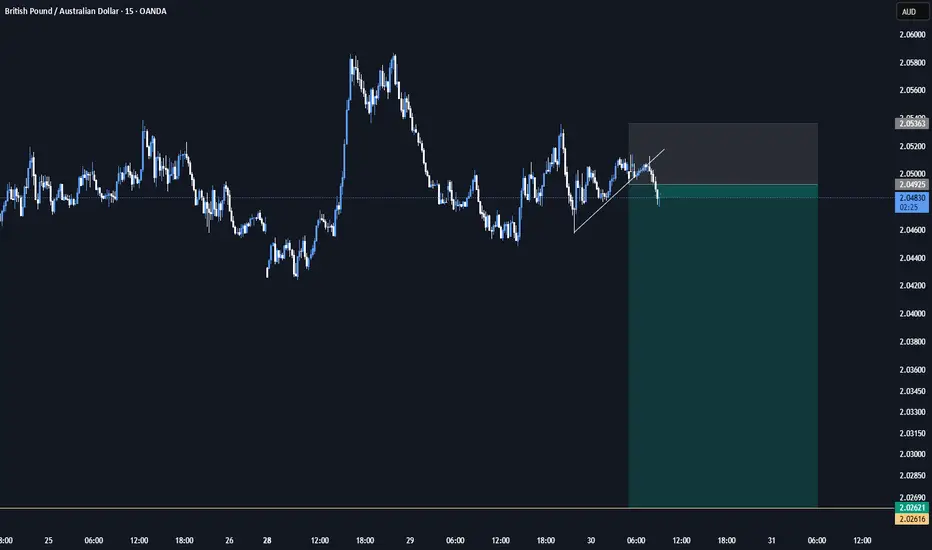
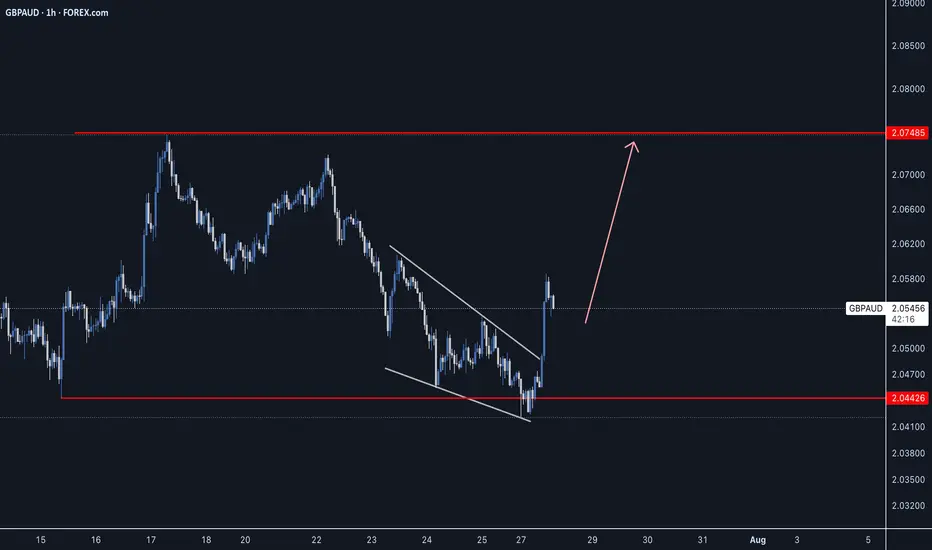
GBP AUD Price is showing strong signs of accumulation near the 2.0450–2.0470 demand zone, forming a clean range low sweep + BOS (Break of Structure).
🔹 Area of Interest: Watching for a retracement back into the marked zone for a potential long setup.
🔹 Confirmation: Break of structure confirmed at ~2.0535
🔹 Stop: Below the sweep low (~2.0420)
🔹 Target: Above previous supply zone (~2.0650–2.07), expecting a strong impulsive leg up if momentum sustains.
GBPAUD trade ideas
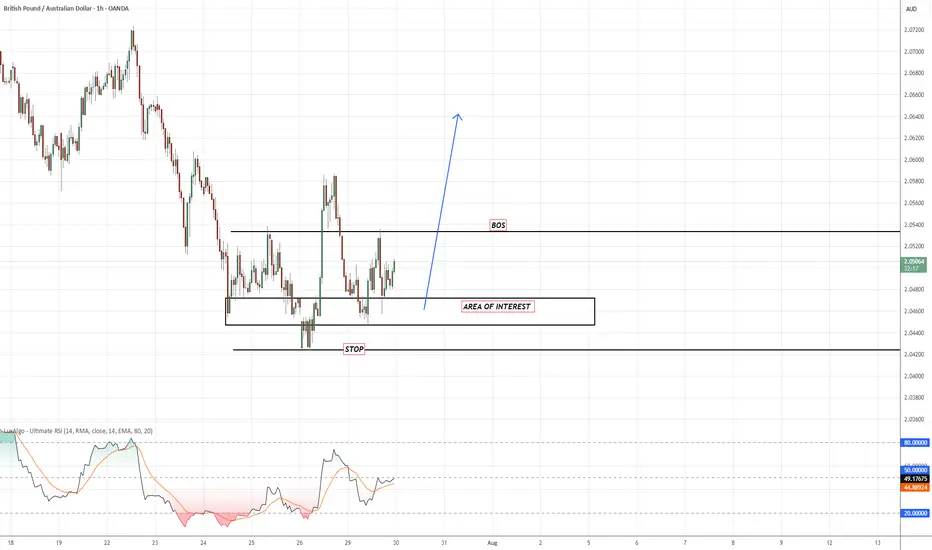
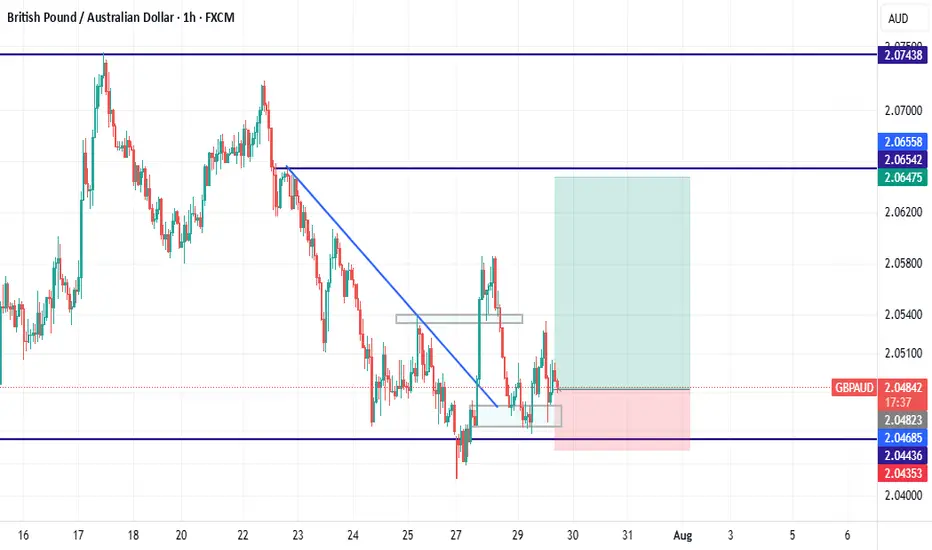
GBPAUD 2H – Clean Breakout SetupGBPAUD 2H – Clean Breakout Setup
Price has broken out of a descending channel and is retesting structure. Demand zone held firm, and bullish momentum is building.
Setup by PULSETRADESFX
T g.
#ForexSignals #GBPAUD #BreakoutTrade #RiskManagement #PulseTradesFX
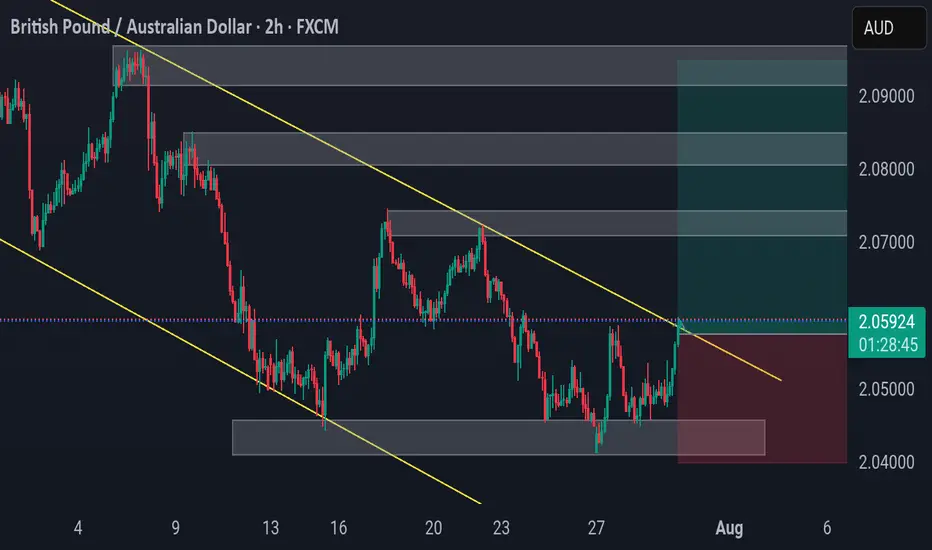
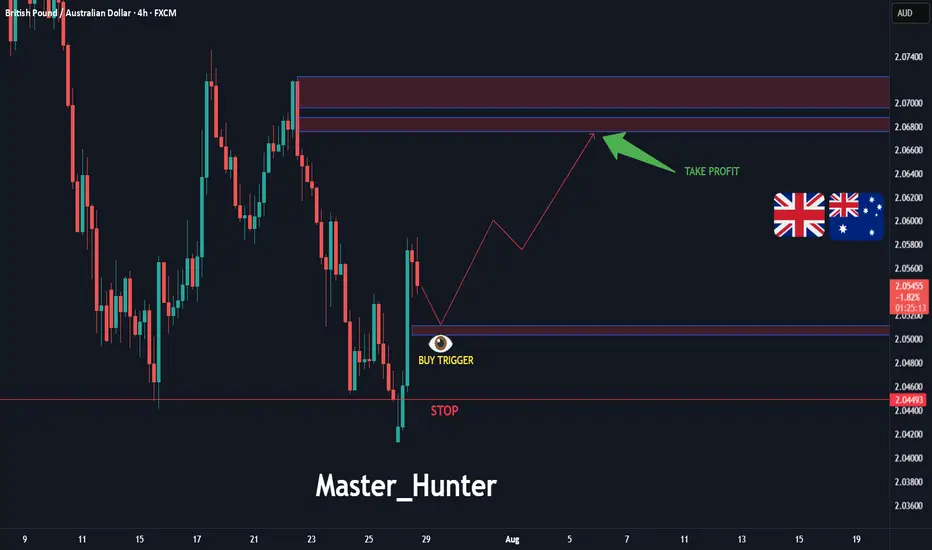
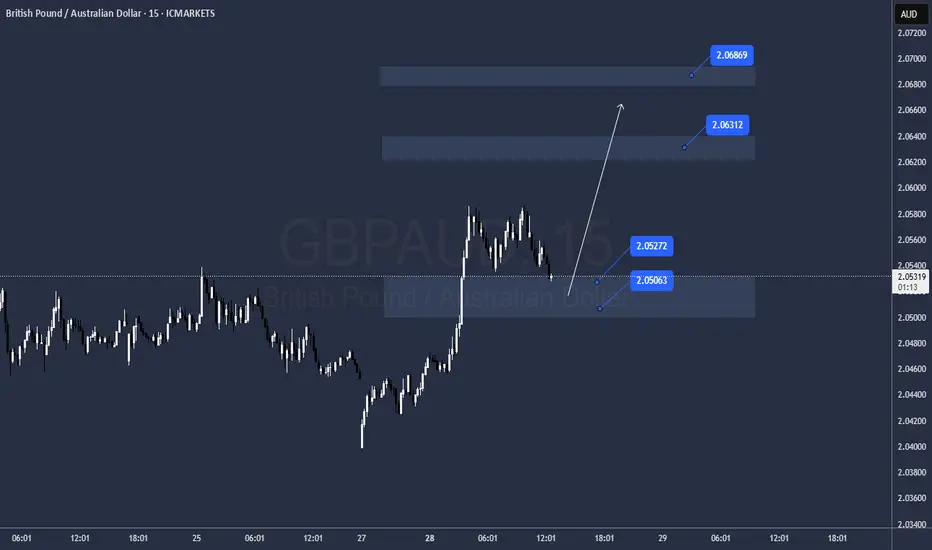
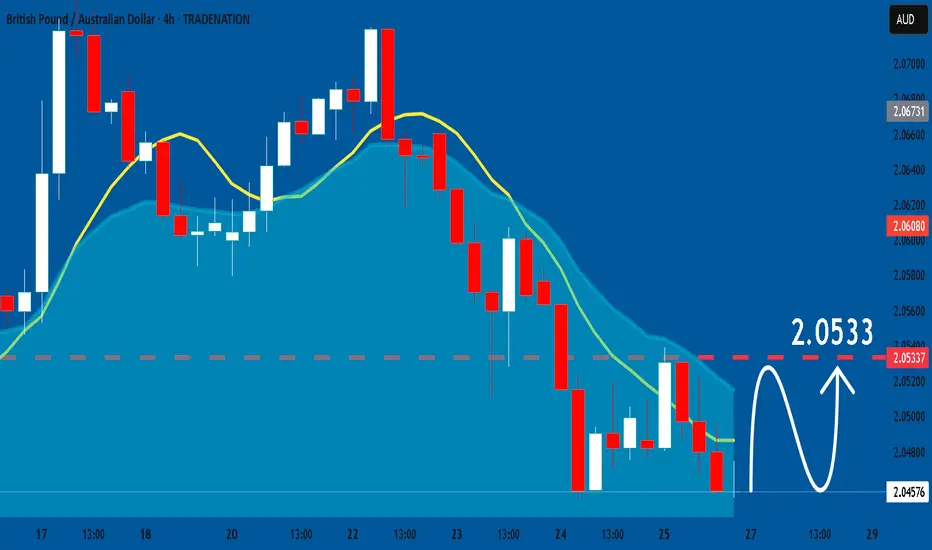
GBP/AUD: Pound Surge to 2.066?FX:GBPAUD is forming a bullish reversal on the 4-hour chart, testing support at 2.05037 with a buy trigger between 2.05037-2.05115. Target 2.066 aligns with the next resistance level, offering a solid risk-reward setup. Set a stop loss at 2.0493 below the recent low. Watch GBP strength and AUD data for catalysts. Trade with precision!
Share your opinion with me in the comments.
#GBPAUD #ForexTrading #TechnicalAnalysis #TradingView #CurrencyPairs #DayTrading #MarketSignals
GBPAUD Breakout of resistance 4 hr GBPAUD candle has broken the trendline resistance and is likely to go up. enter on retesting the support.

buy gbpaudwe reach to support level and have a up trend and now price reach to a demand zone and we have spin candles and we enter...


GBPAUD is Holding above the Support , All Eyes on BuyingHello Traders
In This Chart GBPAUD HOURLY Forex Forecast By FOREX PLANET
today GBPAUD analysis 👆
🟢This Chart includes_ (GBPAUD market update)
🟢What is The Next Opportunity on GBPJPY Market
🟢how to Enter to the Valid Entry With Assurance Profit
This CHART is For Trader's that Want to Improve Their Technical Analysis Skills and Their Trading By Understanding How To Analyze The Market Using Multiple Timeframes and Understanding The Bigger Picture on the Charts
GBPAUD Massive Short! SELL!
My dear subscribers,
My technical analysis for GBPAUDis below:
The price is coiling around a solid key level - 2.0596
Bias - Bearish
Technical Indicators: Pivot Points Low anticipates a potential price reversal.
Super trend shows a clear sell, giving a perfect indicators' convergence.
Goal - 2.0543
My Stop Loss - 2.0626
About Used Indicators:
By the very nature of the supertrend indicator, it offers firm support and resistance levels for traders to enter and exit trades. Additionally, it also provides signals for setting stop losses
Disclosure: I am part of Trade Nation's Influencer program and receive a monthly fee for using their TradingView charts in my analysis.
———————————
WISH YOU ALL LUCK
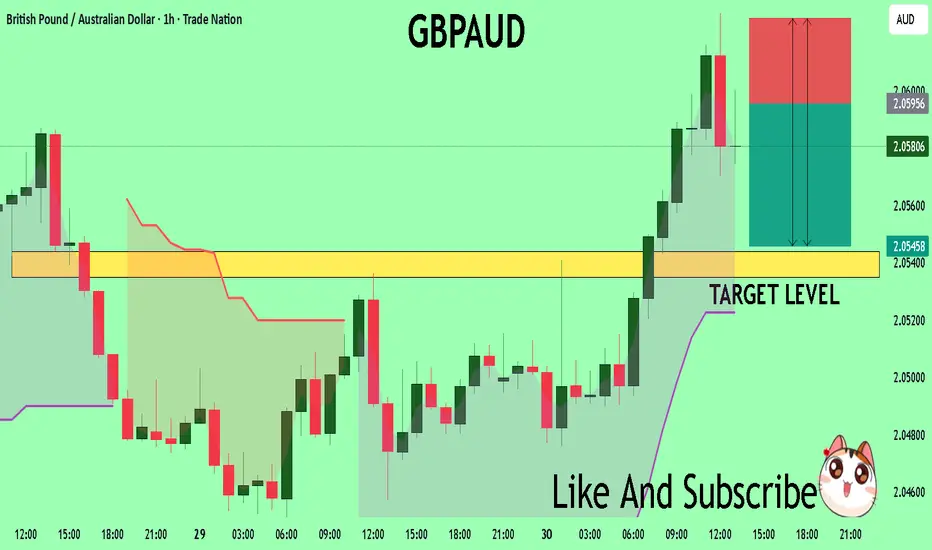
GBPAUDI’m confident in the short-term upward trend. I’ll monitor how the price reacts when it reaches my anticipated level, but until then, I need to remain precise and realistic about my targets.

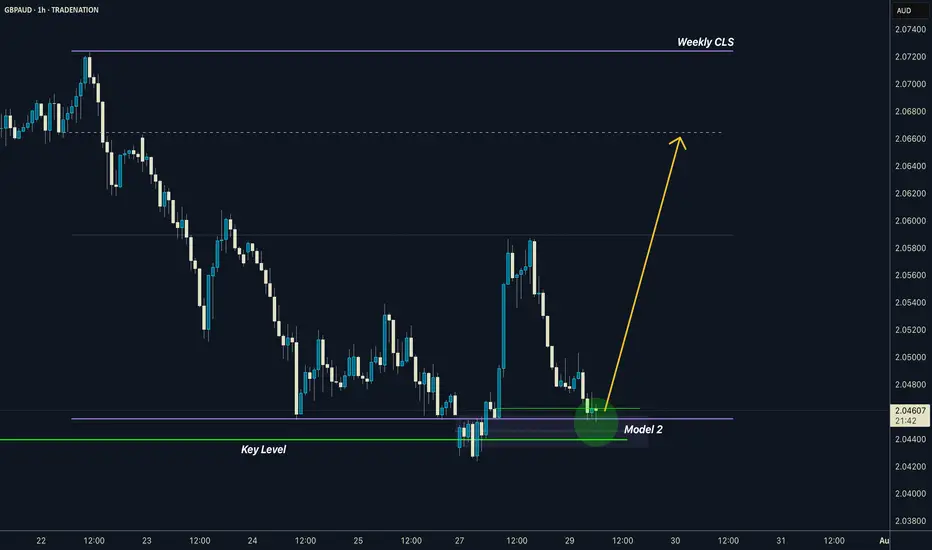
GBPAUD I Weekly CLS I Model 2 I Target 0B and full CLSYo Market Warriors ⚔️
Fresh outlook drop — if you’ve been riding with me, you already know:
🎯My system is 100% mechanical. No emotions. No trend lines. No subjective guessing. Just precision, structure, and sniper entries.
🧠 What’s CLS?
It’s the real smart money. The invisible hand behind $7T/day — banks, algos, central players.
📍Model 1:
HTF bias based on the daily and weekly candles closes,
Wait for CLS candle to be created and manipulated. Switch to correct LTF and spot CIOD. Enter and target 50% of the CLS candle.
Model 1 Done
Analysis done on the Tradenation Charts
Disclosure: I am part of Trade Nation's Influencer program and receive a monthly fee for using their TradingView charts in my analysis.
Trading is like a sport. If you consistently practice you can learn it.
“Adapt what is useful. Reject whats useless and add whats is specifically yours.”
David Perk aka Dave FX Hunter
💬 Don't hesitate to ask any questions or share your opinions
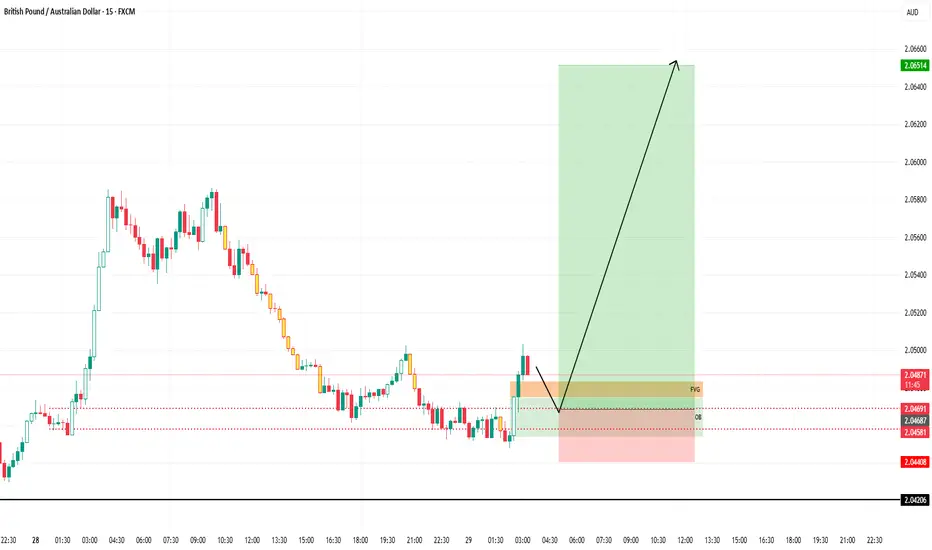
GBPAUD BUY OPPORTUNITY!📊 Current Market Behavior:
Price is retracing back toward the OB and FVG zone after a bullish move.
A small pullback is expected (as shown by the downward leg of the arrow) to mitigate the OB/FVG.
After mitigation, a strong bullish continuation is anticipated.
⚠️ Watch For:
Bullish confirmation inside OB (e.g., bullish engulfing, strong rejection wicks)
Reaction volume and candle strength during the London or NY session
Failure to hold OB may lead to price revisiting 2.04206
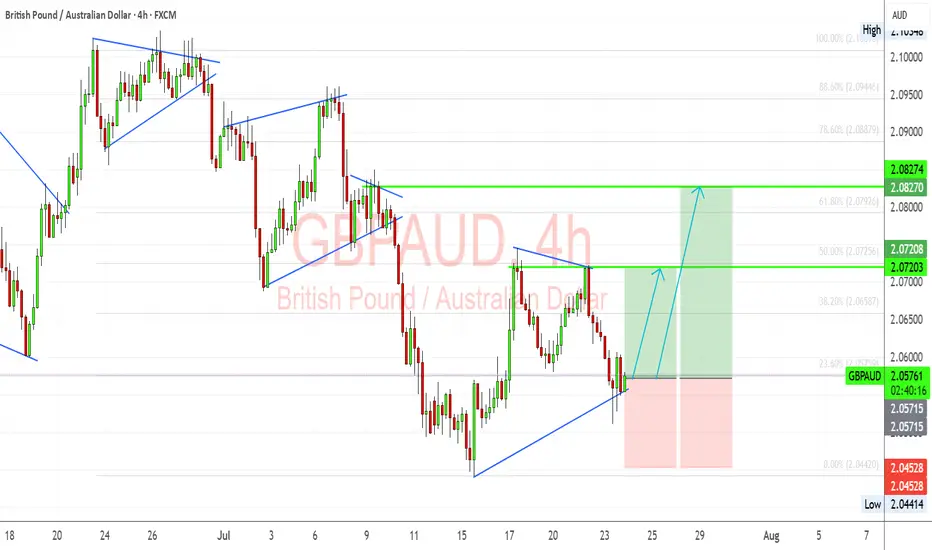
GBP/AUD Trade Setup – Bullish Flag Breakout in PlayGBPAUD has formed a clean bullish flag structure after a significant impulsive move upward. Following the correction, we’re now testing breakout levels with clear Fibonacci confluence and bullish structure support around 2.0560. I'm anticipating a push toward the next resistance levels if buyers defend this trendline.
🔎 Technical Highlights (My View):
Bullish Flag Pattern: The corrective flag has broken to the upside and is being retested. This suggests a possible continuation of the bullish trend.
Fibonacci Support: Price bounced near the 23.6% retracement of the previous bullish leg, which acts as a minor but effective support in trending moves.
Bullish Trendline Holding: The ascending trendline from the July lows continues to act as dynamic support. This shows sustained buyer interest.
Target Zones:
TP1: 2.0720 – aligns with 50% retracement and recent structure.
TP2: 2.0827 – aligns with 78.6% retracement and past resistance.
SL: Below 2.0450 to invalidate the setup.
🏦 Fundamental Context:
GBP Strength: The Bank of England remains more hawkish than the RBA. UK inflation data remains sticky, and traders are still pricing in the potential for another hike if services inflation remains elevated.
AUD Weakness: AUD is under pressure due to soft labor market data and declining commodity demand from China. RBA minutes also struck a cautious tone, which weighs on the Aussie.
China Risk: AUD is sensitive to Chinese sentiment. Current trade and tariff tensions are adding indirect bearish pressure to the AUD.
⚠️ Risks to My Setup:
If Aussie labor or CPI data surprises to the upside, AUD could regain strength.
UK economic data deterioration (e.g., services PMI, wage inflation) could weaken GBP.
Break below 2.0450 would invalidate the bullish setup and suggest potential range continuation.
📅 Upcoming Catalysts to Watch:
UK Retail Sales – A strong print supports GBP continuation.
AU CPI (Trimmed Mean) – Any upside surprise could limit AUD downside.
China Industrial & Services PMI (if released soon) – indirect AUD mover.
⚖️ Summary – Bias & Trade Logic
I’m currently bullish GBP/AUD, expecting a continuation of the prior uptrend now that price has broken and retested the flag structure. Fundamentally, GBP is supported by relatively hawkish BoE expectations, while AUD remains pressured by RBA caution and China-linked macro weakness. My bias stays bullish as long as the trendline holds and Aussie data doesn’t surprise significantly.
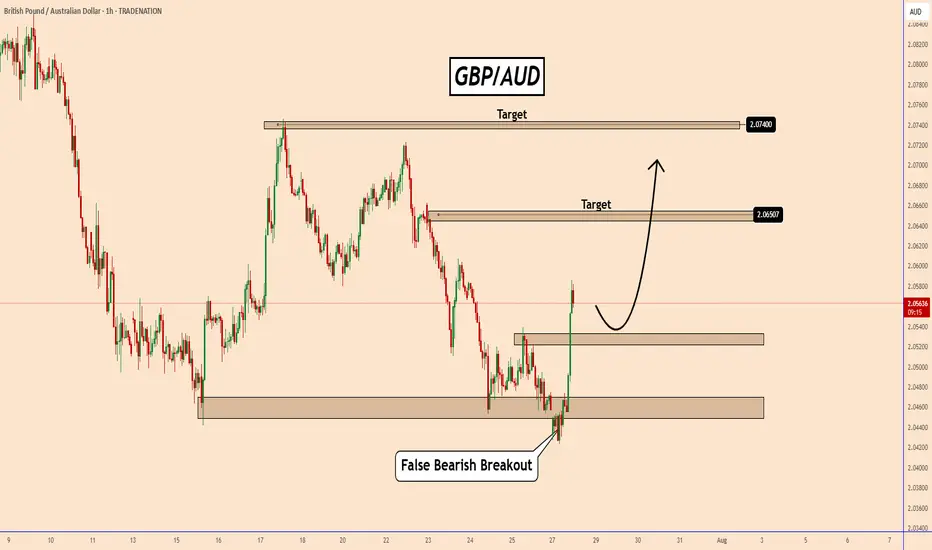
GBPAUD transformed its chart quickly from bearish to bullish!GBPAUD transformed its chart quickly from bearish to bullish!
During the opening of the Market today, GBPAUD created a clear bearish breakout structure and later canceled that breakout.
From the chart we can see a false bearish breakout and GBPAUD is already positioned for a bullish move.
The bullish move is very aggressive and the price increased by almost 135 pips in just 2.5 hours.
After a short pause, GBPAUD should increase further to 2.0650 and 2.0740.
You may find more details in the chart!
Thank you and Good Luck!
PS: Please support with a like or comment if you find this analysis useful for your trading day
Disclosure: I am part of Trade Nation's Influencer program and receive a monthly fee for using their TradingView charts in my analysis.
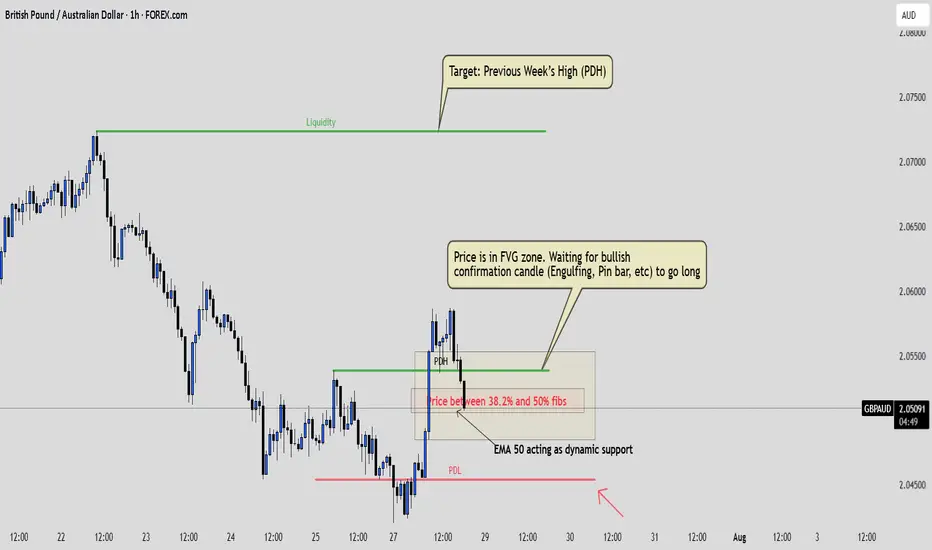
GBPAUD: Calm Before the ConfirmationPrice has swept liquidity below the previous week's low and broke structure to the upside. Now it’s retracing into a Fair Value Gap that aligns beautifully with the 38.2% to 50% Fibonacci zone.
I'm not in yet. I’m watching for a clean bullish confirmation, like an engulfing or strong rejection candle, before entering .
The 50 EMA supports the bias and helps confirm that I'm trading in the direction of the short-term momentum. If all aligns, I’ll be targeting the previous week’s high.
This is a reminder that being patient often protects your capital more than being early.
GBPAUD SHORT IDEAIm looking for short on GBPAUD based on current trend and price action and RSI not reach yet the overbought level on daily. And CPI AUD news will come in few minutes . All the best traders
buy gbpaudwe reach to a support level and break trend line and also break last LH and also pullback to a strong demand zone....
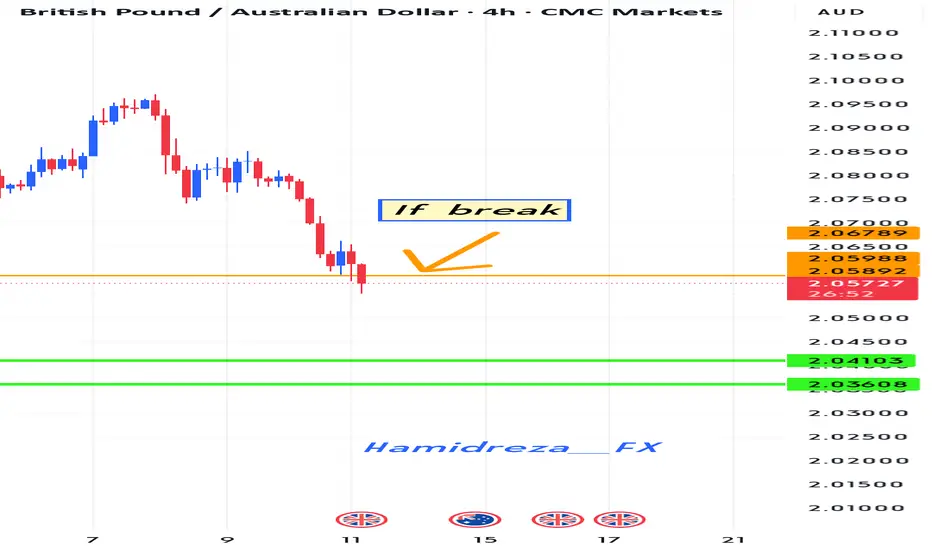
Is the currency GBPAUD depreciating?
Hi dears
I think that if the colored trend line is broken, the downtrend will probably continue until it reaches the target.
Thank you for supporting me by liking, commenting, and subscribing.

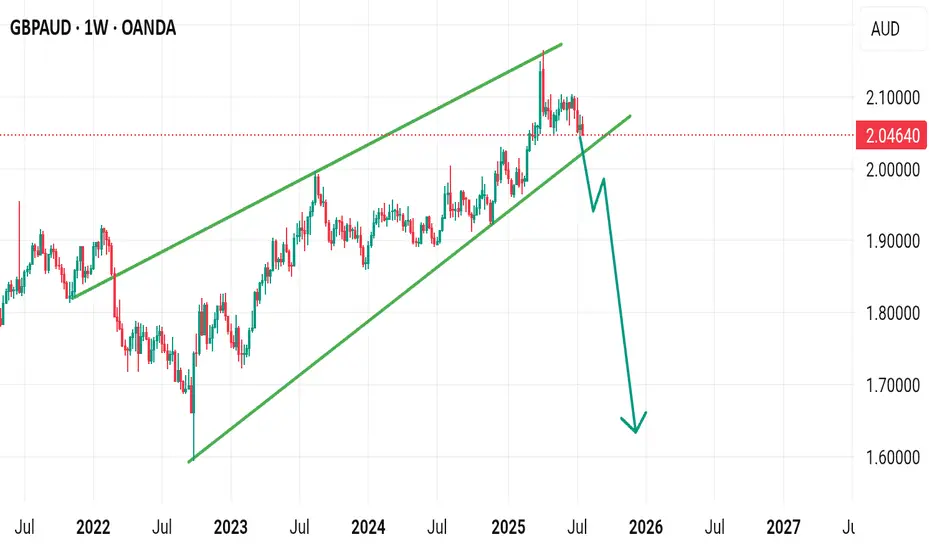
Sell gbpoudA clear reversal pattern in weekly time frame we patiently wait for breakout before selling
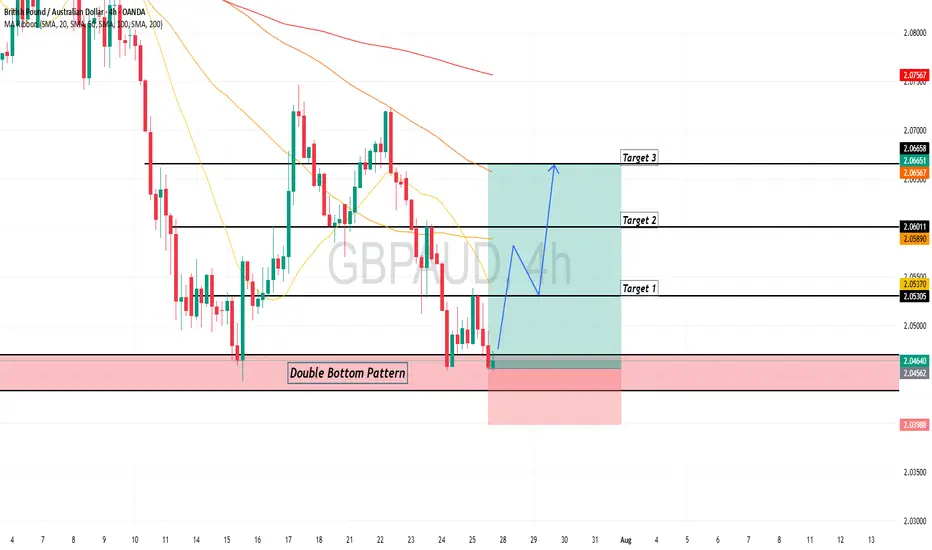
GBPAUD - Bullish Price Action GBPAUD broke out of a reversal structure with a double bottom confluence. Expecting further growth for a long opportunity.
Good Luck
GBPAUD: Bullish Forecast & Outlook
Balance of buyers and sellers on the GBPAUD pair, that is best felt when all the timeframes are analyzed properly is shifting in favor of the buyers, therefore is it only natural that we go long on the pair.
Disclosure: I am part of Trade Nation's Influencer program and receive a monthly fee for using their TradingView charts in my analysis.
❤️ Please, support our work with like & comment! ❤️
TAKE A LOOK AT GBPAUD POSSIBLE BUY OPPORTUNITY!Bullish momentum resumes after laying low for couple of weeks now. Are we likely to see or continue back to resistance high? From the technical perspective, I anticipate it to continue trading bullish in couple of days/weeks to come