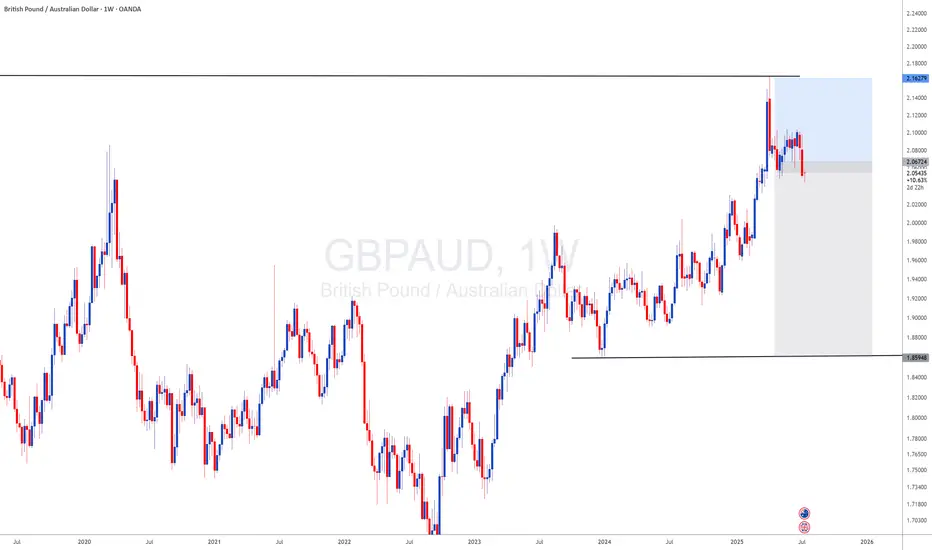
GBPAUD: Weekly Reversal | COT & Seasonality Support Bullish📊 Technical Outlook
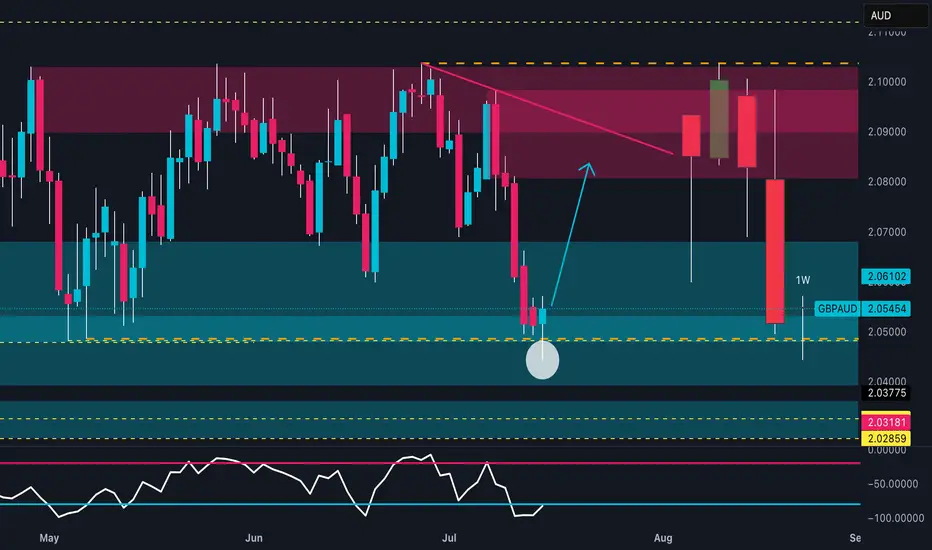
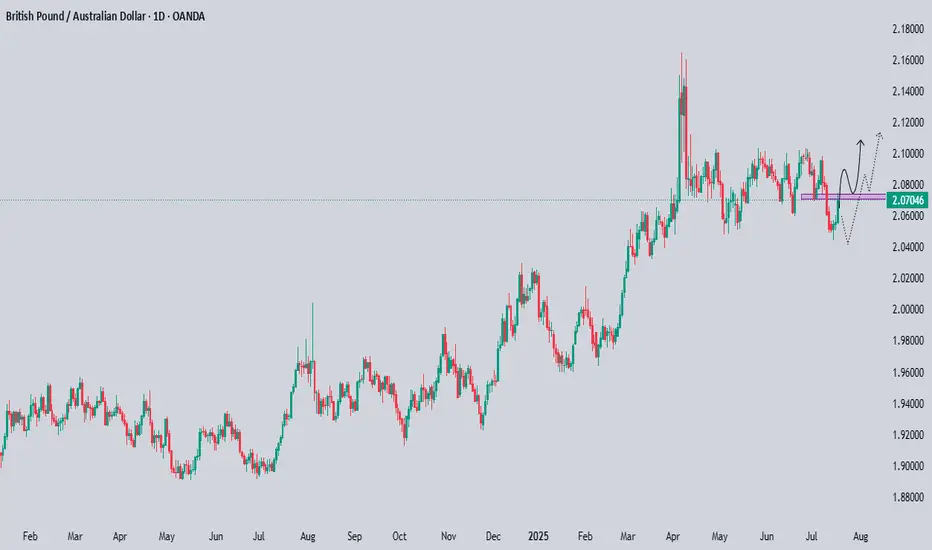
Price strongly reacted from a key weekly demand zone between 2.0400 and 2.0500, showing clear absorption of bearish pressure. The RSI is rebounding from the 30 area, signaling early reversal potential.
The next technical target lies between 2.08900 and 2.10000, within a well-defined supply zone.
An early bullish reversal is in progress, with potential for a swing move toward the red zone.
🧠 Commitment of Traders (COT Report – 08/07/2025)
GBP: Non-commercial traders are net long, with positioning growing across the board: +869 longs / -926 shorts. Commercials reduce shorts and increase longs → Bullish bias.
AUD: Non-commercials are clearly short (-2,267 longs / +1,957 shorts). Commercials are increasing long exposure (+2,629), but still in the minority → Bearish bias.
➡️ The COT spread confirms a GBP long vs AUD short bias.
📅 Seasonality (July)
GBP: Historically strong in July, with average monthly gains across all timeframes (especially the 2Y window).
AUD: Less favorable seasonal profile in July; flat to slightly negative across all time horizons.
➡️ Seasonality supports GBP strength.
📉 Retail Sentiment
58% Long / 42% Short on GBPAUD
➡️ Retail traders are still heavily long → a shakeout of weak long hands is possible before the real rally begins.
🎯 Strategic Conclusion
GBP shows bullish convergence across technical, COT, and seasonal factors. AUD presents clear weakness.
The current price zone offers a clean entry point for longs, targeting the 2.08900–2.10000 supply zone.
GBPAUD trade ideas

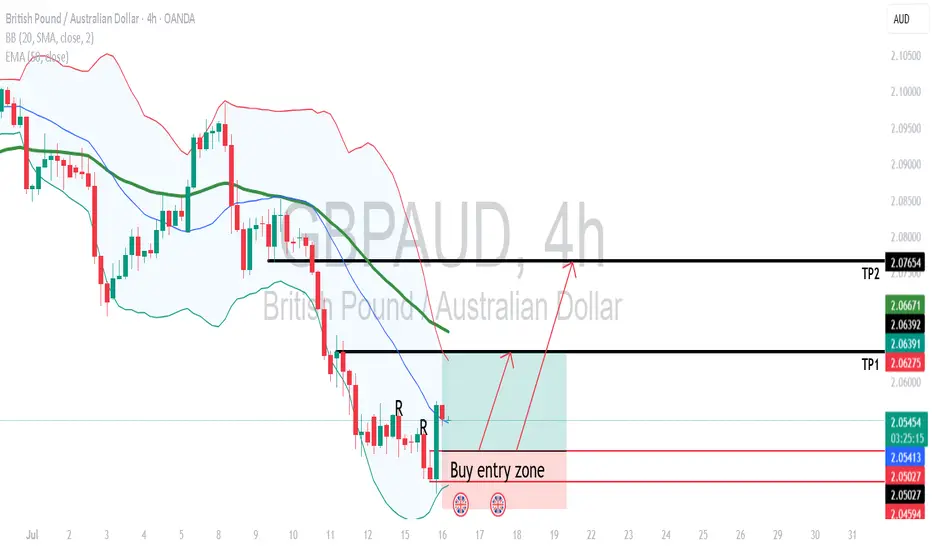
GBPAUD Will Go Up From Support! Long!
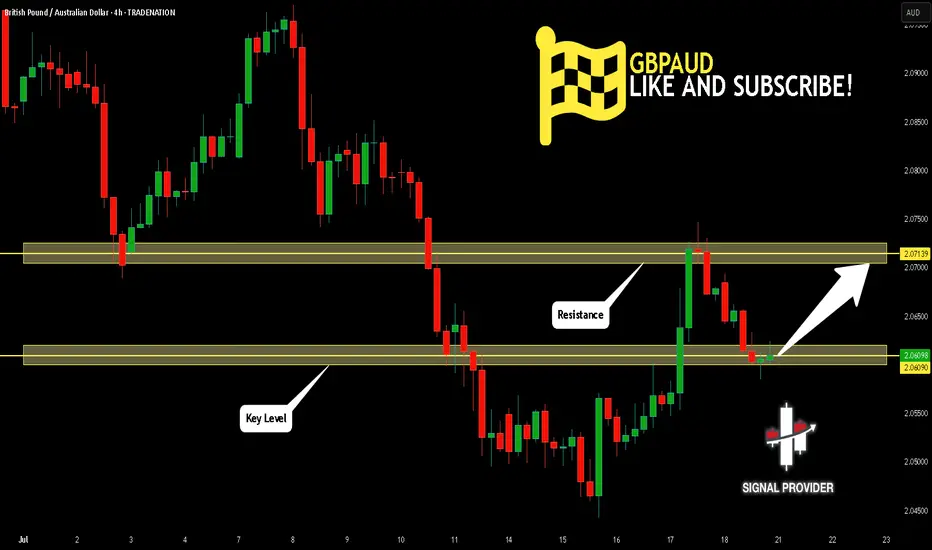
Here is our detailed technical review for GBPAUD.
Time Frame: 4h
Current Trend: Bullish
Sentiment: Oversold (based on 7-period RSI)
Forecast: Bullish
The market is on a crucial zone of demand 2.060.
The oversold market condition in a combination with key structure gives us a relatively strong bullish signal with goal 2.071 level.
P.S
We determine oversold/overbought condition with RSI indicator.
When it drops below 30 - the market is considered to be oversold.
When it bounces above 70 - the market is considered to be overbought.
Disclosure: I am part of Trade Nation's Influencer program and receive a monthly fee for using their TradingView charts in my analysis.
Like and subscribe and comment my ideas if you enjoy them!
GBPAUD Bullish Set-upAfter price formed Accumulation Schematic 2, it entered mark-up phase. Now, correction is approaching the 1h demand level exactly aligning with OTE level.
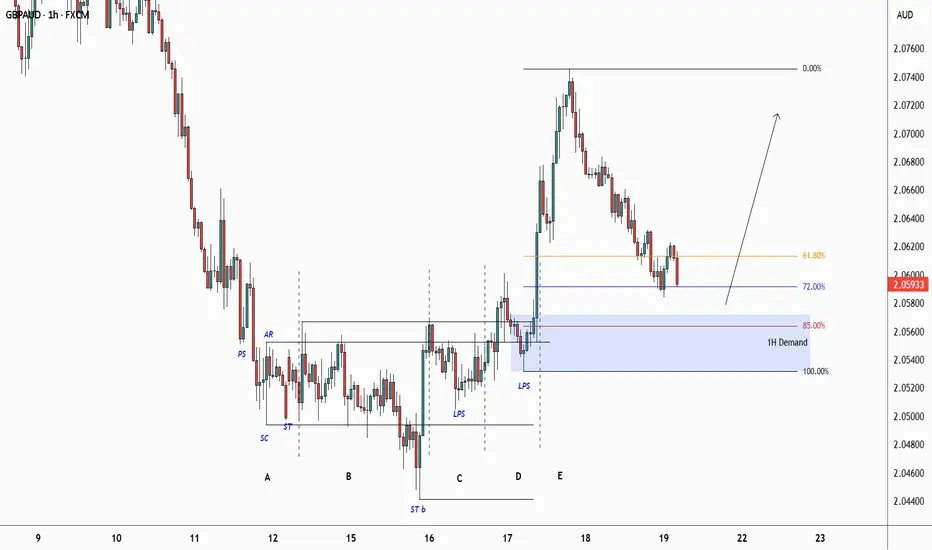
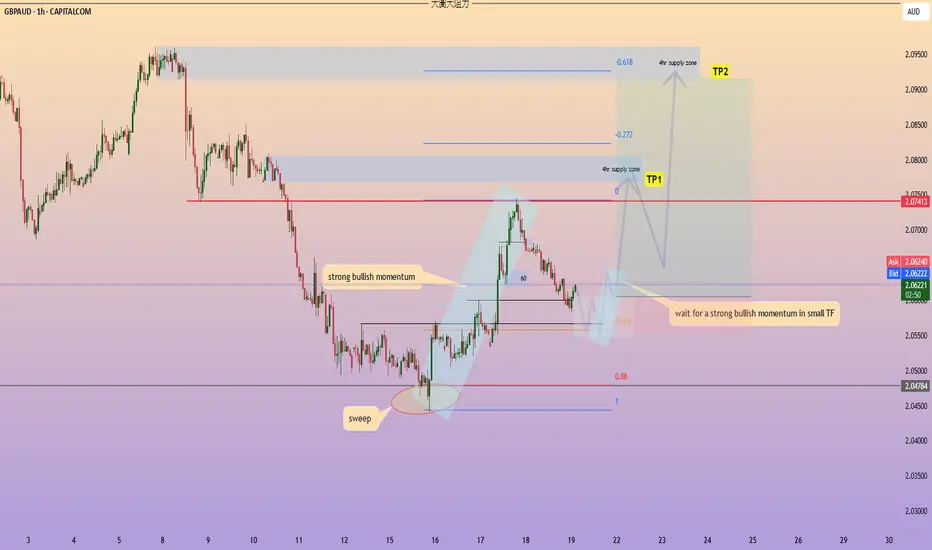
GBPAUD a bullish momentum in 1hr TFsweep happen at 2.04438
consider the price is at the bottom area in the range of D (larger TF)
if the price at 2.05599 level (0.618) appear consolidation would be perfect
need a breakout of consolidation in small TF
long entry in smaller TF
Bullish momentum to extend?GBP/AUD is falling towards the pivot that aligns with the 38.2% Fibonacci retracement and could bounce to the 1st resistance.
Pivot: 2.0639
1st Support: 2.0566
1st Resistance: 2.0741
Risk Warning:
Trading Forex and CFDs carries a high level of risk to your capital and you should only trade with money you can afford to lose. Trading Forex and CFDs may not be suitable for all investors, so please ensure that you fully understand the risks involved and seek independent advice if necessary.
Disclaimer:
The above opinions given constitute general market commentary, and do not constitute the opinion or advice of IC Markets or any form of personal or investment advice.
Any opinions, news, research, analyses, prices, other information, or links to third-party sites contained on this website are provided on an "as-is" basis, are intended only to be informative, is not an advice nor a recommendation, nor research, or a record of our trading prices, or an offer of, or solicitation for a transaction in any financial instrument and thus should not be treated as such. The information provided does not involve any specific investment objectives, financial situation and needs of any specific person who may receive it. Please be aware, that past performance is not a reliable indicator of future performance and/or results. Past Performance or Forward-looking scenarios based upon the reasonable beliefs of the third-party provider are not a guarantee of future performance. Actual results may differ materially from those anticipated in forward-looking or past performance statements. IC Markets makes no representation or warranty and assumes no liability as to the accuracy or completeness of the information provided, nor any loss arising from any investment based on a recommendation, forecast or any information supplied by any third-party.

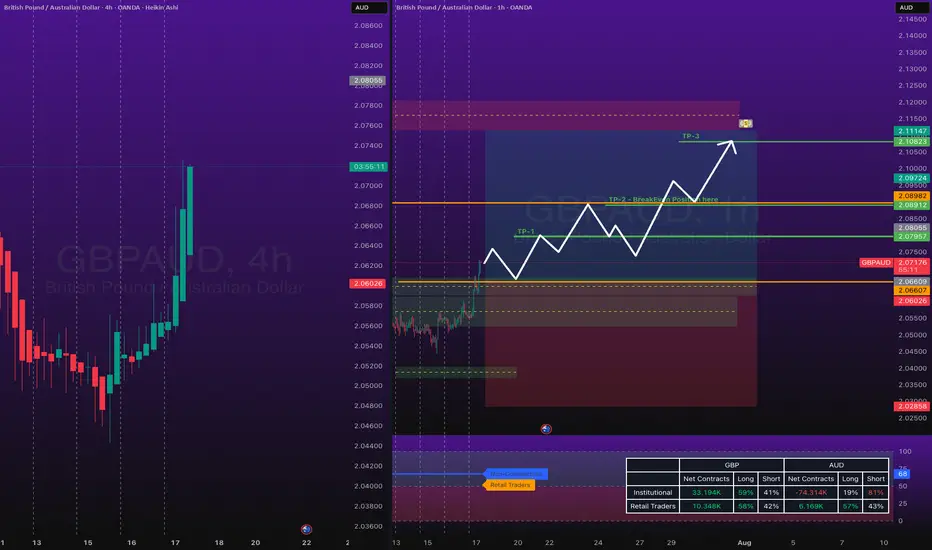
GBPAUD Long Trade OANDA:GBPAUD Long Trade, with my back testing of this strategy, it hits multiple possible take profits, manage your position accordingly.
Note: Manage your risk yourself, its risky trade, see how much your can risk yourself on this trade.
Use proper risk management
Looks like good trade.
Lets monitor.
Use proper risk management.
Disclaimer: only idea, not advice
GBPAUD Technical & Order Flow AnalysisOur analysis is based on a multi-timeframe top-down approach and fundamental analysis.
Based on our assessment, the price is expected to return to the monthly level.
DISCLAIMER: This analysis may change at any time without notice and is solely intended to assist traders in making independent investment decisions. Please note that this is a prediction, and I have no obligation to act on it, nor should you.
Please support our analysis with a boost or comment!
GBPAUD: Pullback From Resistance 🇬🇧🇦🇺
I think that GBPAUD may pull back from a key intraday resistance.
As a confirmation, I see a bearish engulfing candle after its test
on an hourly time frame.
Goal - 2.0655
❤️Please, support my work with like, thank you!❤️
I am part of Trade Nation's Influencer program and receive a monthly fee for using their TradingView charts in my analysis.

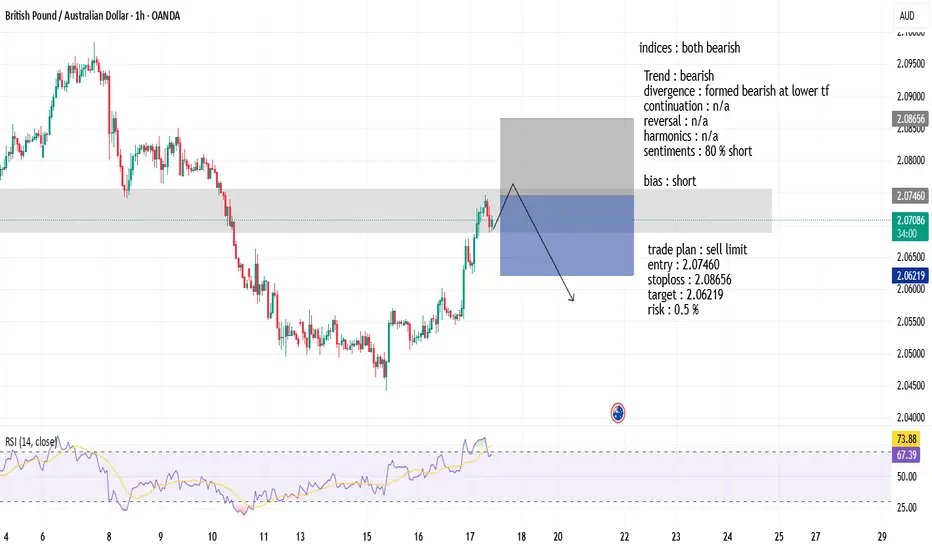
GBPAUD SHORT SELL 17-7-2025Trend : bearish
divergence : formed bearish at lower tf
continuation : n/a
reversal : n/a
harmonics : n/a
sentiments : 80 % short
bias : short
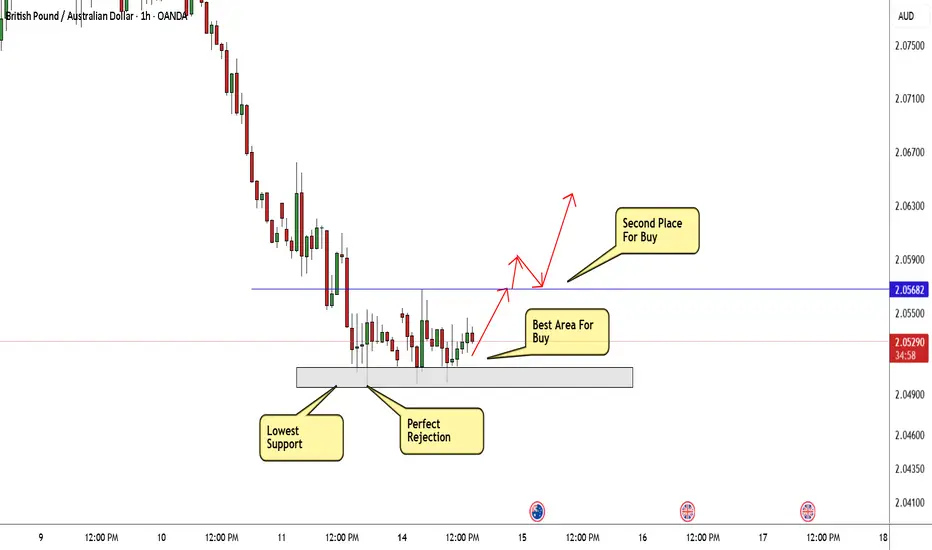
GBP/AUD Ready To Go Up After Melted , 2 Entries Valid !Here is my GBP/AUD 1H Chart and this is my opinion , the price moved very hard to downside without any correction and the price at strong support now 2.05000 which is forced the price many times to go up , so it`s my best place to enter a buy trade , and if you checked the chart you will see the price now creating a reversal pattern and i put my neckline and if we have a closure above it to confirm the pattern we can enter another entry to increase our contracts . if we have a daily closure below my support area then this idea will not be valid anymore .
GBPAUD Rebound Ahead!
HI,Traders !
#GBPAUD keeps falling but
A horizontal support level
Is ahead around 2.04853
And as the pair is locally
Oversold we will be expecting
A local bullish rebound !
Comment and subscribe to help us grow !

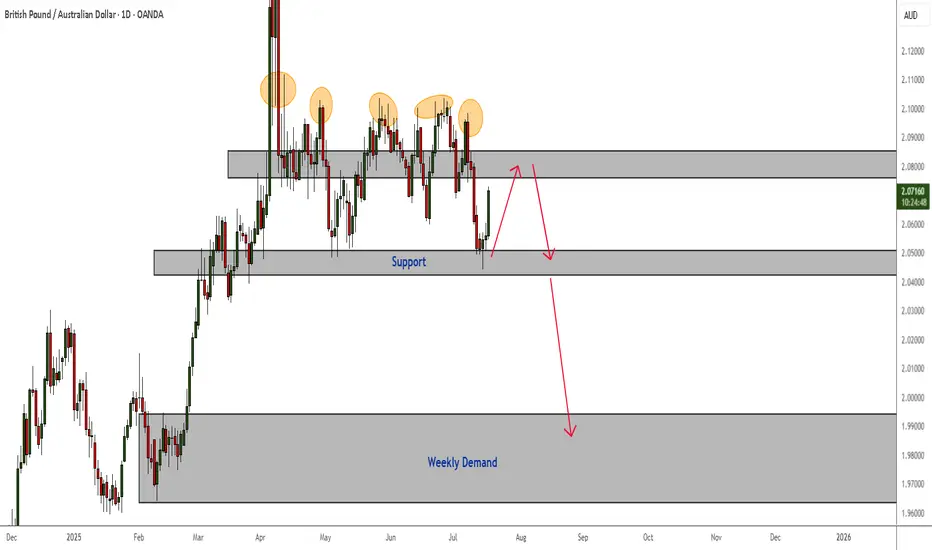
GBPAUD Downward Pressure - Bearish Confirmations Swing TradeAlthough price has been consolidating between a daily resistance and support, I am currently seeing multiple rejections in resistance and bearish candlestick patterns that indicate pressure to the downside will soon follow.
A rejection in the current highlighted resistance and a break of support will take price to weekly demand. Always wait for the right confirmations - especially when price is range-bound like it is now.
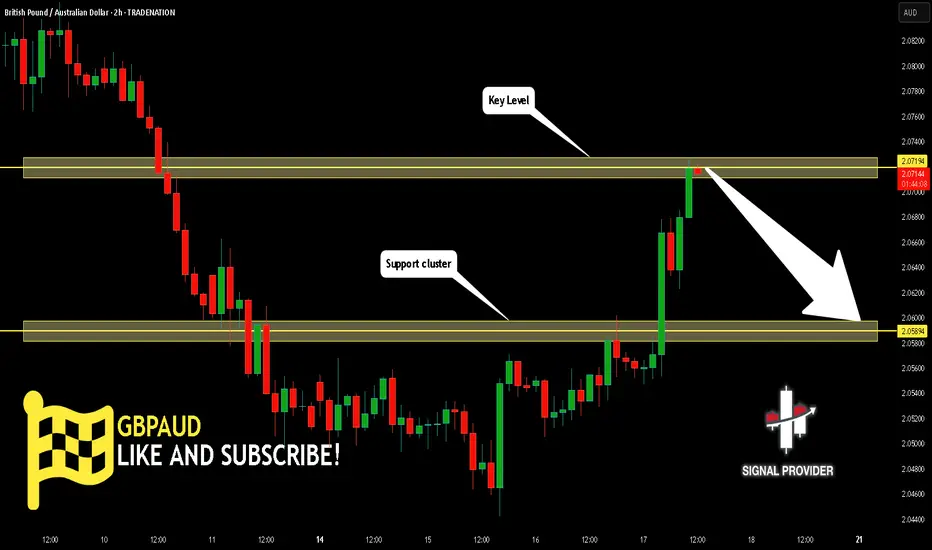
GBPAUD Will Go Lower From Resistance! Sell!
Please, check our technical outlook for GBPAUD.
Time Frame: 2h
Current Trend: Bearish
Sentiment: Overbought (based on 7-period RSI)
Forecast: Bearish
The price is testing a key resistance 2.071.
Taking into consideration the current market trend & overbought RSI, chances will be high to see a bearish movement to the downside at least to 2.058 level.
P.S
We determine oversold/overbought condition with RSI indicator.
When it drops below 30 - the market is considered to be oversold.
When it bounces above 70 - the market is considered to be overbought.
Disclosure: I am part of Trade Nation's Influencer program and receive a monthly fee for using their TradingView charts in my analysis.
Like and subscribe and comment my ideas if you enjoy them!
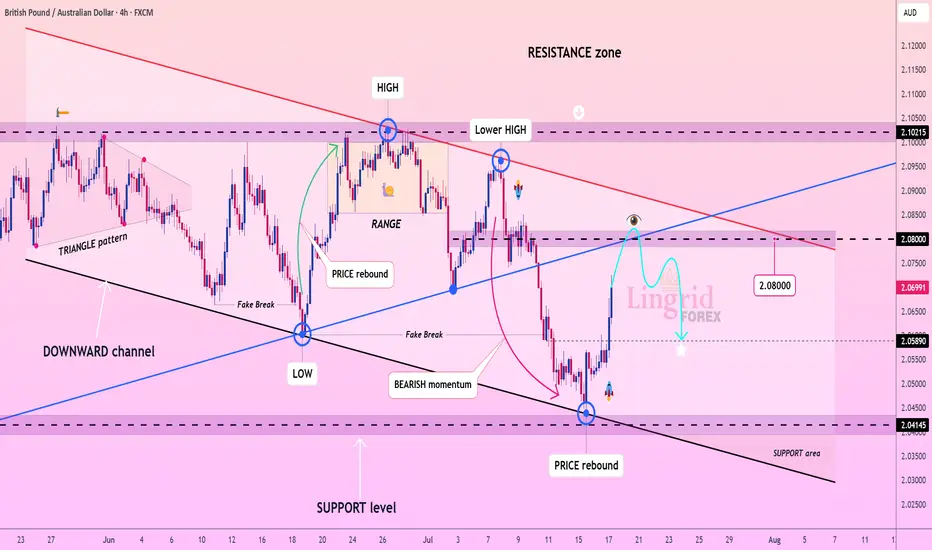
Lingrid | GBPAUD Selling Opportunity From the Key LevelFX:GBPAUD rebounded sharply from the key support zone near 2.0415, forming a corrective leg toward the mid-range resistance at 2.0800. However, the overall structure remains within a downward channel, and the recent lower high under the red resistance trendline suggests continuation of bearish pressure. A rejection from the 2.08–2.10 zone would likely resume the prior impulse leg toward lower support levels. Until a breakout above the descending red trendline occurs, rallies remain corrective.
📉 Key Levels
Sell trigger: Rejection from 2.0800–2.0900
Sell zone: 2.0750–2.0850
Target: 2.0589 and potentially 2.0415
Invalidation: Break and close above 2.1020
💡 Risks
Breakout from the red resistance line could reverse the downtrend
Sudden AUD weakness from macro events
Price closes above the descending channel boundary
If this idea resonates with you or you have your own opinion, traders, hit the comments. I’m excited to read your thoughts!
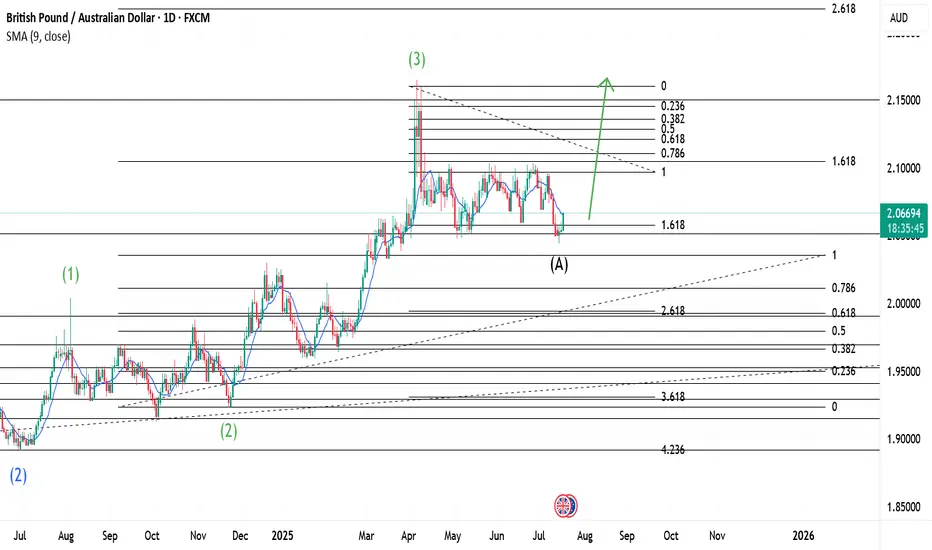
GBPAUD and the Elliott Wave TheoryFrom the bottom left of the chart, we see the price move upwards to form a Wave 1(Green) then a 2(Green). It is important to note that this Wave 2(Green) was a Zigzag correction. This means we should expect a Flat Correction for Wave 4(Green). Wave 3(Green) is long and goes beyond the 161.8% Fib. level, and this normal expressive behaviour for Waves. Our Wave 3(Green) retests on a W1 Chart Fib. level and then drops. This drop is our Wave A(Black). Wave A(Black) retests severally around the 161.8% Fib. level. We should expect a Flat correction as stated earlier, and this means Wave B should go beyond the ending of Wave 3(Green). A confirmation on the D1 Chart would trigger formation of Wave B(Black).
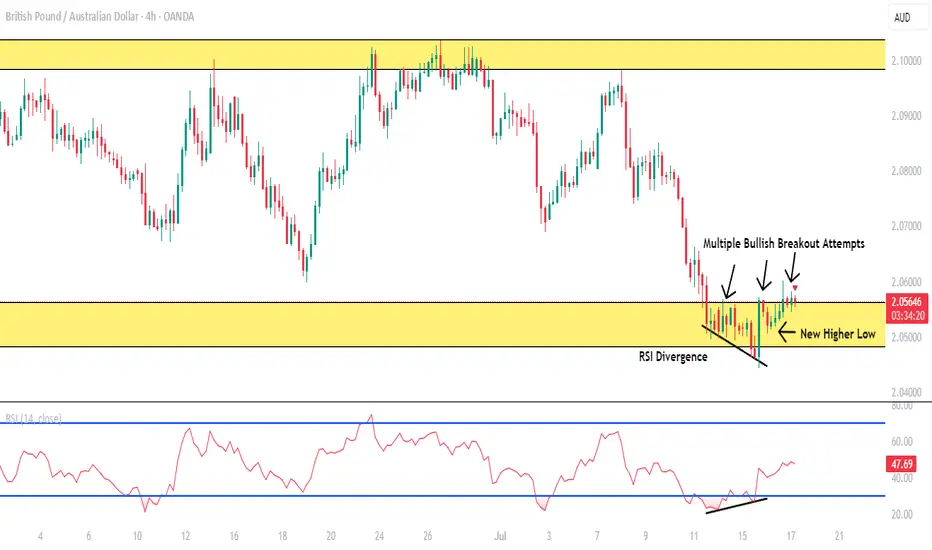
GBPAUD BUY LOW OF THE RANGE (BLSHS)Price is in 3 month trading range, price attempted breakout in either direction but failed multiple times.
In a Trading Range we Buy Low Sell High Scalp (BLSHS).
- Upper Range is at (2.10379 - 2.09843).
- Low of the Range at (2.05636 - 2.04819) where price is currently at.
- Price formed a new higher low at 2.07375 showing buyers coming.
- Price was rejected strongly at the low of the range and formed RSI Divergence at the level signaling a reversal the upside.
- AUD employment data released today at 4:30AM if negative price will breakout strongly
Stop loss below the new higher low at 2.07375 or below the setup at 2.04423.
Take profit at 2.07045 or at the top of the range at (2.10379 - 2.09843).
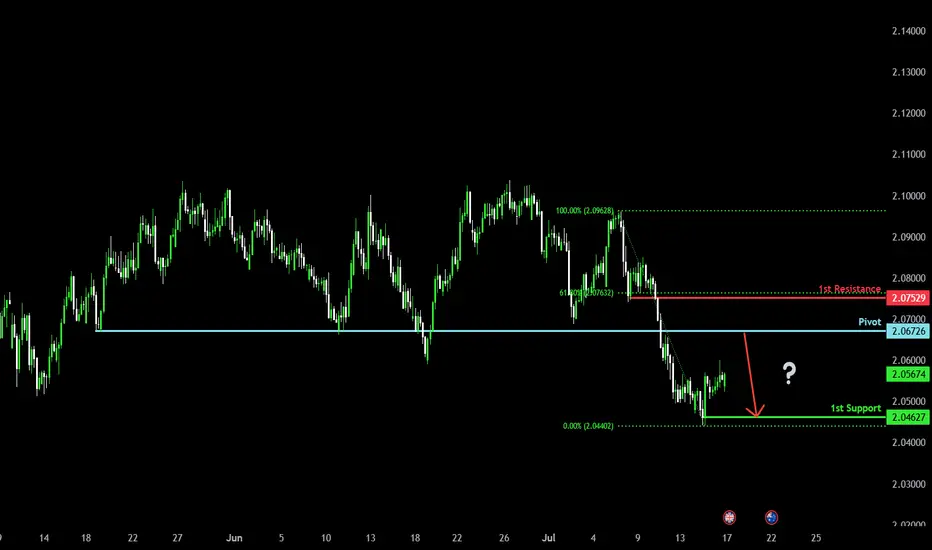
Heading into major resistance?GBP/AUD is rising towards the pivot which is a pullback resistance and could reverse to the 1st support which is a pullback support.
Pivot: 2.0672
1st Support: 2.0462
1st Resistance: 2.0752
Risk Warning:
Trading Forex and CFDs carries a high level of risk to your capital and you should only trade with money you can afford to lose. Trading Forex and CFDs may not be suitable for all investors, so please ensure that you fully understand the risks involved and seek independent advice if necessary.
Disclaimer:
The above opinions given constitute general market commentary, and do not constitute the opinion or advice of IC Markets or any form of personal or investment advice.
Any opinions, news, research, analyses, prices, other information, or links to third-party sites contained on this website are provided on an "as-is" basis, are intended only to be informative, is not an advice nor a recommendation, nor research, or a record of our trading prices, or an offer of, or solicitation for a transaction in any financial instrument and thus should not be treated as such. The information provided does not involve any specific investment objectives, financial situation and needs of any specific person who may receive it. Please be aware, that past performance is not a reliable indicator of future performance and/or results. Past Performance or Forward-looking scenarios based upon the reasonable beliefs of the third-party provider are not a guarantee of future performance. Actual results may differ materially from those anticipated in forward-looking or past performance statements. IC Markets makes no representation or warranty and assumes no liability as to the accuracy or completeness of the information provided, nor any loss arising from any investment based on a recommendation, forecast or any information supplied by any third-party.
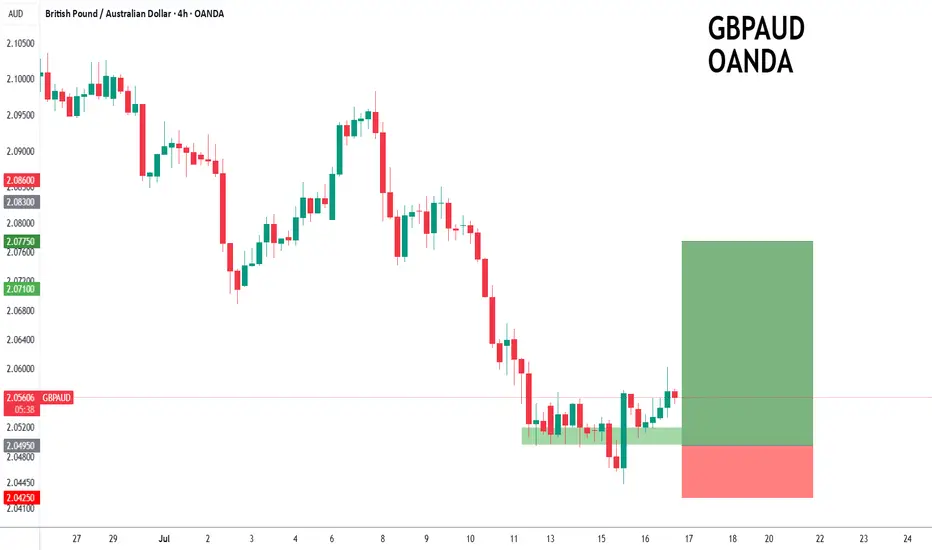
GBPAUD to turnaround?GBPAUD - 24h expiry
The primary trend remains bullish.
Price action looks to be forming a bottom.
We look for a temporary move lower.
Preferred trade is to buy on dips.
Bespoke support is located at 2.0495.
We look to Buy at 2.0495 (stop at 2.0425)
Our profit targets will be 2.0775 and 2.0820
Resistance: 2.0670 / 2.0750 / 2.0830
Support: 2.0490 / 2.0440 / 2.0400
Risk Disclaimer
The trade ideas beyond this page are for informational purposes only and do not constitute investment advice or a solicitation to trade. This information is provided by Signal Centre, a third-party unaffiliated with OANDA, and is intended for general circulation only. OANDA does not guarantee the accuracy of this information and assumes no responsibilities for the information provided by the third party. The information does not take into account the specific investment objectives, financial situation, or particular needs of any particular person. You should take into account your specific investment objectives, financial situation, and particular needs before making a commitment to trade, including seeking advice from an independent financial adviser regarding the suitability of the investment, under a separate engagement, as you deem fit.
You accept that you assume all risks in independently viewing the contents and selecting a chosen strategy.
Where the research is distributed in Singapore to a person who is not an Accredited Investor, Expert Investor or an Institutional Investor, Oanda Asia Pacific Pte Ltd (“OAP“) accepts legal responsibility for the contents of the report to such persons only to the extent required by law. Singapore customers should contact OAP at 6579 8289 for matters arising from, or in connection with, the information/research distributed.
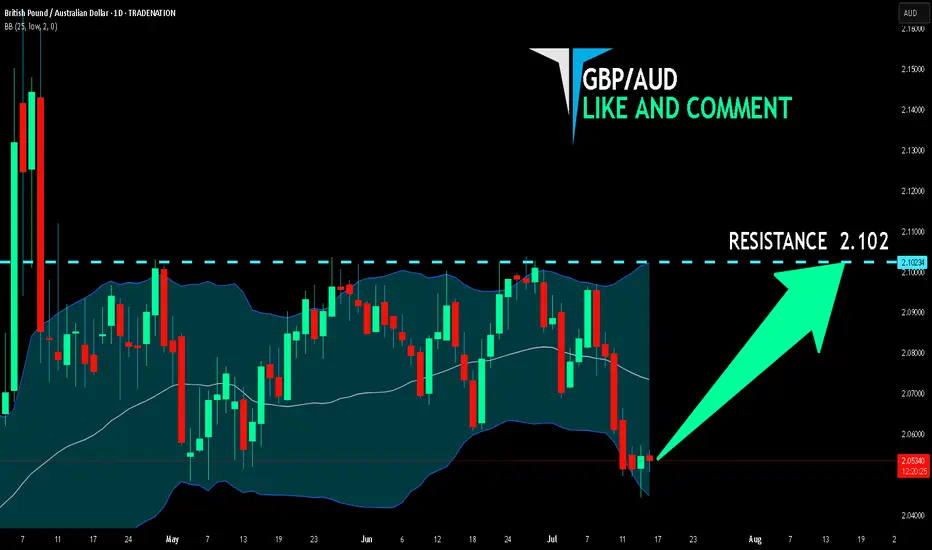
GBP/AUD BULLS ARE STRONG HERE|LONG
Hello, Friends!
Previous week’s red candle means that for us the GBP/AUD pair is in the downtrend. And the current movement leg was also down but the support line will be hit soon and lower BB band proximity will signal an oversold condition so we will go for a counter-trend long trade with the target being at 2.102.
Disclosure: I am part of Trade Nation's Influencer program and receive a monthly fee for using their TradingView charts in my analysis.
✅LIKE AND COMMENT MY IDEAS✅
GBPAUD looking for a long term downside GBPAUD a long term upside completed now its the time to look for shots
GBPAUD H4 buyer started control the marketBased on candle stick pattern, i observed a clear bullish setup.
I'm expecting the price will pullback to the entry zone.
Intraday target will be TP 1.
Calculate your own risk & reward.
Good Luck
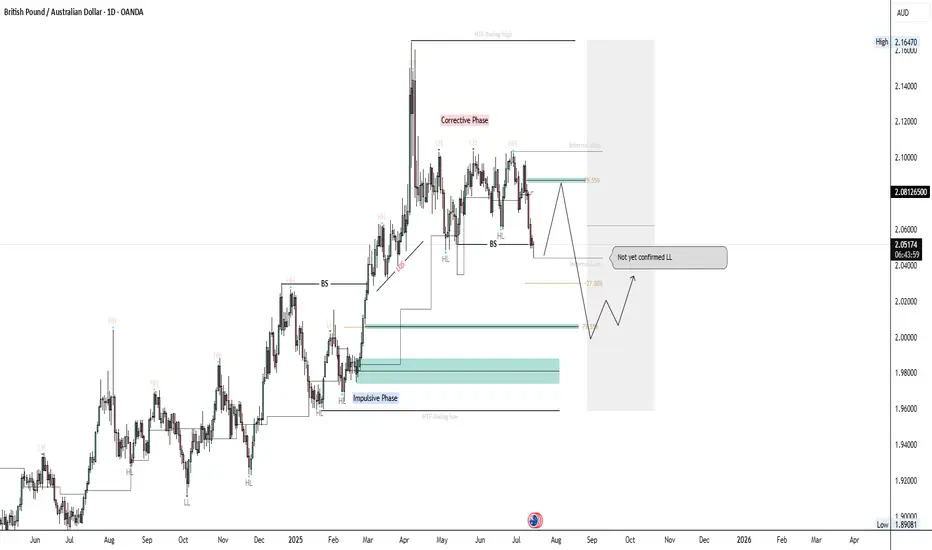
GBPAUD Swing Trade Idea 15-07-2025Hello Traders
Here's a breakdown on GBPAUD: Daily Timeframe
1. Overall trend is bullish; price has been consistently forming HH & respecting HL.
2. Current price is in corrective phase, meaning we should be focusing on sells until we reach our discounted level, and price will be following bearish order flow (Forming LL & respecting LH)
3. Using the identified swing high and swing low, we can place our Fibonacci to identify discounted prices where we can look for possible longs again.
4. Until then we can identify internal swing low and swing high using the H4 timeframe, and we can identify premium levels to look for potential short positions (Counter trend trade) as illustrated.