GBP/CAD - H4 - Bearish Flag (26.07.2025)The GBP/CAD Pair on the H4 timeframe presents a Potential Selling Opportunity due to a recent Formation of a Bearish Flag Pattern. This suggests a shift in momentum towards the downside in the coming Days.
Possible Short Trade:
Entry: Consider Entering A Short Position around Trendline Of The Pattern.
Target Levels:
1st Support – 1.8242
2nd Support – 1.8139
🎁 Please hit the like button and
🎁 Leave a comment to support for My Post !
Your likes and comments are incredibly motivating and will encourage me to share more analysis with you.
Best Regards, KABHI_TA_TRADING
Thank you.
Disclosure: I am part of Trade Nation's Influencer program and receive a monthly fee for using their TradingView charts in my analysis.
GBPCAD trade ideas

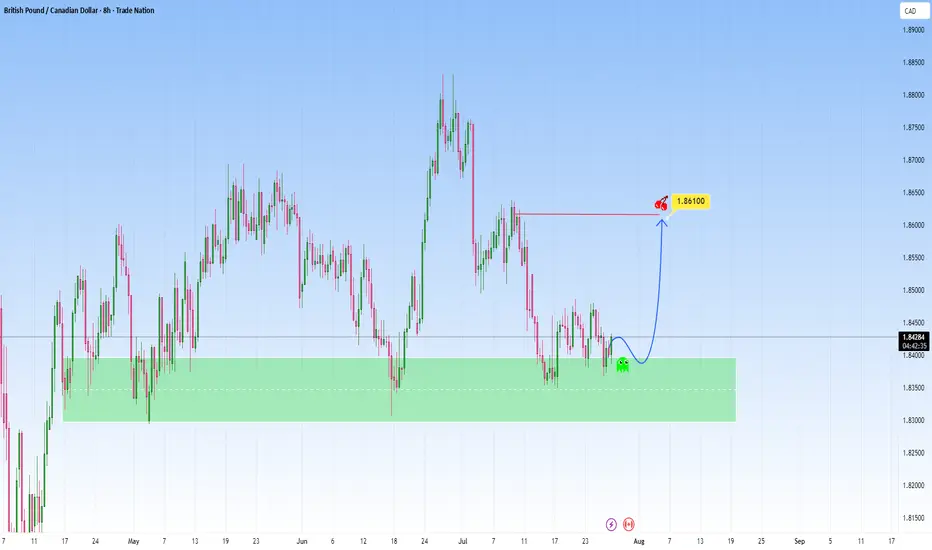
GBPCAD At Support - High probability reversalGBPCAD descended with strength, and has now reached a strong support zone.
Price now hovers above and this zone and is a great indication to use for possible reversal move, that could send price into the 1.86100 level.
But if price breaks below support with momentum, then I’ll back off this bullish bias and reassess, and consider the reversal idea invalidated, with potential for further downside.
Just sharing my thoughts for the charts, this isn’t financial advice. Always confirm your setups and manage your risk properly.
Disclosure: I am part of Trade Nation's Influencer program and receive a monthly fee for using their TradingView charts in my analysis.
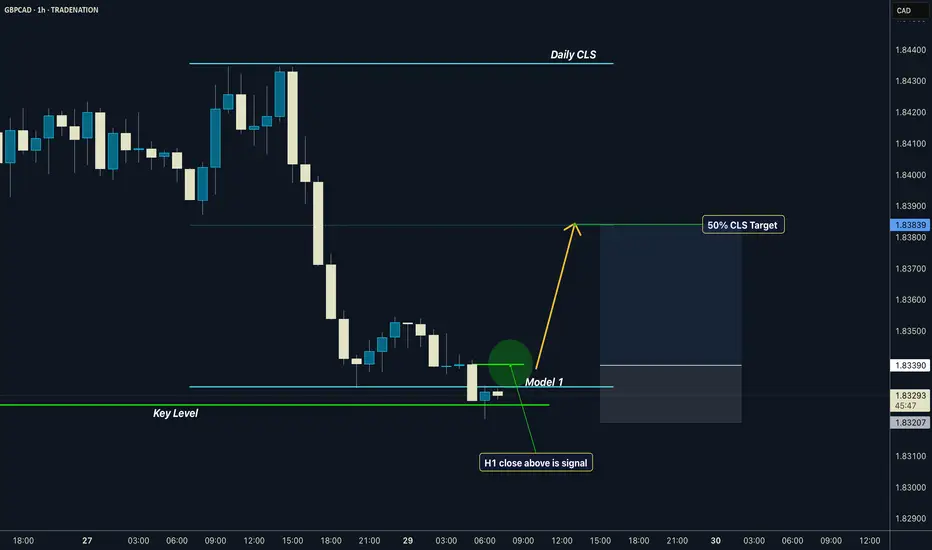
GBPCAD I Daily CLS I Model 1 I 50% CLS TargetYo Market Warriors ⚔️
Fresh outlook drop — if you’ve been riding with me, you already know:
🎯My system is 100% mechanical. No emotions. No trend lines. No subjective guessing. Just precision, structure, and sniper entries.
🧠 What’s CLS?
It’s the real smart money. The invisible hand behind $7T/day — banks, algos, central players.
📍Model 1:
HTF bias based on the daily and weekly candles closes,
Wait for CLS candle to be created and manipulated. Switch to correct LTF and spot CIOD. Enter and target 50% of the CLS candle.
For high probability include Dealing Ranges, Weekly Profiles and CLS Timing.
Analysis done on the Tradenation Charts
Disclosure: I am part of Trade Nation's Influencer program and receive a monthly fee for using their TradingView charts in my analysis.
Trading is like a sport. If you consistently practice you can learn it.
“Adapt what is useful. Reject whats useless and add whats is specifically yours.”
David Perk aka Dave FX Hunter
💬 Don't hesitate to ask any questions or share your opinions
GBPCAD - Long-Term Long!Hello TradingView Family / Fellow Traders. This is Richard, also known as theSignalyst.
📈GBPCAD has been overall bullish trading within the rising wedge pattern marked in blue.
This week, GBPCAD has been retesting the lower bound of the wedge.
Moreover, the red zone is a strong weekly structure.
🏹 Thus, the highlighted blue circle is a strong area to look for buy setups as it is the intersection of the lower blue trendline and red structure.
📚 As per my trading style:
As #GBPCAD approaches the blue circle zone, I will be looking for trend-following bullish reversal setups (like a double bottom pattern, trendline break , and so on...)
📚 Always follow your trading plan regarding entry, risk management, and trade management.
Good luck!
All Strategies Are Good; If Managed Properly!
~Rich
Disclosure: I am part of Trade Nation's Influencer program and receive a monthly fee for using their TradingView charts in my analysis.

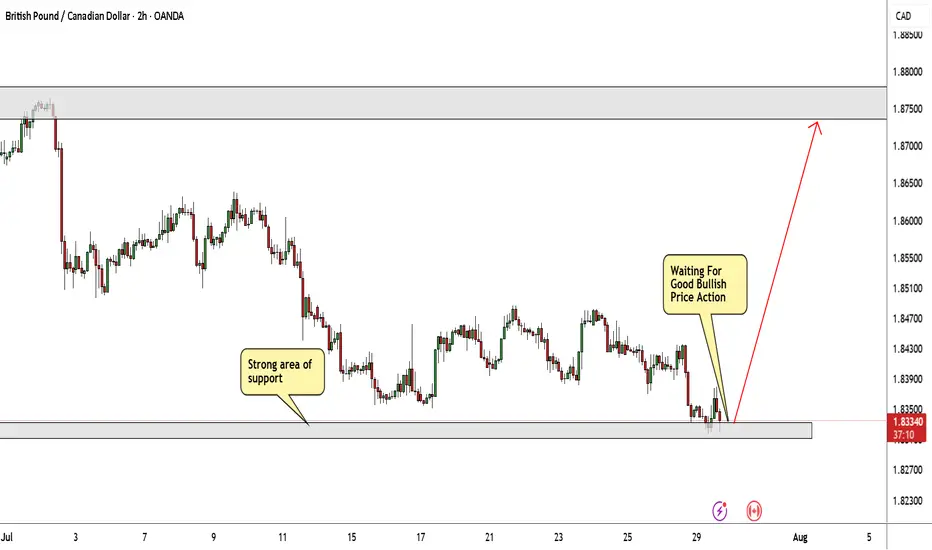
GBP/CAD Possible Buy Trade With Great Pips!The price is standing at a strong area of support that is a historical area of support and pushed the price multiple. I think it can be a great area to enter a buy trade but I have 2 conditions to enter this trade:
1- great bullish price action above an area of support.
2- if we have a daily closure below this area of support this trade will be canceled.
I will commit to these conditions and see what will happen.
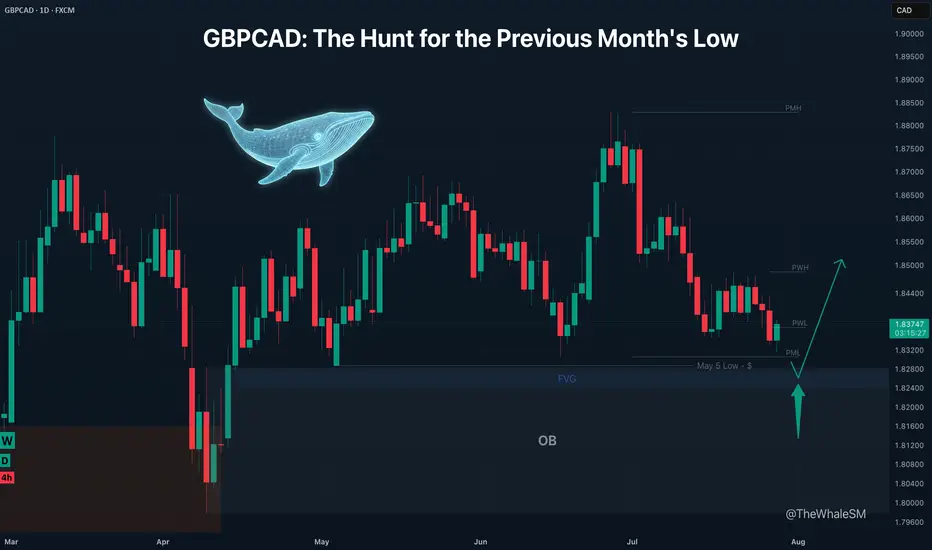
GBPCAD: The Hunt for the Previous Month's LowLike a predator stalking its prey, the market often moves with a clear objective. For GBPCAD, the primary target is now the massive pool of liquidity resting below the Previous Month's Low. This isn't a random drop; it's a calculated hunt. This analysis lays out the plan to join the reversal after the hunt is complete.
The price of GBPCAD is approaching a large pool of liquidity in the form of the Previous Month's Low (PML) , with the May 5th low located just below it. There is a high probability that this liquidity will be swept in the near future, because with only a few days left until the end of the month, the PML will no longer act as such a strong magnet for the price as it does now.
The capture of this liquidity would be accompanied by the mitigation of a daily order block in conjunction with a daily FVG . This confluence of factors could act as strong support for a potential price bounce, with a minimum target of a liquidity sweep of the Previous Week's High (PWH) .
SETUP CONDITIONS
The condition for the long setup to form would be a sharp downside liquidity sweep with a candle wick, which mitigates the upper part of the daily order block, followed by the start of a bullish order flow on a lower timeframe .
► Invalidation: Invalidation of the long scenario would be a daily candle body closing below the May 5th low, or a sharp drop to the middle of the daily order block.
~~~~~~~~~~~~~~~~~~~~~~~~~~~~~~~~~~~~~~~~~~~~~~~~~~~~~~~~~~~~~~~~~
The principles and conditions for forming the manipulation zones I show in this trade idea are detailed in my educational publication, which was chosen by TradingView for the "Editor's Picks" category and received a huge amount of positive feedback from this insightful trading community. To better understand the logic I've used here and the general principles of price movement in most markets from the perspective of institutional capital, I highly recommend checking out this guide if you haven't already. 👇
P.S. This is not a prediction of the exact price direction. It is a description of high-probability setup that become valid only if specific conditions are met when the price reaches the marked POI. If the conditions are not met, the setup are invalid. No setup has a 100% success rate, so if you decide to use this trade idea, always apply a stop-loss and proper risk management. Trade smart.
~~~~~~~~~~~~~~~~~~~~~~~~~~~~~~~~~~~~~~~~~~~~~~~~~~~~~~~~~~~~~~~~~
If you found this analysis helpful, support it with a Boost! 🚀
Have a question or your own view on this idea? Share it in the comments. 💬
► Follow me on TradingView to get real-time updates on THIS idea (entry, targets & live trade management) and not to miss my next detailed breakdown.
~~~~~~~~~~~~~~~~~~~~~~~~~~~~~~~~~~~~~~~~~~~~~~~~~~~~~~~~~~~~~~~~~
$GBPCAD: Overall Bearish, Short Term Upside
➡️ Downside motive wave: We are finishing 5 waves at strong blue support zone. I don´t see enough momentum to break this zone at the moment.
➡️ Expect a recovery: Price will probably make a short-term recovery, with a high probability of reaching the middle of the range at 1.85-1.86.
➡️ After this recovery (wave 2 or B), expect further downside, potentially breaking blue support.


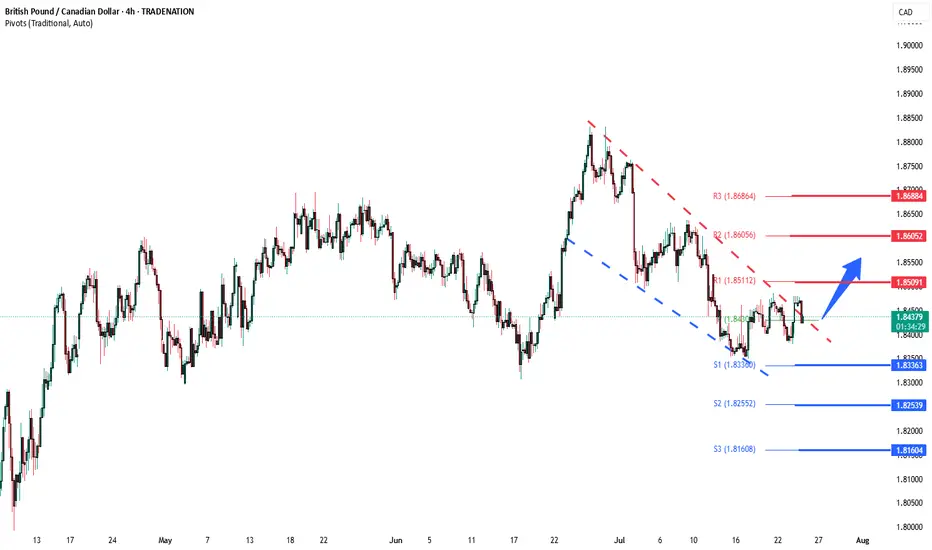
GBPCAD Bullish breakout supported at 1.8336The GBPCAD remains in a bullish trend, with recent price action showing signs of a corrective pullback within the broader uptrend.
Support Zone: 1.8336 – a key level from previous consolidation. Price is currently testing or approaching this level.
A bullish rebound from 1.8336 would confirm ongoing upside momentum, with potential targets at:
1.8510 – initial resistance
1.8600 – psychological and structural level
1.8690 – extended resistance on the longer-term chart
Bearish Scenario:
A confirmed break and daily close below 1.8336 would weaken the bullish outlook and suggest deeper downside risk toward:
1.8254 – minor support
1.8160 – stronger support and potential demand zone
Outlook:
Bullish bias remains intact while the GBPCAD holds above 1.8336. A sustained break below this level could shift momentum to the downside in the short term.
This communication is for informational purposes only and should not be viewed as any form of recommendation as to a particular course of action or as investment advice. It is not intended as an offer or solicitation for the purchase or sale of any financial instrument or as an official confirmation of any transaction. Opinions, estimates and assumptions expressed herein are made as of the date of this communication and are subject to change without notice. This communication has been prepared based upon information, including market prices, data and other information, believed to be reliable; however, Trade Nation does not warrant its completeness or accuracy. All market prices and market data contained in or attached to this communication are indicative and subject to change without notice.
GBPCAD WE MOVEFX:GBPCAD , As we can see on the chart, Buyers aggressively reacted from these h4 demand zone throwing atomic bullish engulfing candle out of these zone to showed sign of strength. So buying around the Engulfing candle will surely be a wise moves base on the overall trend, Forget about the weak 50 and 200 ema that is currently above the price on this very chart. Buyers are in control.
GBP/CAD Analysis Is Ready Move Will Be FlyThis is a bullish trade setup for GBP/CAD on the 1-hour chart. Price is expected to rise from the current level (1.84177) after bouncing from a support zone. The chart shows two potential take profit levels:
TP1 at 1.84534
TP2 at 1.84914
Final target is 1.85278, with a stop loss placed below support at 1.83684. Arrows suggest possible upward price movements

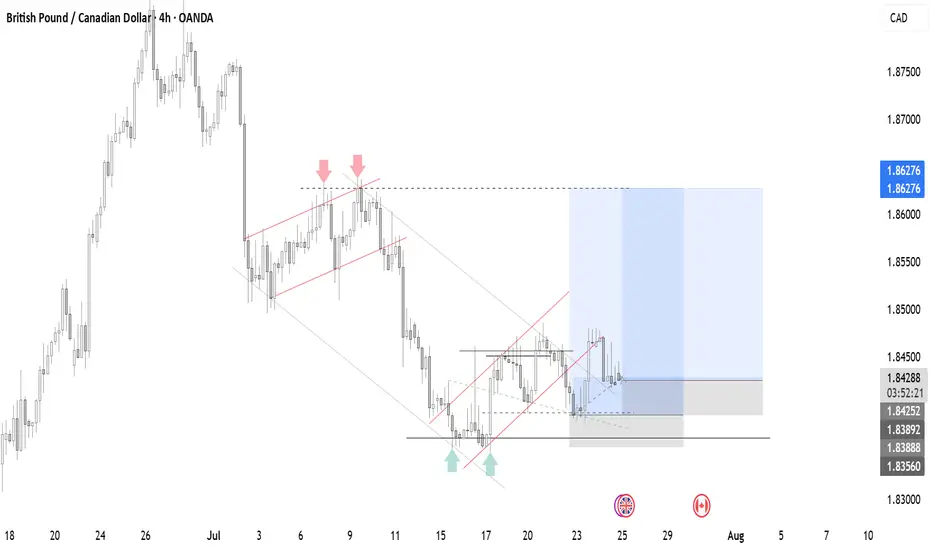
GBPCAD a short-term long trade into a HTF short area.GBPCAD presents a potential LTF long trade into a HTF short area. I am overall still bearish biased, but considering we have gaps to the top of the structure we might get an opportunity for a short-term counter long trade to finish the consolidation before we see the next bigger move to the downside.
📈 Simplified Trading Rules:
> Follow a Valid Sequence
> Wait for Continuation
> Confirm Entry (valid candlestick pattern)
> Know When to Exit (SL placement)
Remember, technical analysis is subjective; develop your own approach. I use this format primarily to hold myself accountable and to share my personal market views.
⚠ Ensure you have your own risk management in place and always stick to your trading plan.
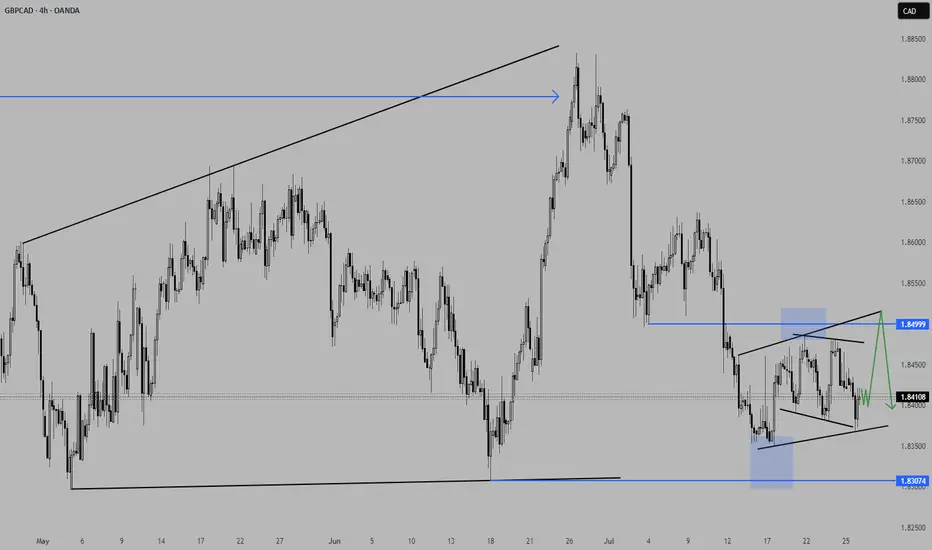
GBPCAD | One Kiss at 1.8390, and I’m All In!The big picture of GBPCAD is BUY possible up to 1.8550
See the H4 BUY range?
It slid love note to BUY into my DMs since 17/JulY. I didn't fall blindly since H4 SELL range came in like a jealous ex.
So I flipped to SELL and I shared my love signal with you here. (check my last week GBPCAD signal).
See that bottom black line at 1.8370?
It got a gentle kiss from the Daily candle (REJECTION).
Then 15m already whispered, "a sweet breakout"!
📌LONG STORY SHORT, I'M BUY AT 1.8390
If H4 comes and kisses 1.8390 (just a touch and wick), I’m BUYING — no more playing hard to get. 😘
TP? 1.8490 — that’s a sweet 100-pips date night!
But if it cuddles (closes by body) That’s it — my heart will be broken. 💔
WISH ME LUCK...or TISSUES! 😂!!!

GBPCAD DOUBLE BOTTOMAs CAD currency interest rate didn’t surprise to the market. Hence, it is not favourable to trader and investor. From the daily chart it is remain in upward trend line. Yesterday the chart had break through the Tuesday candle which shows that it has some buyer from there.

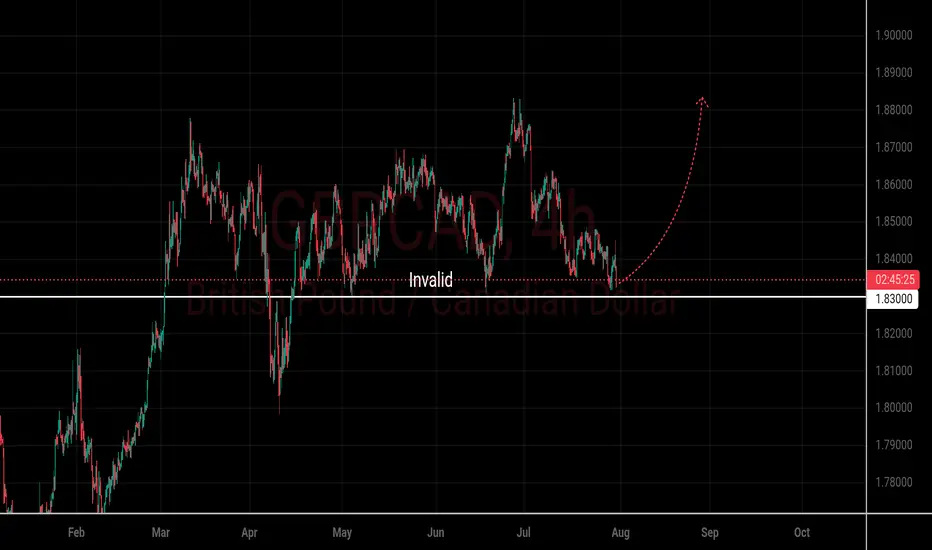
GBPCAD 4H The price appears to be forming a strong support zone around the 1.8350 level, as marked by the horizontal gray area. This level has been tested multiple times, suggesting accumulation and potential exhaustion of selling pressure.
🔄 Scenario: If the support holds, GBP/CAD could bounce and head towards the 1.8800–1.8900 area, as illustrated by the projected path.
✅ Bullish Bias if:
Price holds above 1.8350
Breakout above minor highs near 1.8450
Positive momentum from news or fundamentals
🚫 Invalidation:
Clean break below 1.8300 could trigger further downside.
---
⚠️ Disclaimer
> This chart is for educational and informational purposes only. It does not constitute financial advice or a recommendation to buy or sell any financial instrument. Always conduct your own research and consult a licensed financial advisor before making trading decisions.
GBPCAD: Growth & Bullish Continuation
The price of GBPCAD will most likely increase soon enough, due to the demand beginning to exceed supply which we can see by looking at the chart of the pair.
Disclosure: I am part of Trade Nation's Influencer program and receive a monthly fee for using their TradingView charts in my analysis.
❤️ Please, support our work with like & comment! ❤️

GBPCAD 15M SHORT BUY THEN BIG SELL15m range turn SELL
Note: The 15 SELL is inside BUY range.
So we need to BUY first
WAIT for confirmation around 1.8425. Once done price will bull up to 1.8466-1.8480 before SELL to 1.8380

GBPCAD new bearish expecting
OANDA:GBPCAD last analysis we are be accurate (attached), currently continuation type, RAISING WEDGE pattern visible, we are have strong bearish push, and still expectations are bearish.
SUP zone: 1.85000
RES zone: 1.83000, 1.82200

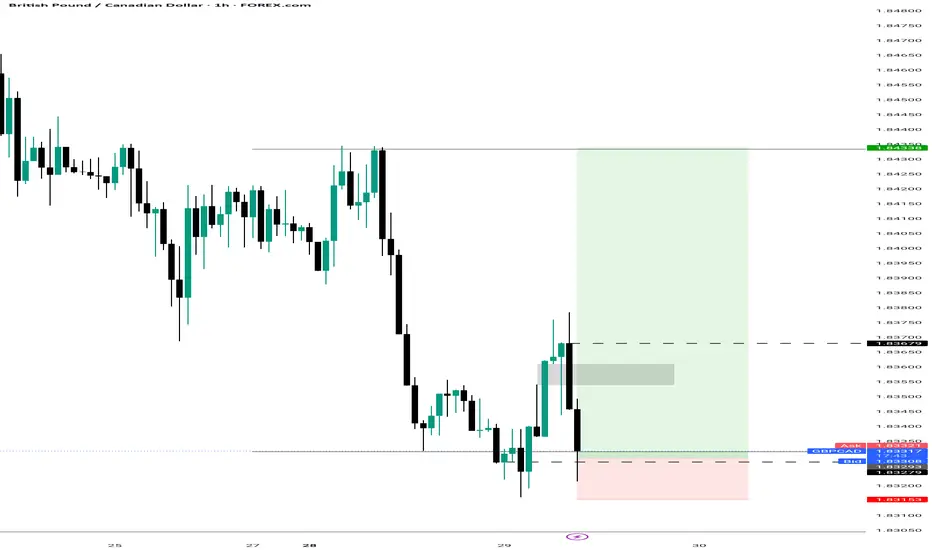
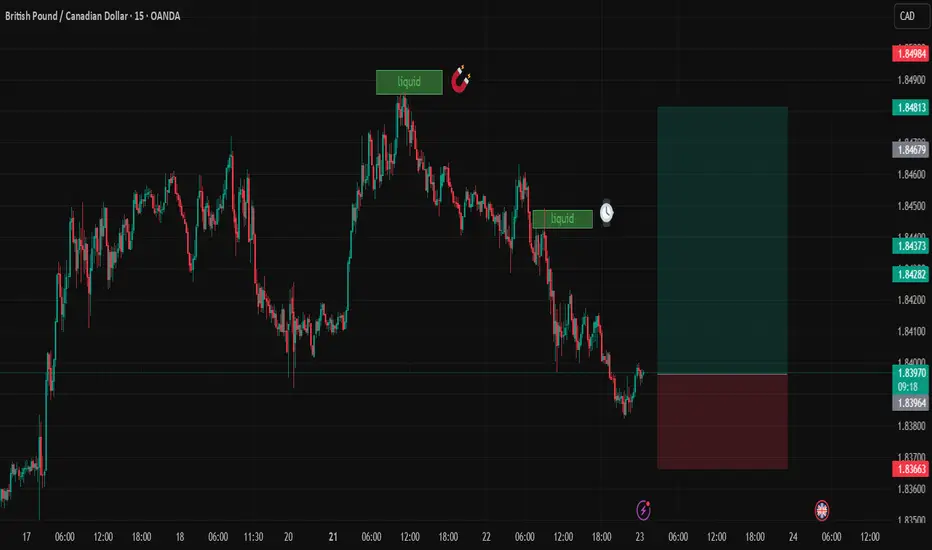
GBPCADDate:
July 23,2025
Session:
Tokyo and London session
Pair:
GBPCAD
Bias:
Long
2 liquidity pools that are waiting to be swept this week. Looks like price is gonna be magnetized towards these levels during London and Tokyo. The trade may even stretch into NYC.
Entry: 1.83970
Stop Loss: 1.83674
Target: 1.84811
RR: 2.82
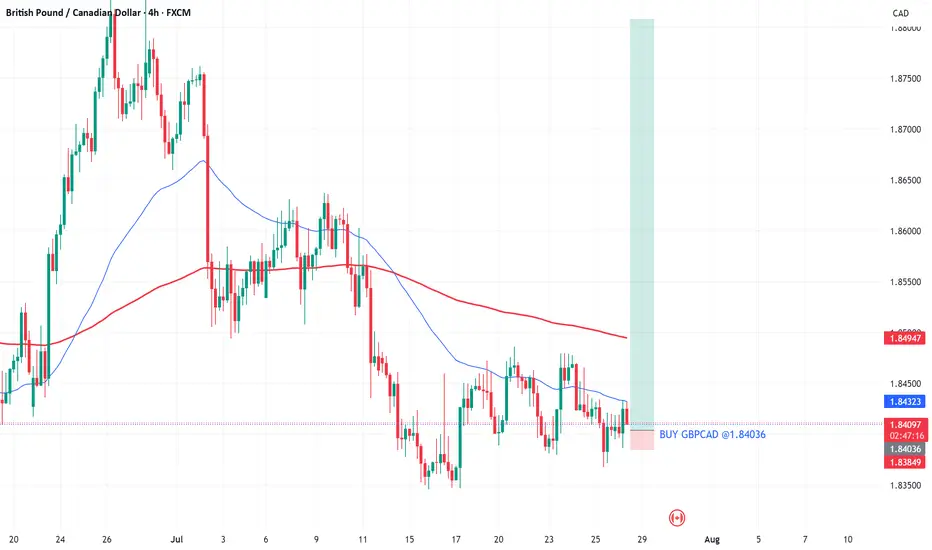
BUY GBPCADHere is an opportunity to reenter buy positions on GBPCAD. The bullish trend has officially began.
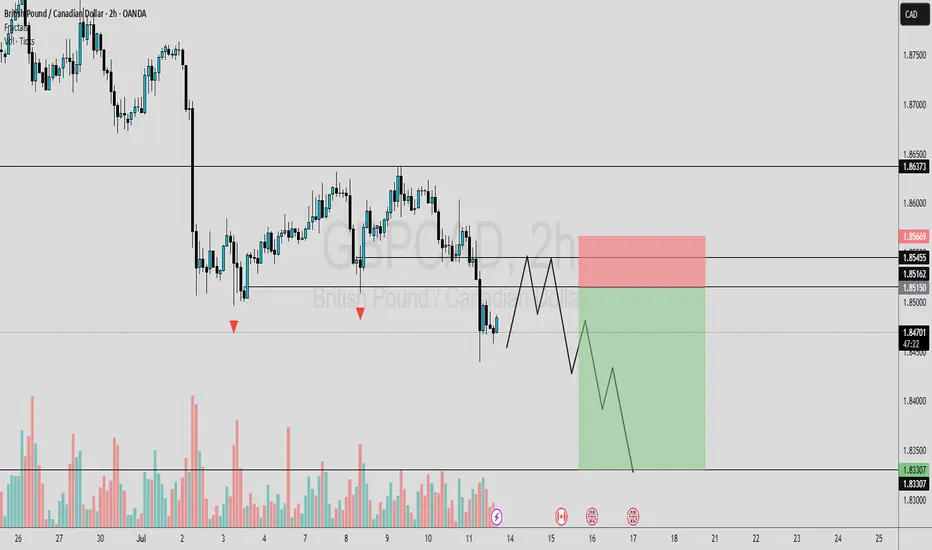
GBPCAD OUTLOOKIn this analysis we're focusing on 2H time frame for finding possible upcoming movement in price. So as per my strategy today I'm looking for a sell trade opportunity. Confirmation is very important, after confirmation we'll execute our trade. Let's see which opportunity market will give us.
Always use stoploss for your trade.
Always use proper money management and proper risk to reward ratio.
This is my prediction.
#GBPCAD 1H Technical Analysis Expected Move.
#011: Long Investment Opportunity on GBP/CAD
After weeks of compression, GBP/CAD is showing clear signs of institutional accumulation. The price recently released a false bearish breakout below 1.8400, followed by a reabsorption and spike with decreasing volumes: a typical "retail flush" structure.
Added to this are clear macro elements:
The pound is supported by a still-tight monetary policy, with the BoE maintaining a hawkish tone.
The Canadian dollar is suffering from declining oil expectations and the risk of a more rapid rate cut by the BoE.
📉 What happened?
The market attempted to "clear" the 1.838–1.840 zone with a rapid, unfollow-through bearish move. This behavior, combined with the Open Interest reading and retail positioning, suggests an institutional entry intention in the area between 1.8375 and 1.8365.
📈 Positioning
A Buy Limit was placed at 1.83740, with a wide Stop Loss at 1.82890, outside any visible hunting zone, and a Take Profit at 1.86280, where profit-taking has historically occurred on similar patterns.
🎯 Main motivations for long
Accumulation visible with stop-hunt below support at 1.8400
Net long GBP futures position
Retail short above 70%, a typical reversal signal
No significant volume obstacles until 1.8620
Psychological resistance already tested (1.846, 1.850)
⏳ Estimated timeframe
The setup could develop over several days, with the first movement as early as today (Friday) and completion by mid-next week. The intention is to follow the banking flow, without anticipating or reacting to emotional price movements.
