GBPCAD 4H long setupGBPCAD 4H Spring 💡 | Smart Money Accumulation Before Expansion
Watching a textbook Wyckoff spring unfold here on the 4H.
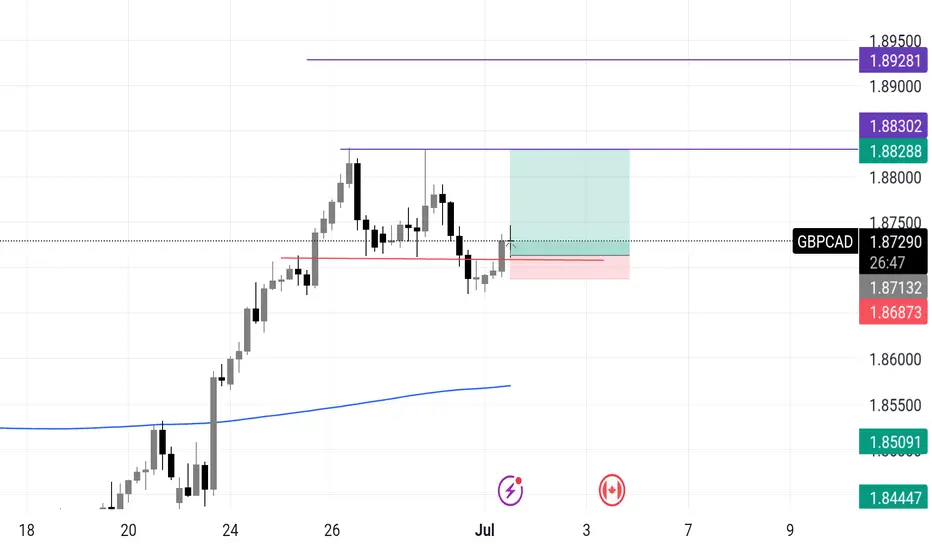
After a multi-day rally, price retraced, and liquidity built up just above 1.8713. What happened next?
🔻 We got a liquidity sweep, tagging below 1.8687 — then a sharp rejection wick back into the range. That’s the spring.
🧠 Why this matters:
Liquidity below the range is now likely cleared.
Smart money triggered stops and may now flip positioning.
Buyer momentum reclaiming the broken zone signals strength returning.
🎯 My Play:
Long entry after reclaim above 1.8713
Stop below 1.8687 wick low
Targeting 1.8828 > 1.8830 as TP1
Extended TP at 1.8928 — aligning with prior supply zone
⚠️ Invalidation if we lose 1.8685 with momentum and no absorption.
This is not a chase trade — it’s a calculated entry after weak hands were shaken out. Let the market prove strength, then ride the reversion.
📈 If this spring holds, I expect continuation toward prior highs.
GBPCAD trade ideas
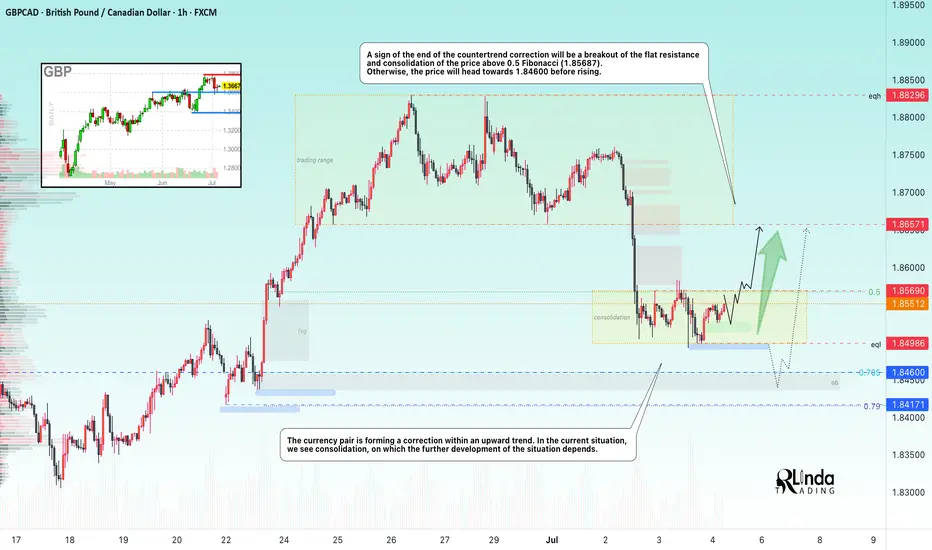
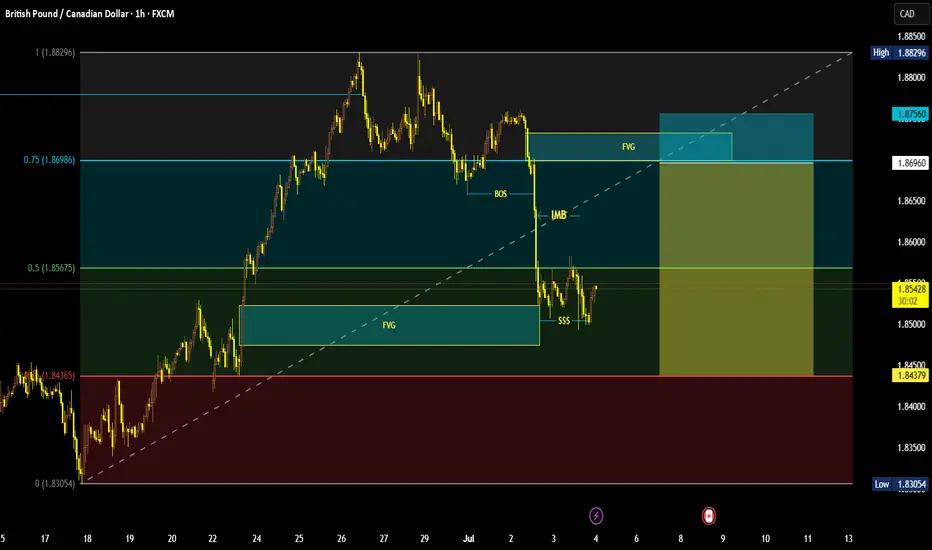
GBPCAD → Retest the area of interest before growthFX:GBPCAD is closing the imbalance area as part of a countertrend correction and consolidating below the 0.5 Fibonacci level. What's next, growth or decline?
The global trend is upward, and the situation is classic: the market needs energy and liquidity to continue growing.
Locally, we see that as part of a countertrend correction, the market is closing the imbalance area, but at the same time forming consolidation below 0.5 Fibonacci, still leaving the zone of interest and order block below 1.84600 untouched.
Technically, there is a fairly high probability of continued growth, provided that the price ends its consolidation with a breakout of the 1.85690 resistance and consolidates above 0.5 Fibonacci.
Resistance levels: 1.85690, 1.8657
Support levels: 1.84986, 1.846, 1.8417
However, as an additional and, in my opinion, the most important scenario, I still consider a complete closure of the fvg and a retest of the 0.7-0.79 zone, within which the order block is located. A false breakdown of the zone of interest and the capture of liquidity could attract additional interest, which would trigger growth.
Best regards, R. Linda!
GBPCAD: Your Trading Plan Explained 🇬🇧🇨🇦
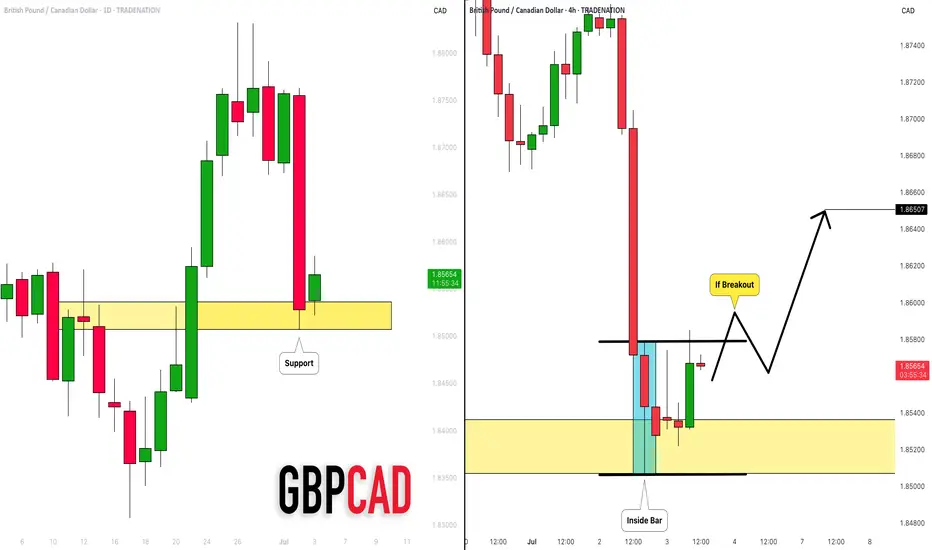
GBPCAD is coiling on an important daily support cluster.
To trade that with a confirmation, pay attention to
an inside bar pattern on a 4H.
1.8579 is the level of an upper boundary of its range.
Its breakout and a 4H candle close above will provide
a strong bullish signal.
A bullish movement will be expected to 1.865 level then.
❤️Please, support my work with like, thank you!❤️
I am part of Trade Nation's Influencer program and receive a monthly fee for using their TradingView charts in my analysis.
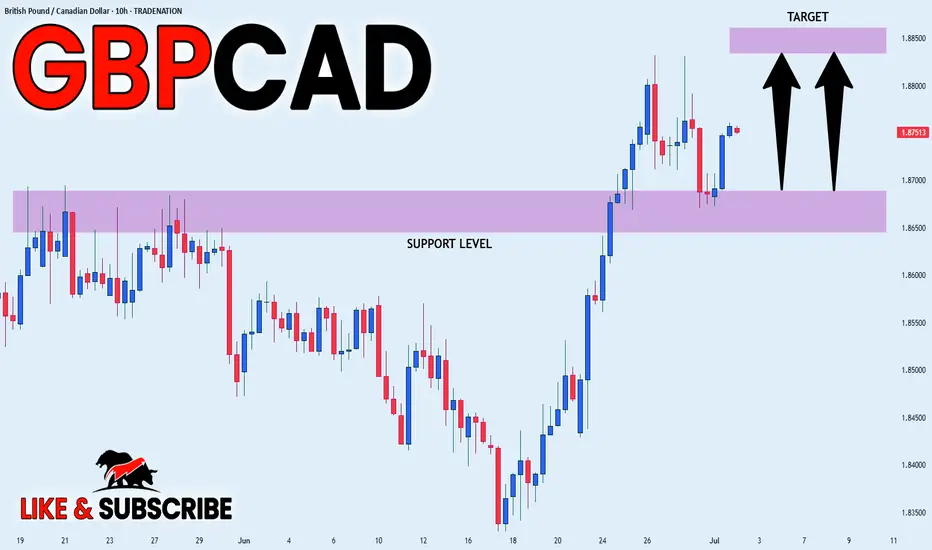
GBPCAD: Bullish Continuation Ahead?! 🇬🇧🇨🇦
One of the pairs that we discussed on the today's live stream
is GBPCAD.
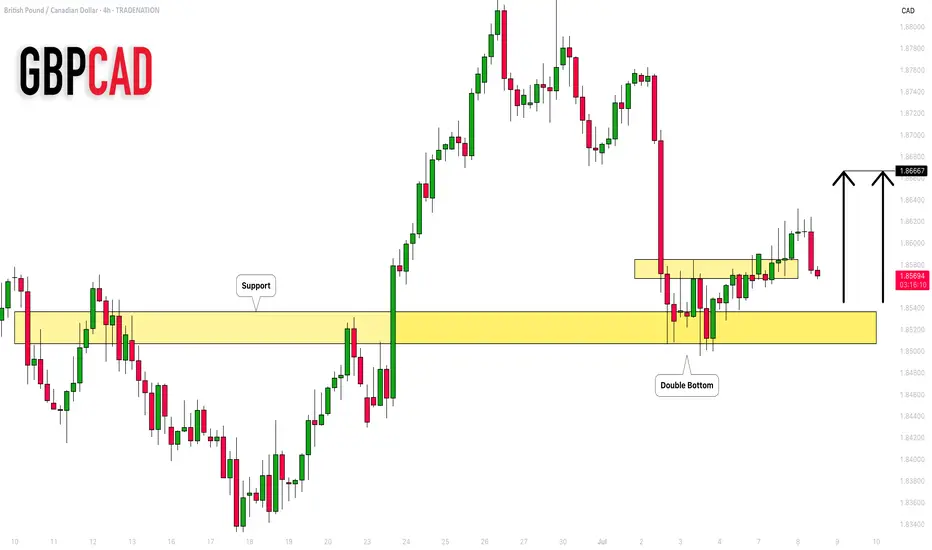
The price nicely respected a key daily/intraday horizontal support.
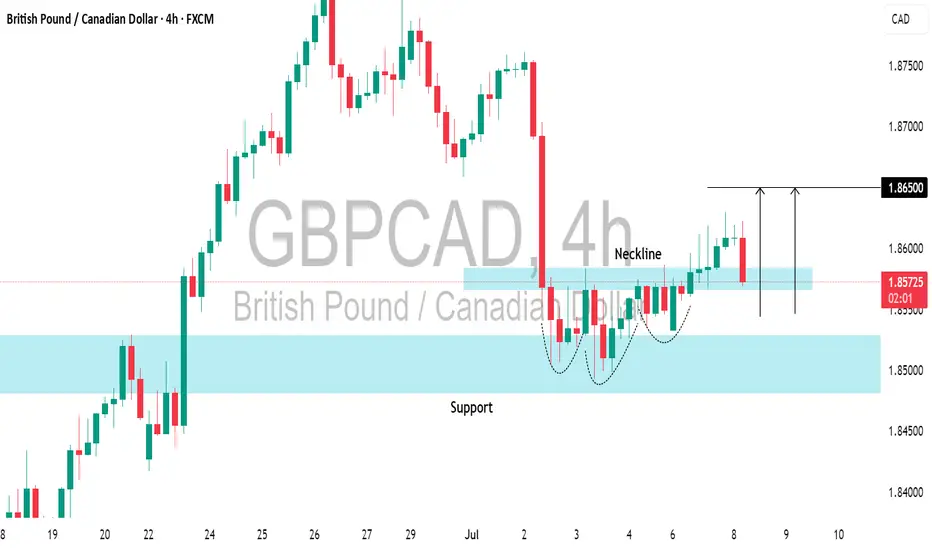
A double bottom pattern on that and a bullish violation of its neckline
provide strong bullish confirmations.
I expect up move to 1.8666
❤️Please, support my work with like, thank you!❤️
I am part of Trade Nation's Influencer program and receive a monthly fee for using their TradingView charts in my analysis.
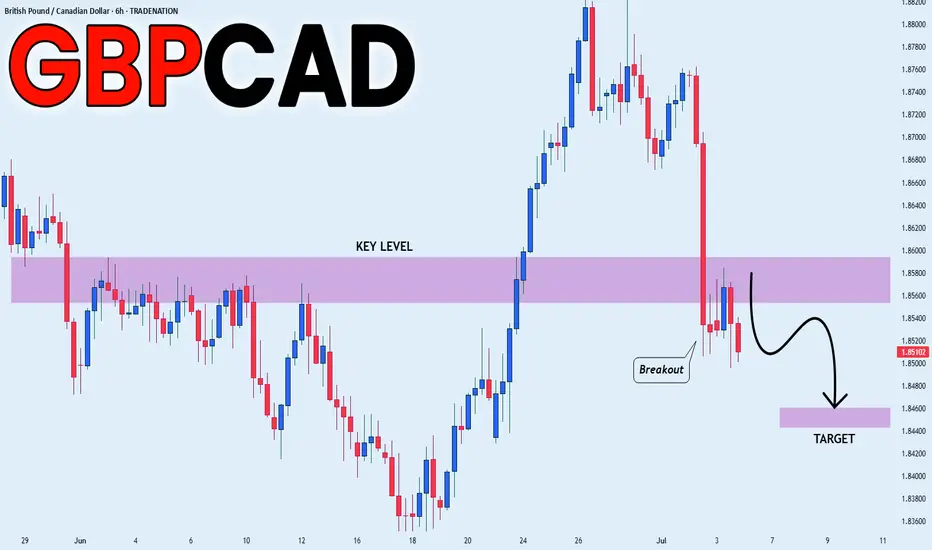
Looking at a bearish marketWe have a clear dealing range with the dealing range high at 1.88296 and dealing range low at 1.83054. This appear to be a bearish market because the daily liquidity has been raided and the structure has been broken to the downside to mitigate the fair value gap around the equilibrium price. We are ideally anticipating price to rebalance the imbalance and active the fair value gap at the extreme premium and provide us with a selling opportunity to the discounted area…
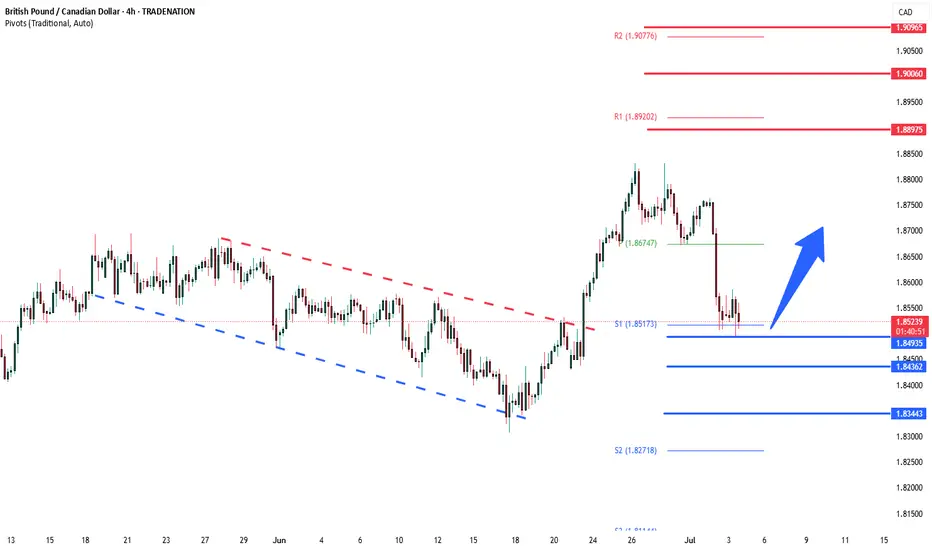
GBPCAD corrective pullback, support retest at 1.8500The GBPCAD currency pair price action sentiment appears Bullish, supported by the current rising trend. The recent intraday price action seems to be a sideways consolidation breakout.
The key trading level is at the 1.8500 level, the previous consolidation price range. A corrective pullback from the current levels and a bullish bounce back from the 1.8500 level could target the upside resistance at 1.8890, followed by the 1.9000 and 1.9090 levels over the longer timeframe.
Alternatively, a confirmed loss of the 1.8500 support and a daily close below that level would negate the bullish outlook, opening the way for a further retracement and a retest of 1.8430 support level, followed by 1.83450 levels.
Conclusion:
As long as 1.8500 holds, the bias remains bullish, favouring continuation toward the 1.8900 zone. A confirmed break below this support would shift momentum, opening the door for a broader corrective decline.
This communication is for informational purposes only and should not be viewed as any form of recommendation as to a particular course of action or as investment advice. It is not intended as an offer or solicitation for the purchase or sale of any financial instrument or as an official confirmation of any transaction. Opinions, estimates and assumptions expressed herein are made as of the date of this communication and are subject to change without notice. This communication has been prepared based upon information, including market prices, data and other information, believed to be reliable; however, Trade Nation does not warrant its completeness or accuracy. All market prices and market data contained in or attached to this communication are indicative and subject to change without notice.
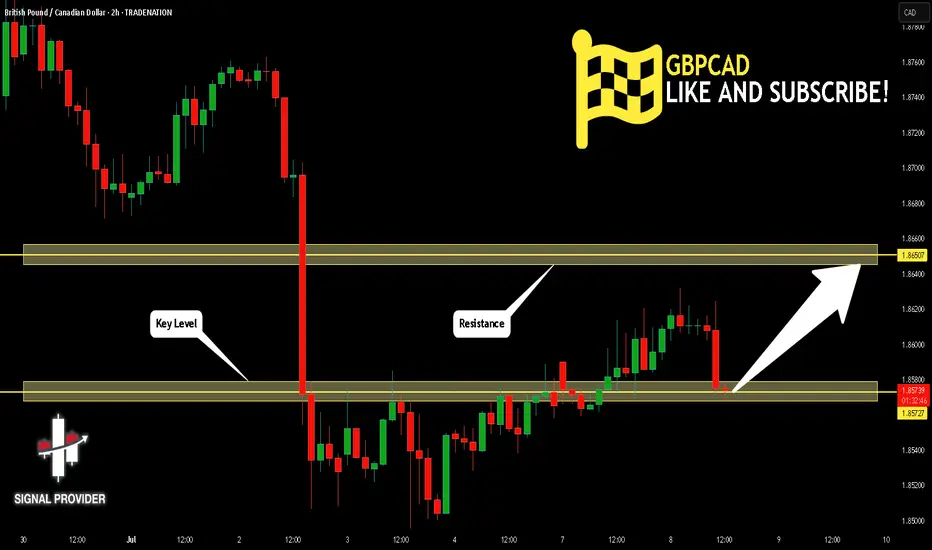
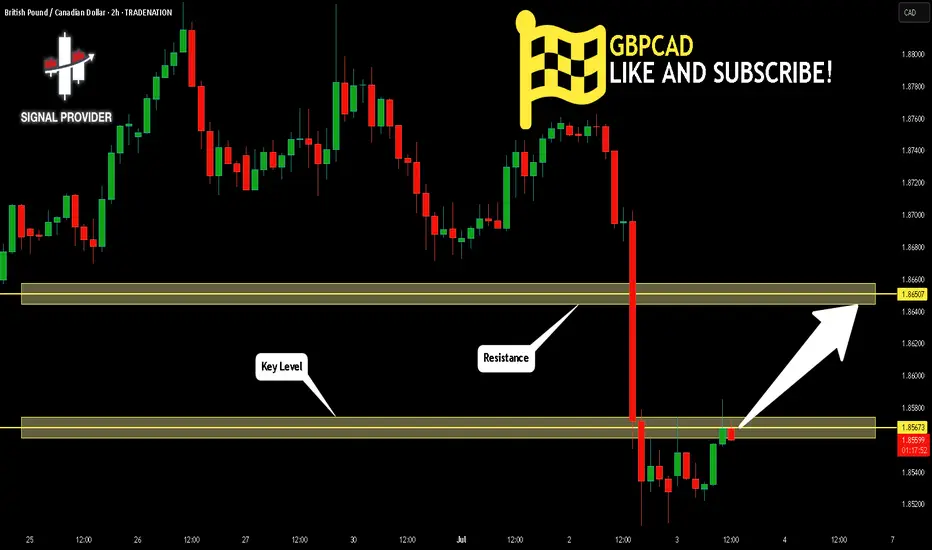
GBPCAD Will Grow! Long!
Please, check our technical outlook for GBPCAD.
Time Frame: 2h
Current Trend: Bullish
Sentiment: Oversold (based on 7-period RSI)
Forecast: Bullish
The market is approaching a key horizontal level 1.857.
Considering the today's price action, probabilities will be high to see a movement to 1.865.
P.S
Overbought describes a period of time where there has been a significant and consistent upward move in price over a period of time without much pullback.
Disclosure: I am part of Trade Nation's Influencer program and receive a monthly fee for using their TradingView charts in my analysis.
Like and subscribe and comment my ideas if you enjoy them!
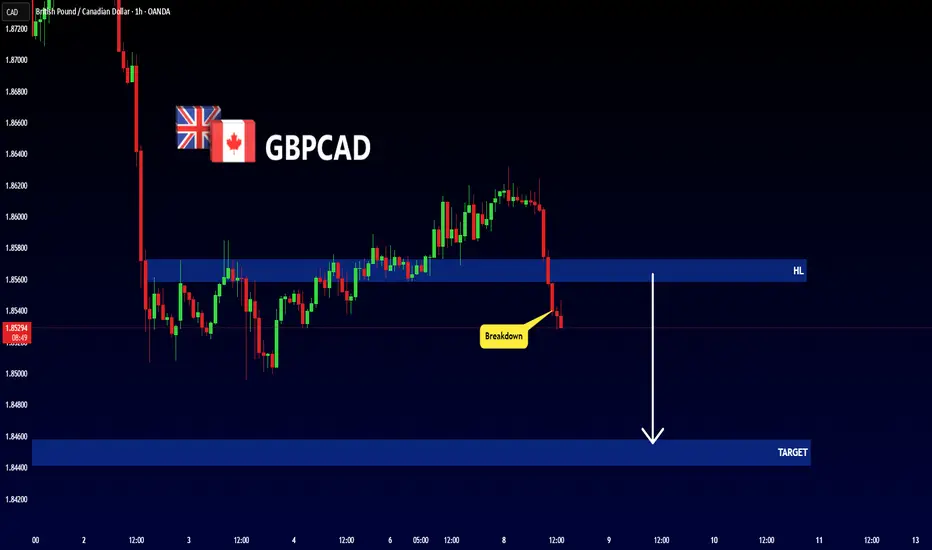
GBPCAD - BEARISH MOVE !Hello Traders !
On the 1h time frame,
The GBPCAD price broke the higher low (change of character).
So, I expect a bearish move📉
______________
TARGET: 1.84580🎯
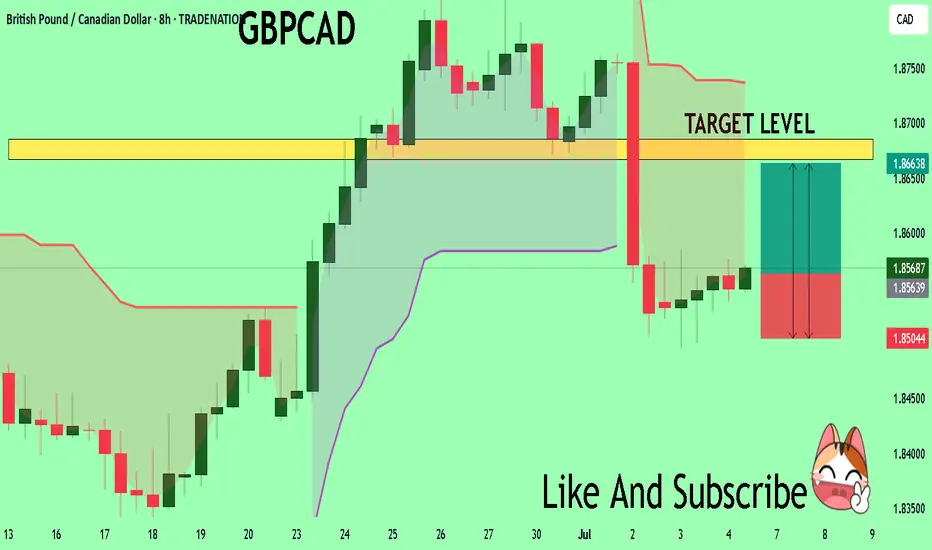
GBPCAD Will Explode! BUY!
My dear followers,
I analysed this chart on GBPCAD and concluded the following:
The market is trading on 1.8563 pivot level.
Bias - Bullish
Technical Indicators: Both Super Trend & Pivot HL indicate a highly probable Bullish continuation.
Target - 1.8667
Safe Stop Loss - 1.8504
About Used Indicators:
A super-trend indicator is plotted on either above or below the closing price to signal a buy or sell. The indicator changes color, based on whether or not you should be buying. If the super-trend indicator moves below the closing price, the indicator turns green, and it signals an entry point or points to buy.
Disclosure: I am part of Trade Nation's Influencer program and receive a monthly fee for using their TradingView charts in my analysis.
———————————
WISH YOU ALL LUCK
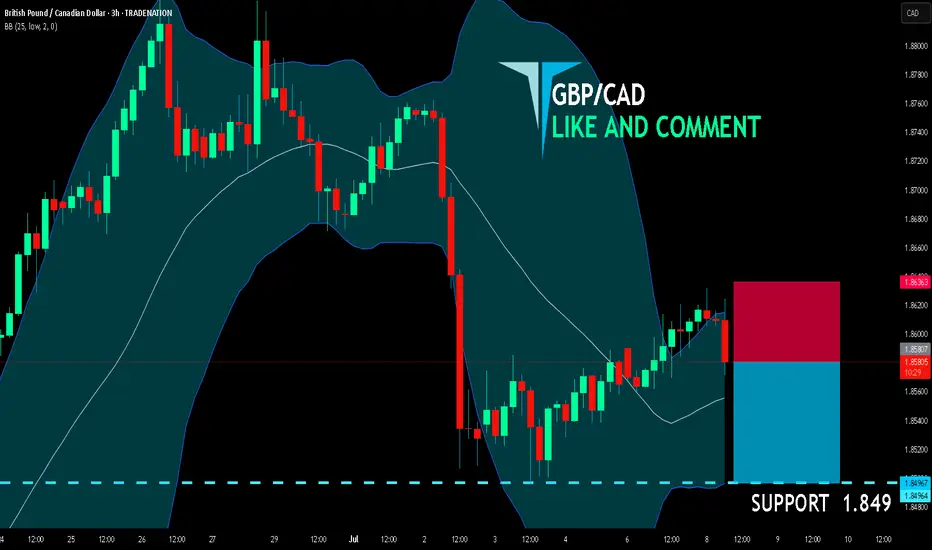
GBP/CAD BEARS ARE GAINING STRENGTH|SHORT
GBP/CAD SIGNAL
Trade Direction: short
Entry Level: 1.858
Target Level: 1.849
Stop Loss: 1.863
RISK PROFILE
Risk level: medium
Suggested risk: 1%
Timeframe: 3h
Disclosure: I am part of Trade Nation's Influencer program and receive a monthly fee for using their TradingView charts in my analysis.
✅LIKE AND COMMENT MY IDEAS✅
GBP/CAD Very Near Selling Area , Ready To Get 200 Pips ?Here is my daily chart on GBP/CAD , We have a very good res area the price very near it now and i`m waiting for touch for this res area and then i will enter a sell trade and targeting 200 pips at least , just waiting the price to give ma a good bearish price action from my res area and then i will enter . if the price close with daily candle above my res then this idea will not be valid .

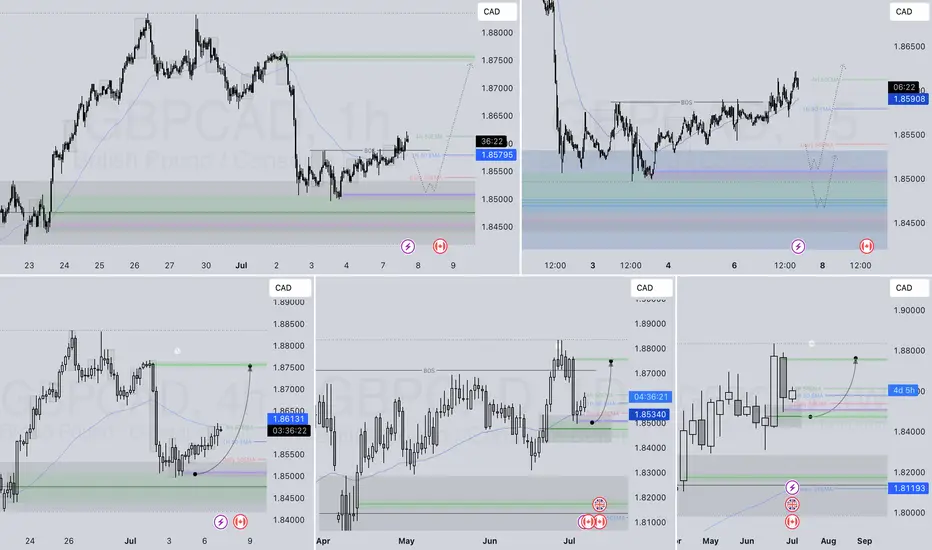
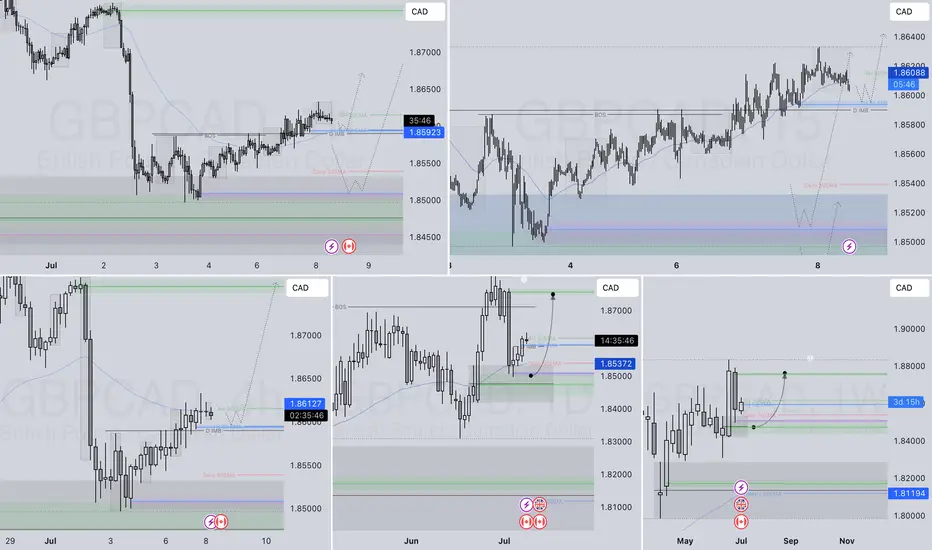
GBPCAD LONG FORECAST Q3 W28 Y25GBPCAD LONG FORECAST Q3 W28 Y25
Professional Risk Managers👋
Welcome back to another FRGNT chart update📈
Diving into some Forex setups using predominantly higher time frame order blocks alongside confirmation breaks of structure.
Let’s see what price action is telling us today! 👀
💡Here are some trade confluences📝
✅Daily Order block identified
✅4H Order Block identified
✅1H Order Block identified
🔑 Remember, to participate in trading comes always with a degree of risk, therefore as professional risk managers it remains vital that we stick to our risk management plan as well as our trading strategies.
📈The rest, we leave to the balance of probabilities.
💡Fail to plan. Plan to fail.
🏆It has always been that simple.
❤️Good luck with your trading journey, I shall see you at the very top.
🎯Trade consistent, FRGNT X
GBP_CAD BEARISH BREAKOUT|SHORT|
✅GBP_CAD broke the key structure level of 1.8580
While trading in an local downtrend
Which makes me bearish
And as the retest of the level is complete
Bearish continuation will follow
SHORT🔥
✅Like and subscribe to never miss a new idea!✅
Disclosure: I am part of Trade Nation's Influencer program and receive a monthly fee for using their TradingView charts in my analysis.
GBPCAD LONG FORECAST Q3 D8 W28 Y25GBPCAD LONG FORECAST Q3 D8 W28 Y25
Professional Risk Managers👋
Welcome back to another FRGNT chart update📈
Diving into some Forex setups using predominantly higher time frame order blocks alongside confirmation breaks of structure.
Let’s see what price action is telling us today! 👀
💡Here are some trade confluences📝
✅Daily Order block identified
✅4H Order Block identified
✅1H Order Block identified
🔑 Remember, to participate in trading comes always with a degree of risk, therefore as professional risk managers it remains vital that we stick to our risk management plan as well as our trading strategies.
📈The rest, we leave to the balance of probabilities.
💡Fail to plan. Plan to fail.
🏆It has always been that simple.
❤️Good luck with your trading journey, I shall see you at the very top.
🎯Trade consistent, FRGNT X
GBPCAD: Classic Pullback Trade for TodayThe GBPCAD pair formed a head and shoulders pattern at a crucial daily/intraday horizontal support level.
The recent breach of its neckline indicates a notable strength of buyers, suggesting a bullish momentum.
Given this technical setup, I anticipate that the pair could rally and potentially reach the 1.8650 level in the near term.
GBP/CAD💰Symbol: { GBP/CAD }
🟩Price: { 1.86824 }
🟥Stop: { 1.87682 }
1️⃣profit: { 1.85663 }
2️⃣profit: { 1.84413 }
3️⃣profit: { 1.83550 }
4️⃣profit: { 1.83156 }
📊Check your chart before entering.
🚨Check before use to make sure there is no important news.🚨

GBPCAD Is Going Up! Long!
Here is our detailed technical review for GBPCAD.
Time Frame: 2h
Current Trend: Bullish
Sentiment: Oversold (based on 7-period RSI)
Forecast: Bullish
The market is trading around a solid horizontal structure 1.856.
The above observations make me that the market will inevitably achieve 1.865 level.
P.S
Please, note that an oversold/overbought condition can last for a long time, and therefore being oversold/overbought doesn't mean a price rally will come soon, or at all.
Disclosure: I am part of Trade Nation's Influencer program and receive a monthly fee for using their TradingView charts in my analysis.
Like and subscribe and comment my ideas if you enjoy them!
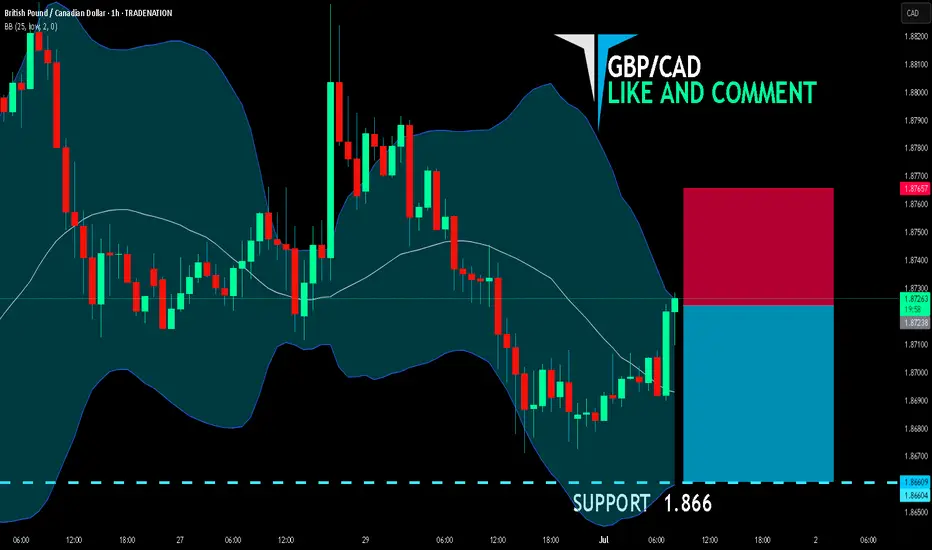
GBP/CAD SELLERS WILL DOMINATE THE MARKET|SHORT
GBP/CAD SIGNAL
Trade Direction: short
Entry Level: 1.872
Target Level: 1.866
Stop Loss: 1.876
RISK PROFILE
Risk level: medium
Suggested risk: 1%
Timeframe: 1h
Disclosure: I am part of Trade Nation's Influencer program and receive a monthly fee for using their TradingView charts in my analysis.
✅LIKE AND COMMENT MY IDEAS✅
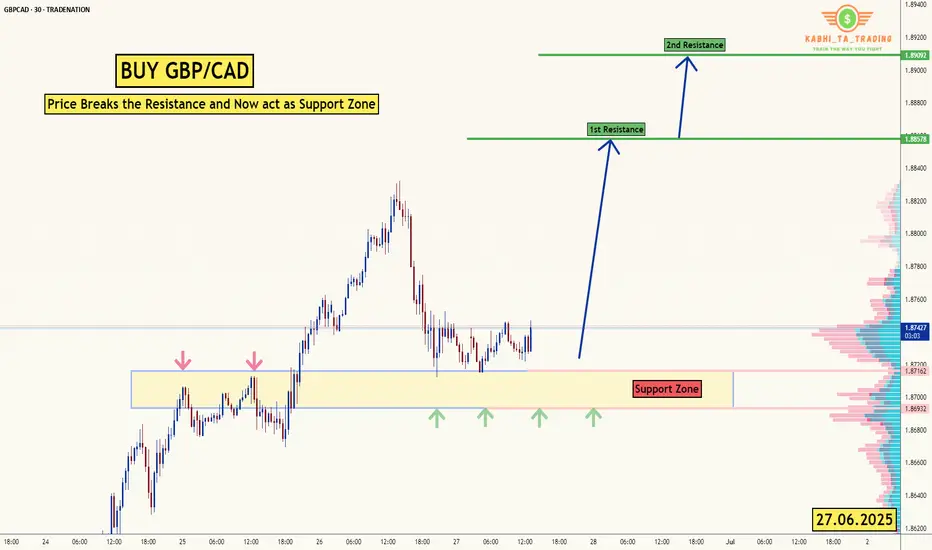
GBP/CAD - Breakout (27.06.2025)The GBP/CAD pair on the M30 timeframe presents a Potential Buying Opportunity due to a recent Formation of a Breakout Pattern. This suggests a shift in momentum towards the upside and a higher likelihood of further advances in the coming hours.
Possible Long Trade:
Entry: Consider Entering A Long Position around Trendline Of The Pattern.
Target Levels:
1st Resistance – 1..8857
2nd Resistance – 1.8909
🎁 Please hit the like button and
🎁 Leave a comment to support for My Post !
Your likes and comments are incredibly motivating and will encourage me to share more analysis with you.
Best Regards, KABHI_TA_TRADING
Thank you.
Disclosure: I am part of Trade Nation's Influencer program and receive a monthly fee for using their TradingView charts in my analysis.
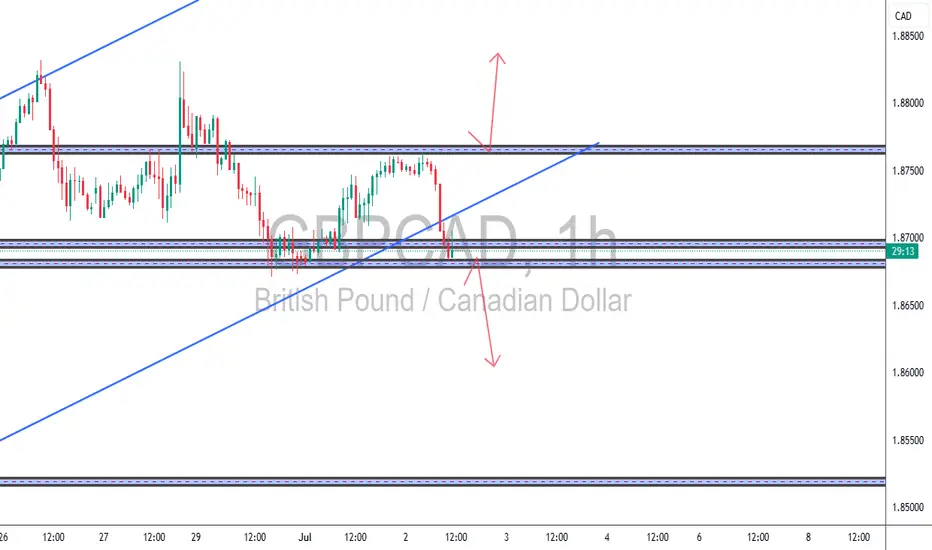
Solid TCB setup for GBPCAD✅ Trend (HTF Bias)
D1 and H4 are likely bullish (based on prior swing structure and channel direction).
The price was respecting the ascending channel until this sharp breakdown.
✅ Countertrend
A rising wedge / ascending channel is clearly visible.
The recent impulse down broke structure cleanly — textbook countertrend break.
✅ Breakout
Price has broken below the lower ascending trendline.
It’s now retesting the zone at ~1.8700–1.8710 (highlighted).
If this retest holds, it’s a high-probability sell setup.
📊 Total Score: ~95% TCB Trade Quality
🧾 Execution Thoughts:
Entry: Current price (~1.8701) after retest rejection.
SL: Just above 1.8730–1.8740 (above retest wick).
TP: ~1.8675 zone (bottom of the zone), for ~2R.
🔔 Verdict:
✅ It’s a solid TCB setup: Retest after clean break of structure, inside HTF channel break, with decent R:R.
You may wait for a confirming bearish candle
Trigger: Wait for bearish engulfing / rejection wick confirmation.
GBP_CAD WILL KEEP GROWING|LONG|
✅GBP_CAD is trading in an
Uptrend and the pair made a
Retest and a rebound from the
Horizontal support of 1.8675
So we are bullish biased and
We will be expecting a
Further bullish move up
LONG🚀
✅Like and subscribe to never miss a new idea!✅
Disclosure: I am part of Trade Nation's Influencer program and receive a monthly fee for using their TradingView charts in my analysis.
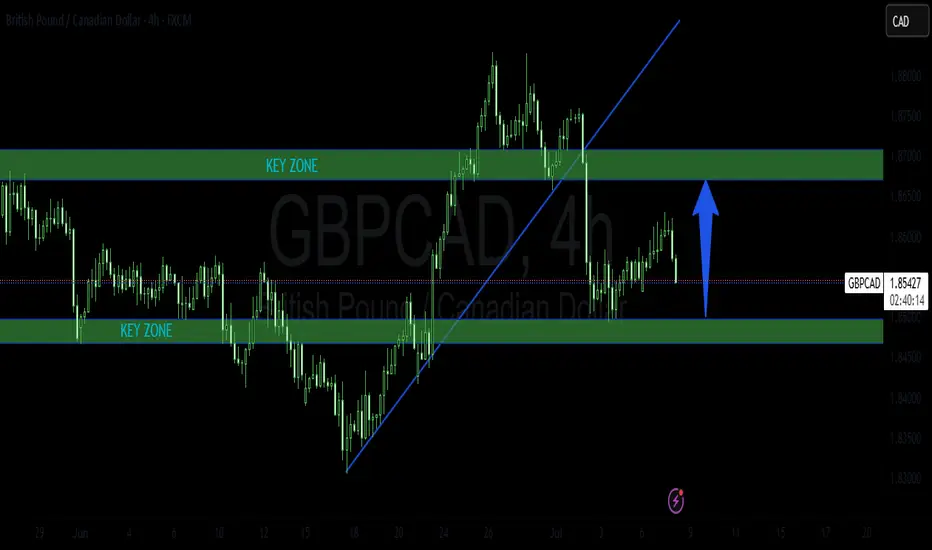
GBPCAD LONG TRADE PLANThe pair recently broke below the key area and bullish trend line on intraday signal a bearish move. This move nicely respected a strong key zone below and started a correction move. I believe this correction should continue up to the retest of the last key zone.
Please do your own analysis before placing any trades.
Cheers and Happy Trading !!!!
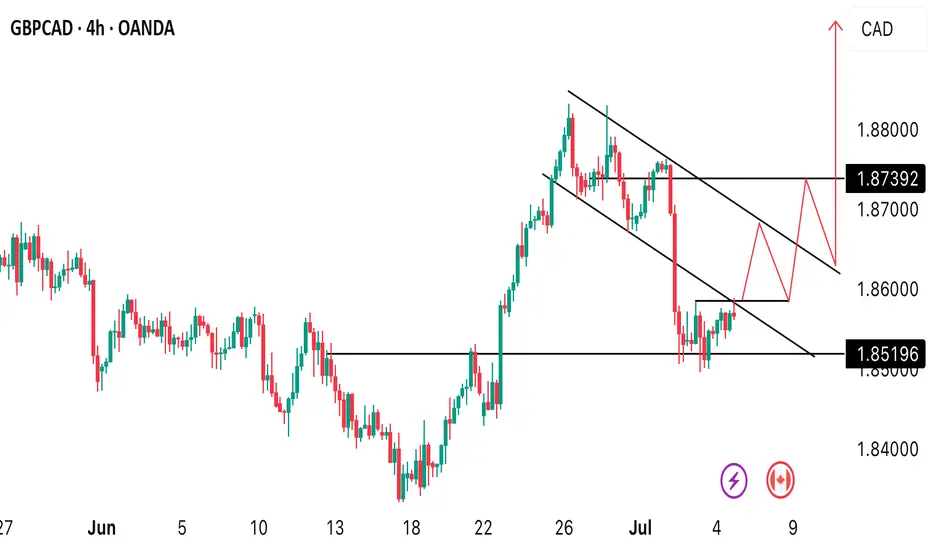
H4 STRUCTURAL LOOK OF GBPCADFrom the H4 market outlook. We’re seeing price reacting around a key level 1.85196. If we’d see price break above 1.85854 and lower trend of the emerging downward channel, we’d be going long