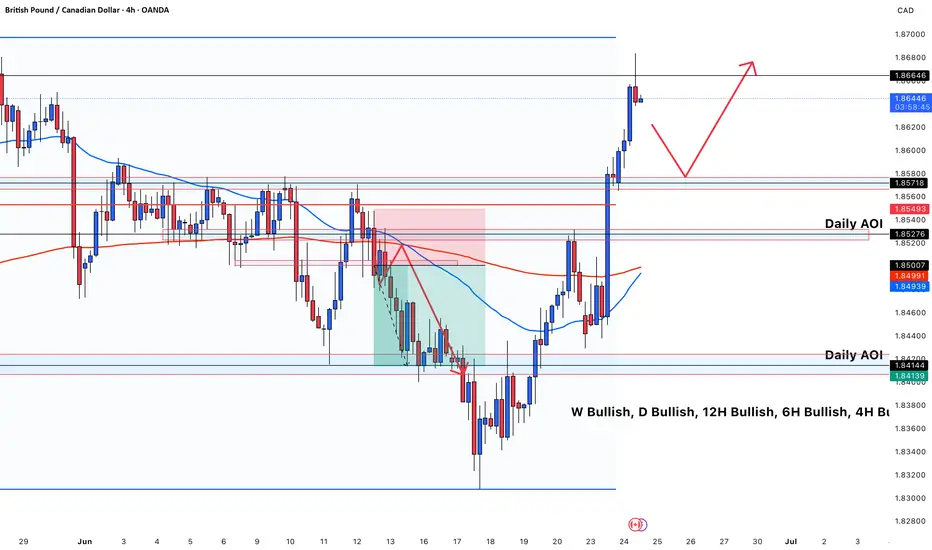
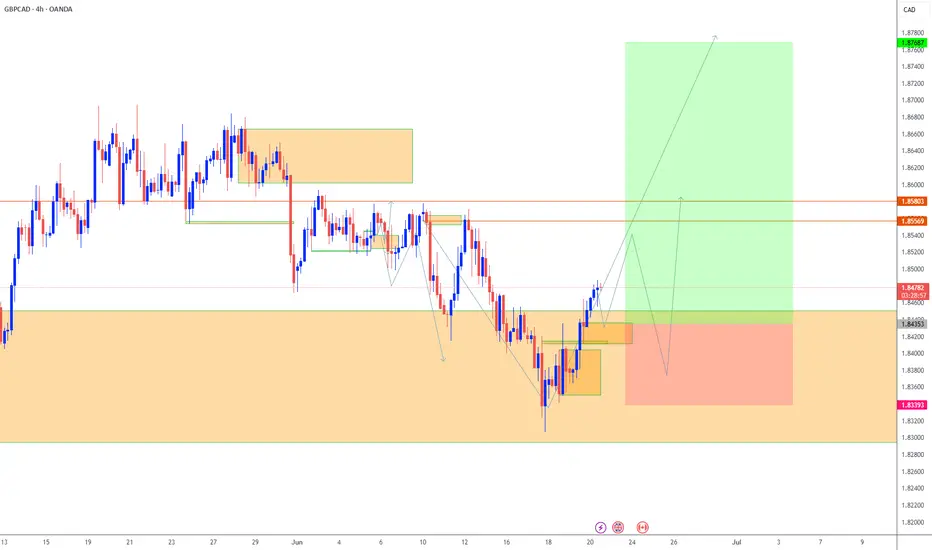
Ready for the Long?This is a **GBP/CAD 4H chart** with a clear **bullish bias** across multiple timeframes (W, D, 12H, 6H, 4H).
### Key Points:
* **Market Structure**: Strong bullish breakout above previous resistance zones, confirming a shift in momentum.
* **Current Price**: 1.8641, just below a key resistance level at **1.8664**.
* **Projection**: Expecting a **pullback** towards the **1.8571–1.8549 Daily AOI** zone, followed by a **bullish continuation** to the upside.
* **EMAs**:
* Price is above both the **50 EMA (blue)** and **200 EMA (red)**, confirming upward momentum.
* **Volume & Liquidity Zones**:
* The breakout cleared previous liquidity, indicating strength.
* The next major resistance is untested, suggesting more room for upside after a healthy retracement.
### Summary:
GBP/CAD is in a **strong uptrend**. After a short-term correction into the Daily AOI (support), a **continuation toward new highs** is anticipated if bullish order flow continues.
GBPCAD trade ideas
GBP/CADPrice action trading is a methodology in financial markets where traders make decisions based on the actual price movements of an asset over time, rather than relying heavily on technical indicators or fundamental analysis. It involves observing and interpreting patterns and trends in price charts to predict future price movements.
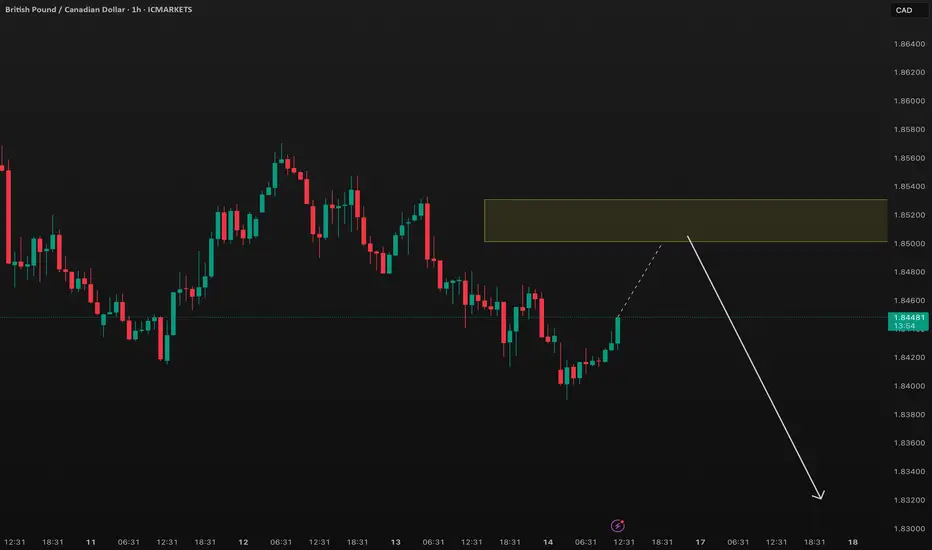
GBPCAD Sell IdeaWe see price downtrending on 4hr time frame — price is coming into our 4hr bearish engulfing getting ready to test to the downside. All we need is a counter trend line to break to confirm the idea!
Technical Zones & StructureTechnical Zones & Structure
🔹 Bearish Rejection Zone (Supply Area)
Price tapped into a strong supply zone at the top blue box, aligning with trendline resistance.
Immediate reaction followed by sharp bearish candle shows potential liquidity grab and smart money sell-off.
🔹 Demand Zone
Mid-chart gray/blue zone is a key reaction area that price may retest before confirming further downside.
Market Structure
I’ve drawn a rising wedge, which price has already broken down from = bearish reversal signal.
Pullback anticipated into the broken structure zone (gray) → potential entry zone for short.
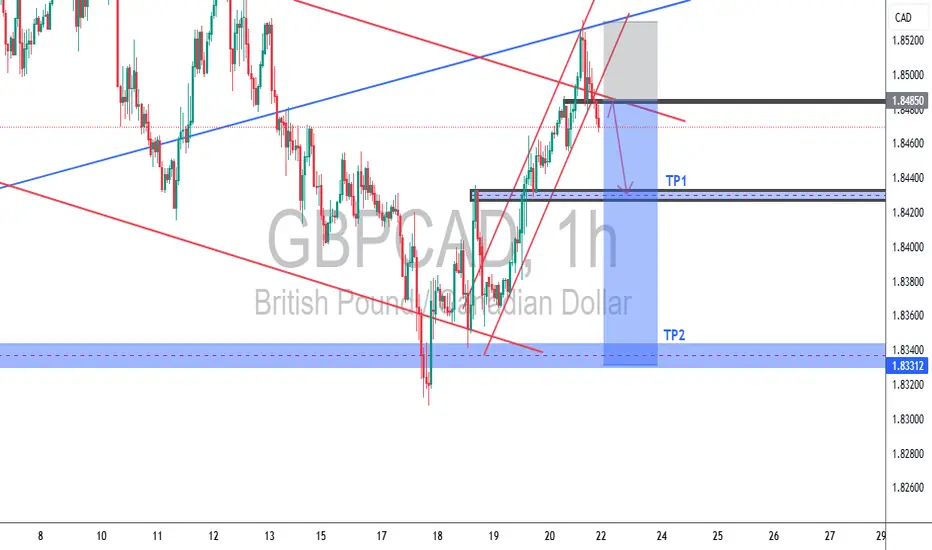
Trade Idea (as visualized)
Sell Setup Plan:
✅ Ideal Entry: Retest of broken wedge / demand-turned-supply (~1.84750–1.84900)
🎯 Target 1: 1.84300 zone
🎯 Target 2: 1.83500 (bottom demand zone)
🛑 SL: Above previous high / upper blue supply (~1.85300+)
SET and FORGET
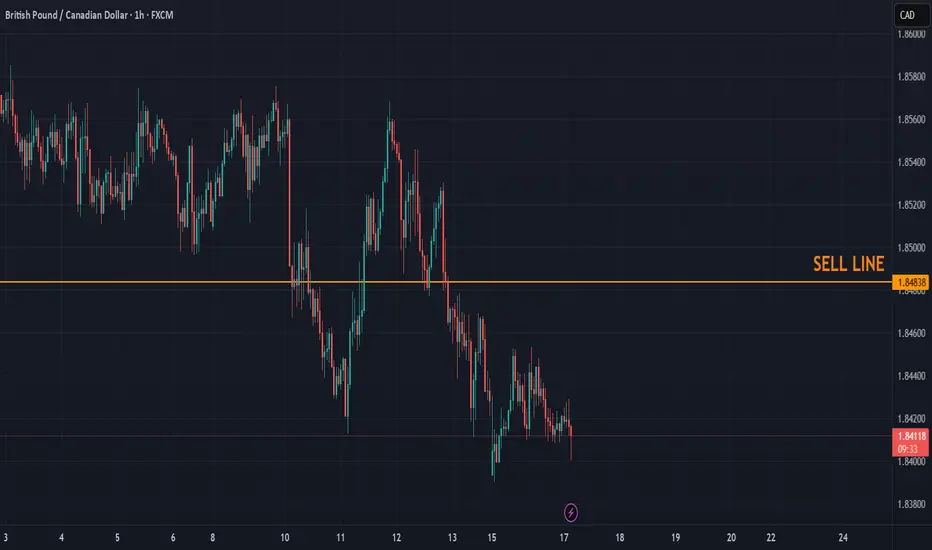
GBPCAD : SELL SETUP FORMED IN 4RSell @ 1.8460 or below
Target : 1.8225, 1.8000
Stoploss : 1.8560
Sell breakout and pullback done. Short entered at 1.8460

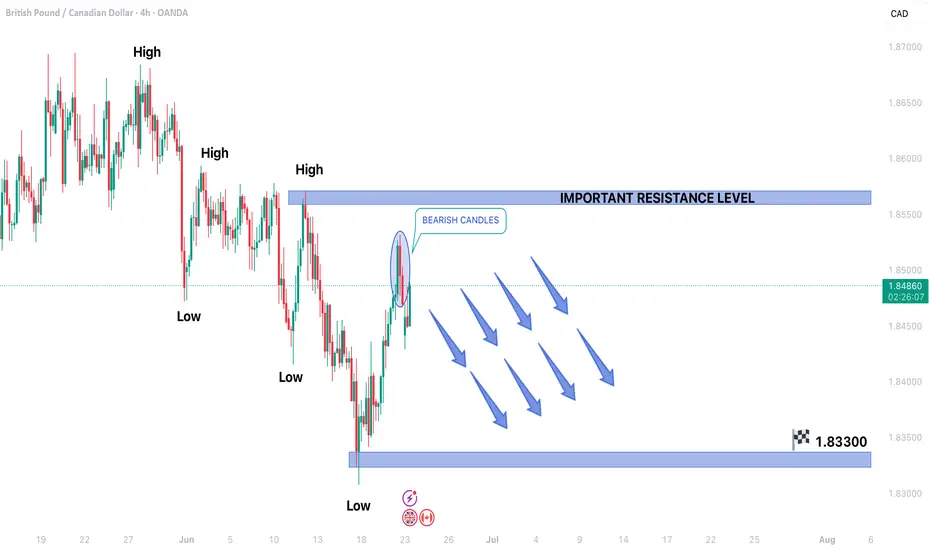
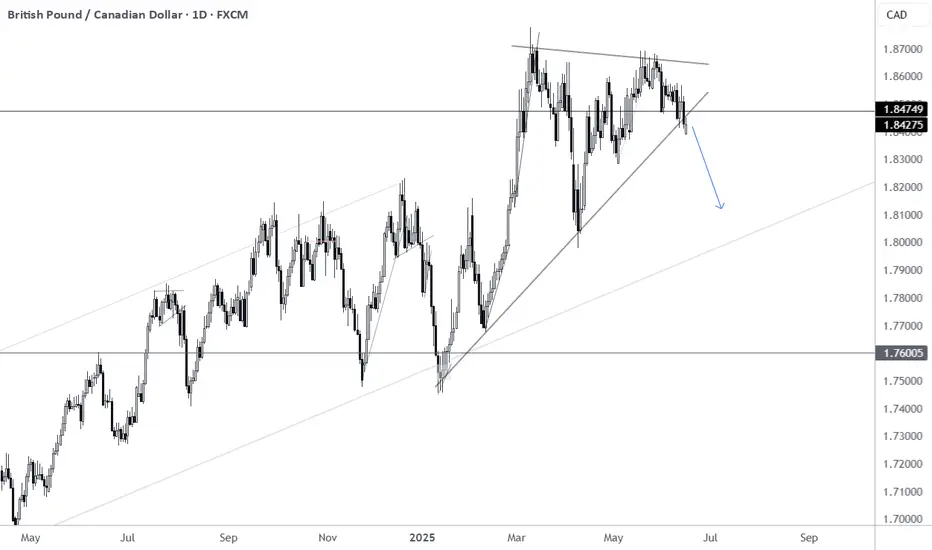
GBPCAD CONTINUING DOWNTREND STRUCTUREGBPCAD CONTINUING DOWNTREND STRUCTURE IN 4H TIME FRAME.
Price forming Lower Lows & Lower Highs.
After secondary trend market started forming bearish candles.
Showing signal of seller's entry in the market.
Market may remain bearish in upcoming trading sessions.
On lower side market may hit the target of 1.83300.
On higher side 1.85750 may act as a important resistance level for the market.
Trade Idea: Sell GBPCAD (Short-Term Exhaustion Setup)### **📉 Trade Idea: Sell GBPCAD (Short-Term Exhaustion Setup)**
**Bias:** 🔻 Short-Term Bearish | 🧭 Medium-Term Neutral
**Goal:** Catch the dip before trend resumes or price flattens
---
### **💡 Why Sell?**
**🇬🇧 GBP:**
* Sluggish data 😴
* BoE expected to cut 🔻
* Traders losing interest in the pound
**🇨🇦 CAD:**
* Oil holding strong = CAD backed 🛢️
* Inflation still sticky = no rush to ease 🧨
* CAD showing quiet strength vs peers
---
### **📊 Technical Feel (Not Exact):**
* **Momentum looks tired:** Price has pushed up a few times but keeps slowing down 🐌
* **Structure stretched:** Feels like it's gone too far too fast — a breather makes sense 🧘
* **Buyers losing steam:** Recent pushes feel weaker — candles getting smaller, follow-through fading 🔍
* **Volume thinning:** Less excitement at these highs — fewer traders chasing 🚶♂️
* **Indicators turning soft:** Momentum tools like RSI/MACD feel heavy — not reversing, just sagging 🧯
* **Drift from moving averages:** Price looks disconnected from its base — likely to snap back 👣
---
### **⚠️ Invalidation:**
> If the move gathers fresh energy and breaks recent highs with speed — bulls still in charge ⚡
---
### **🎯 Summary:**
GBP feels overextended, CAD quietly strong.
Charts aren’t screaming sell — but whispering “this move’s tired.”
Short-term dip likely before the next decision point.
---
Let me know if you'd like a one-liner caption or want this fitted into a trading journal style!
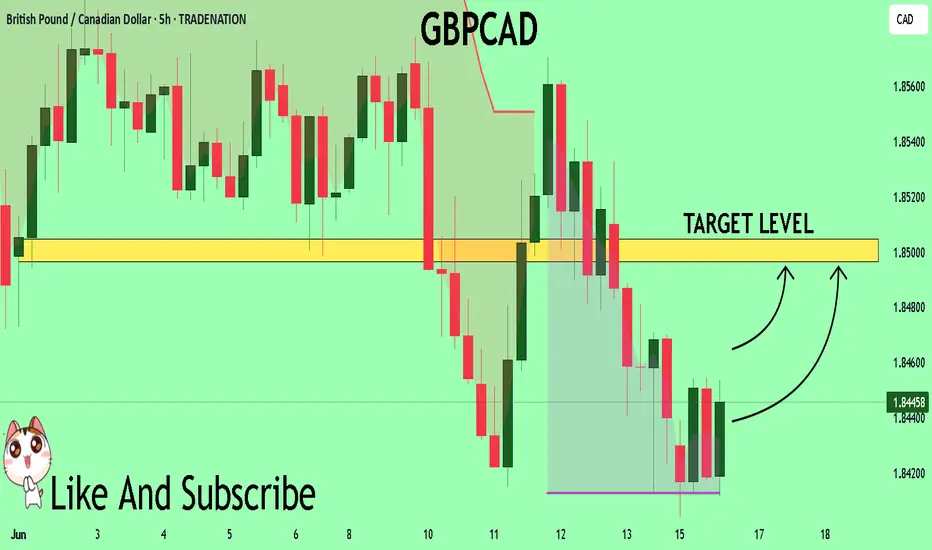
GBPCAD: Expecting Bearish Movement! Here is Why:
Balance of buyers and sellers on the GBPCAD pair, that is best felt when all the timeframes are analyzed properly is shifting in favor of the sellers, therefore is it only natural that we go short on the pair.
Disclosure: I am part of Trade Nation's Influencer program and receive a monthly fee for using their TradingView charts in my analysis.
❤️ Please, support our work with like & comment! ❤️

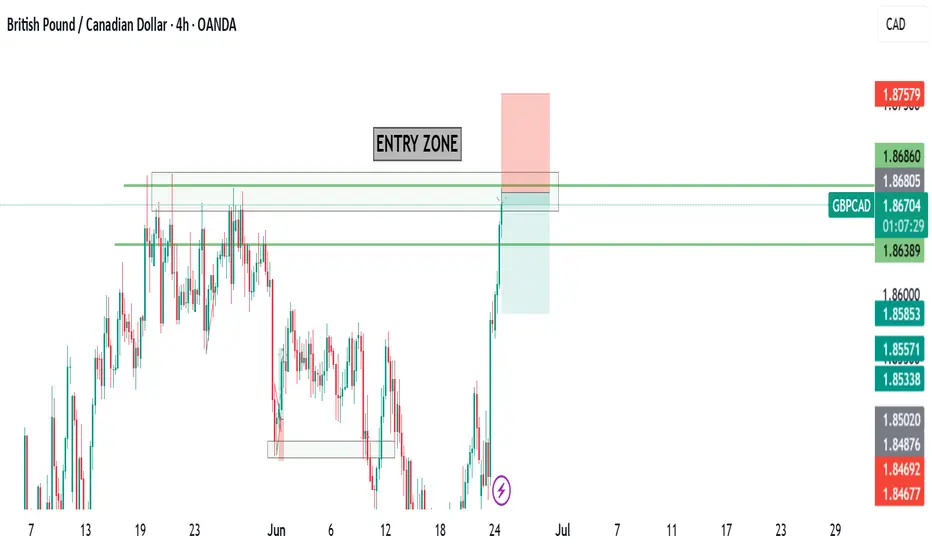
GBPCAD PREDICTIONprice has returned to key weekly/daily area and has shifterd in the 4HTF indicating a potential move to the upside once the market has returned to the NF then and shift in 30min then bullish rally continues to the weekly/daily level
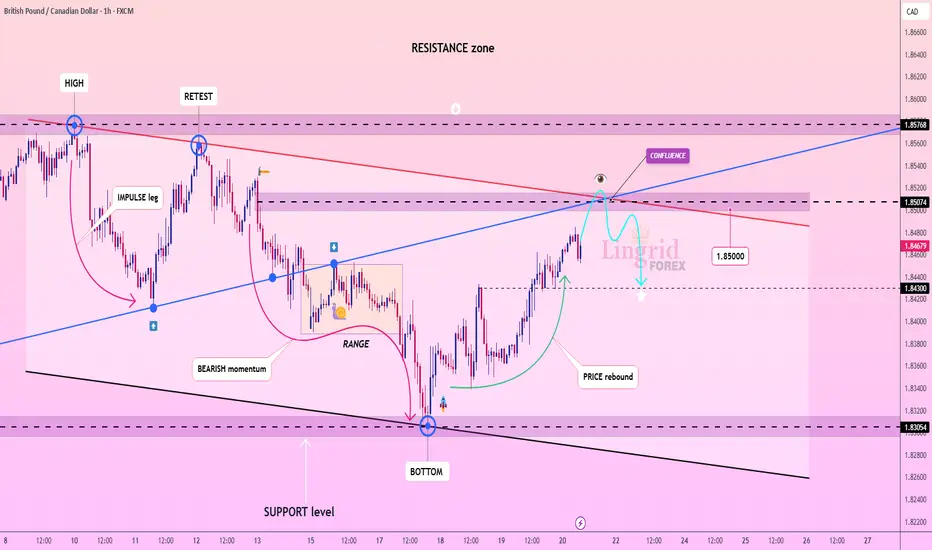
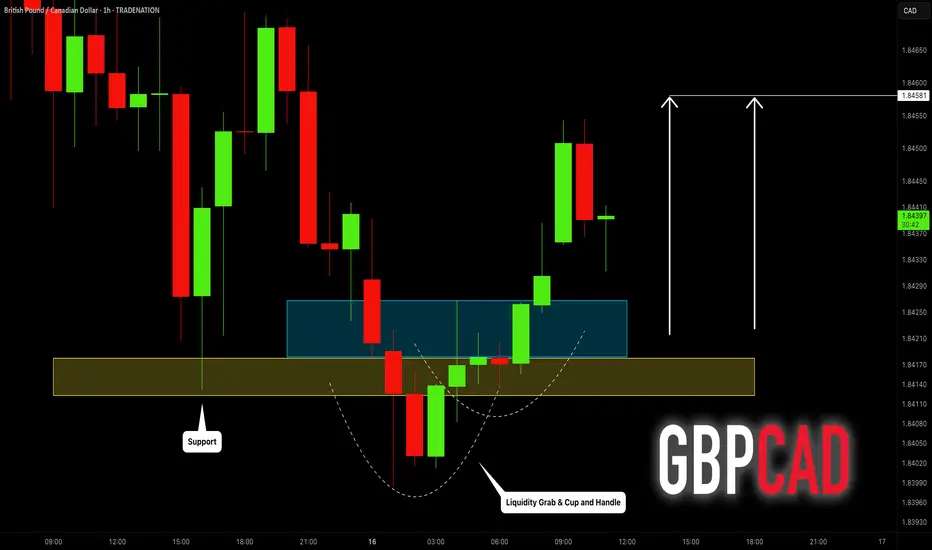
Lingrid | GBPCAD Bearish Opportunity at Confluence ZoneFX:GBPCAD is rebounding from the bottom of its support zone, forming a rounded recovery toward a confluence of resistance levels near 1.8507. Price is nearing the intersection of a downtrend line and a horizontal key level, creating a high-risk rejection zone. A failure to break above this confluence could initiate a bearish swing toward 1.8430 or lower.
📈 Key Levels
Buy zone: 1.8430–1.8460
Sell trigger: bearish rejection at 1.8507
Target: 1.8305
Buy trigger: strong close above 1.8576
💡 Risks
Breaking 1.8507 could lead to extended upside
Economic news or CAD volatility may disrupt pattern
Price may stall in the resistance cluster before choosing direction
Traders, if you liked this idea or if you have your own opinion about it, write in the comments. I will be glad 👩💻
GBPCAD SHORTMarket structure bearish on HTFS DH
entry at Daily AOi
Weekly Rejection at AOi
Daily Rejection at AOi
Daily EMA retest
Previous Structure point Daily
Around Psychological Level 1.85000
H4 EMA retest
H4 Candlestick rejection
Rejection from Previous structure
Levels 3.77
Entry 95%
REMEMBER : Trading is a Game Of Probability
: Manage Your Risk
: Be Patient
: Every Moment Is Unique
: Rinse, Wash, Repeat!
: Christ is King.
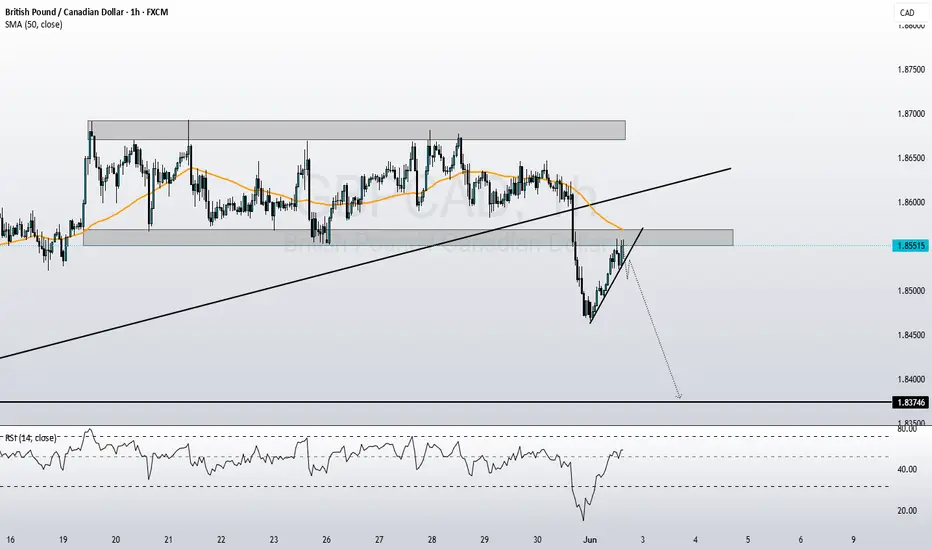
GBPCAD SHORTPrice broke the structure with impulse movement, IF the price breaks the correction then i expect to moving further to the downside.
POSSIBLE SELL OPPORTUNITY ON GBPCADPrice is trending downwards and there is still room to fall. Here we see the nearest level of supply for us to take a sell as it continues to fall.
GBP_CAD RISKY LONG|
✅GBP_CAD is set to retest a
Strong support level below at 1.8380
After trading in a local downtrend for some time
Which makes a bullish rebound a likely scenario
With the target being a local resistance above at 1.8426
LONG🚀
✅Like and subscribe to never miss a new idea!✅
Disclosure: I am part of Trade Nation's Influencer program and receive a monthly fee for using their TradingView charts in my analysis.

GBPCAD shortGBPCAD is now net short on the regression break.
I am considering my EA options on this pair.

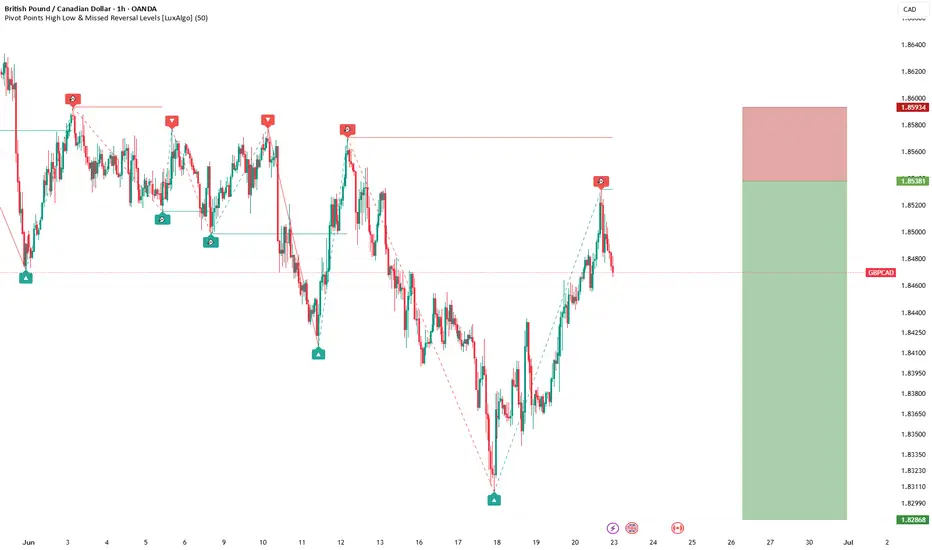
GBPCAD Technical Analysis! BUY!
My dear friends,
GBPCAD looks like it will make a good move, and here are the details:
The market is trading on 1.8449 pivot level.
Bias - Bullish
Technical Indicators: Supper Trend generates a clear long signal while Pivot Point HL is currently determining the overall Bullish trend of the market.
Goal - 1.8496
About Used Indicators:
Pivot points are a great way to identify areas of support and resistance, but they work best when combined with other kinds of technical analysis
Disclosure: I am part of Trade Nation's Influencer program and receive a monthly fee for using their TradingView charts in my analysis.
———————————
WISH YOU ALL LUCK

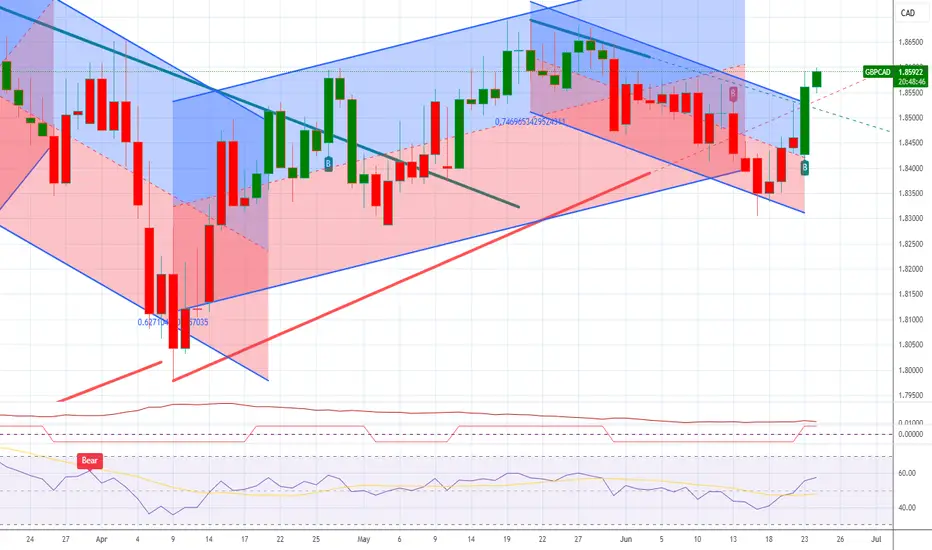
GBP/CAD Made A New Wave , Golden Place To Sell Very Clear !Here is my opinion on GBP/CAD 2H Chart . we have finally a good wave and the price made a new down trendline and moving very good , now i put my fibo indicator and i`m waiting the price to retest a broken support and also 71% fib level and give me any bearish price action and then we can enter a sell trade to create new lower low .

GBPCAD sellopened under previous consolidation and value area
lower prices are accepted
swiped out asia session on H1
GBPCAD: Pullback After a Trap 🇬🇧🇨🇦
There is a high chance that GBPCAD will pull back
from the underlined support.
The price started to grow after a false violation of that and a confirmed bearish trap.
Goal - 1.8458
❤️Please, support my work with like, thank you!❤️
I am part of Trade Nation's Influencer program and receive a monthly fee for using their TradingView charts in my analysis.
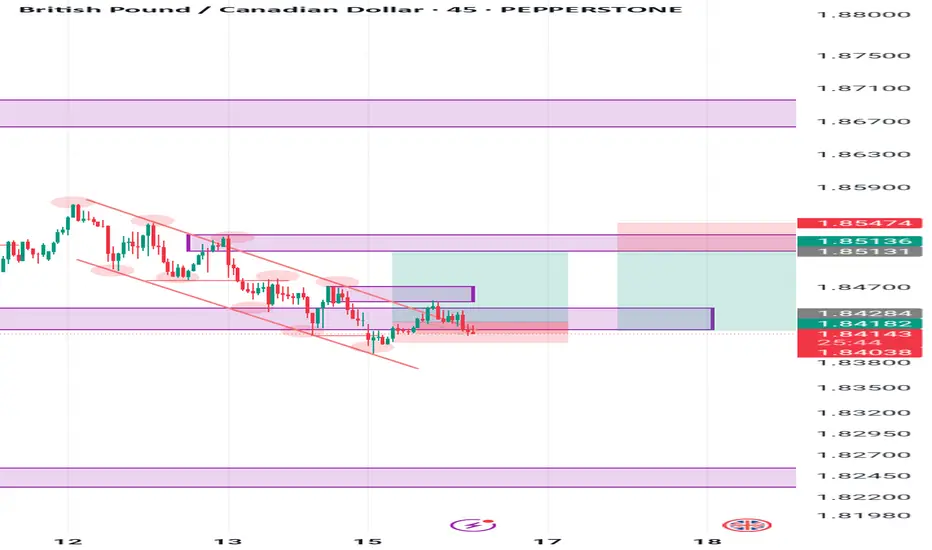
GBPCAD SELL TRADE PLAN🔥 GBP/CAD CONDITIONAL SELL PLAN 🔥
📅 Date: June 16, 2025
📋 TRADE PLAN OVERVIEW
Item Value
Type Swing
Direction 📉 Sell
Confidence ⭐⭐⭐⭐ 88%
R:R 3.8:1
Status ⚠️ Conditional – Awaiting Entry Tap & Confirmation
🧠 Guidance: Primary swing setup. Risk 1.00% max. If tapped, only enter with confirmation (engulfing / iBOS / volume spike).
📈 MARKET BIAS & TRADE TYPE
Section Details
Bias Bearish 📉
Type Breaker Block Reversal / CHoCH Swing Sell
🔰 CONFIDENCE LEVEL
Total: 88% (⭐⭐⭐⭐)
Confluence Element Weight
D1 CHoCH + Liquidity Below 25%
H4 Supply + FVG Zone 20%
H1 Weakness + Internal BOS 18%
Session Trap Potential 10%
No Macro Conflict (CAD strength) 15%
📍 ENTRY ZONES
Type Range Description
🟥 Primary Sell 1.8500–1.8530 H4 OB + FVG + Session Trap
🟧 Secondary Sell 1.8560–1.8585 Liquidity Inducement Zone (High RR)
❗ STOP LOSS
SL: 1.8588 (Above OB wick + 1H ATR)
Dynamic ATR Logic Applied (Normal VIX → 1x H1 ATR)
🎯 TAKE PROFITS
TP Level Target Details
TP1 1.8420 Internal liquidity zone
TP2 1.8320 Breaker flip + H4 OB break
TP3 1.8210 Full liquidity cleanout
📏 RISK:REWARD
TP1: 2.3:1
TP2: 3.8:1 ✅
TP3: 5.6:1 🚀
🧠 MANAGEMENT STRATEGY
🔹 Risk: 1% of account (swing)
🔹 TP1: 50% off + BE (+10pips)
🔹 TP2: 30% off
🔹 TP3: Trail final 20%
🔹 Adjust SL if macro shift only (BOC, CPI)
⚠️ CONFIRMATION CRITERIA
✅ Only Enter If:
H1/H4 Bearish Engulfing or OB Flip
Volume Spike or Sweep @ 1.8500
iBOS or SMT Divergence
🛑 No confirmation = no entry.
⏳ VALIDITY WINDOW
Valid until: June 18, 2025 – 22:00 UTC
Auto-expire if zone untapped or invalidation
❌ INVALIDATION
❌ H4 BOS above 1.8600
❌ CAD macro sentiment flips
❌ No rejection / liquidity sweep at OB
🌐 FUNDAMENTAL SNAPSHOT
Element Value
Retail Sentiment GBP Longs → High %
DXY Neutral
CAD Strength Rising oil → CAD support
COT (GBP) Bearish bias continuing
Sentiment Score ✅ +7/10
📋 FINAL TRADE SUMMARY
We are targeting a retest of bearish supply at 1.8500–1.8530
If price rejects w/ confirmation, sell toward liquidity below 1.8300
Avoid early entry — structure + timing + volume needed
Blueprint-compliant swing play, clean OB, and FVG overlap
🧠 Tactical Summary:
"Wait for price to enter 1.8500–1.8530 and trigger confirmation. Do not preempt. This is a sniper reversal off OB + liquidity sweep."
Patience = Power.