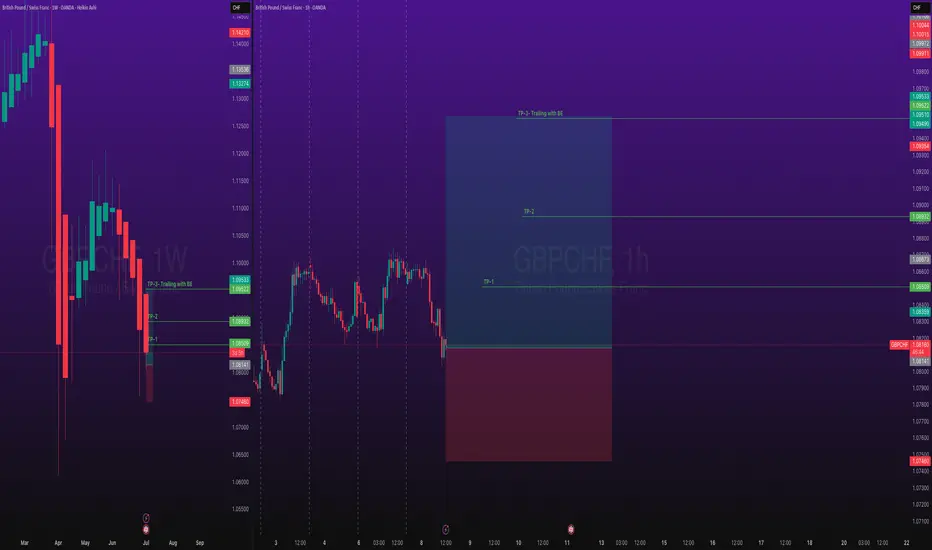
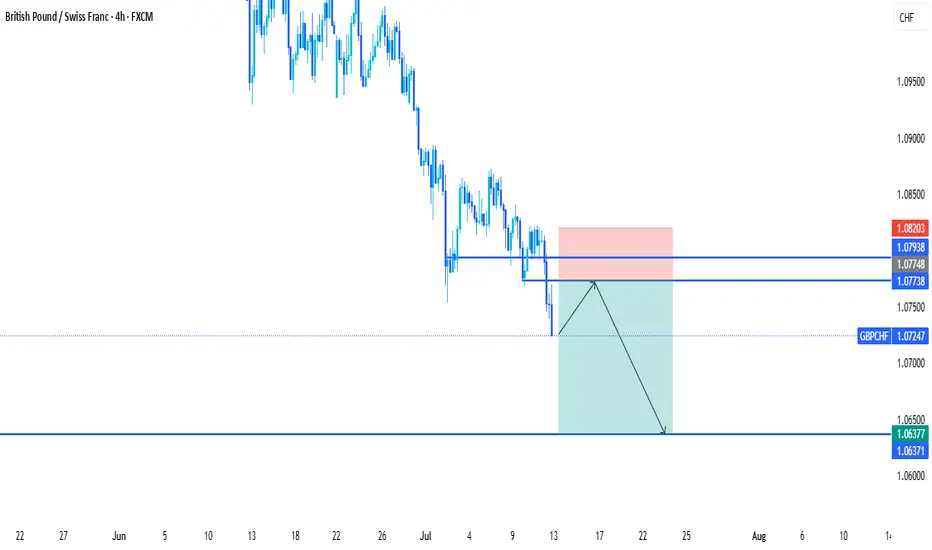
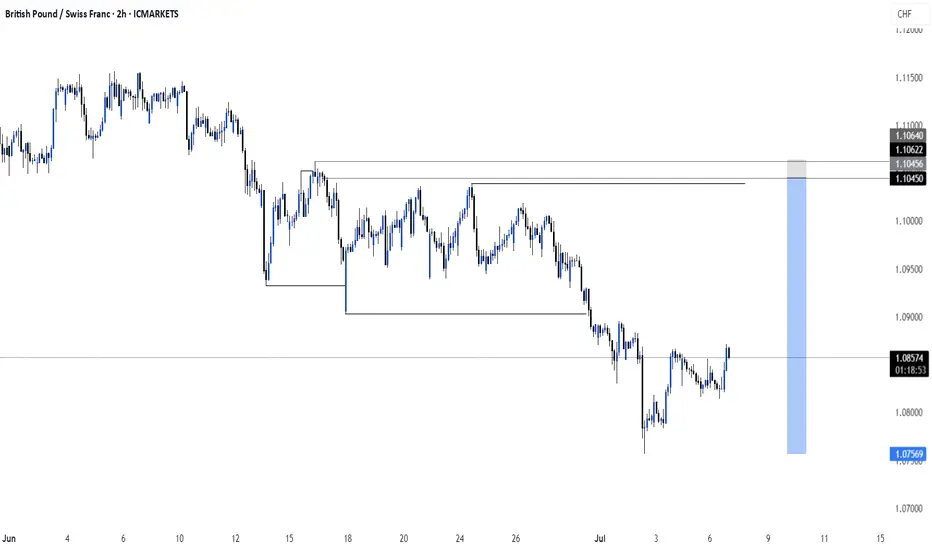
GBPCHF - Continuation Setup towards 1.0770GBPCHF recently descended with strength, and I’ve been watching to see how price reacts here.
Price now hovers above and this is a great indication for us to use for possible continuation move, that could send price into the 1.0770 level.
But if price breaks above with momentum, then I’ll back off the bearish bias and reassess, and I’d consider the continuation idea invalidated, with potential for further upside.
Just sharing my thoughts for the charts, this isn’t financial advice. Always confirm your setups and manage your risk properly.
Disclosure: I am part of Trade Nation's Influencer program and receive a monthly fee for using their TradingView charts in my analysis.
GBPCHF trade ideas

X1: GBPCHF Long Trade Risking 1% to make 1.35%OANDA:GBPCHF Long trade, with my back testing of this strategy, it hits multiple possible take profits, manage your position accordingly.
Risking 1% to make 1.35%
This is good trade, don't overload your risk like greedy, be disciplined trader, this is good trade.
Use proper risk management
Looks like good trade.
Lets monitor.
Use proper risk management.
Disclaimer: only idea, not advice
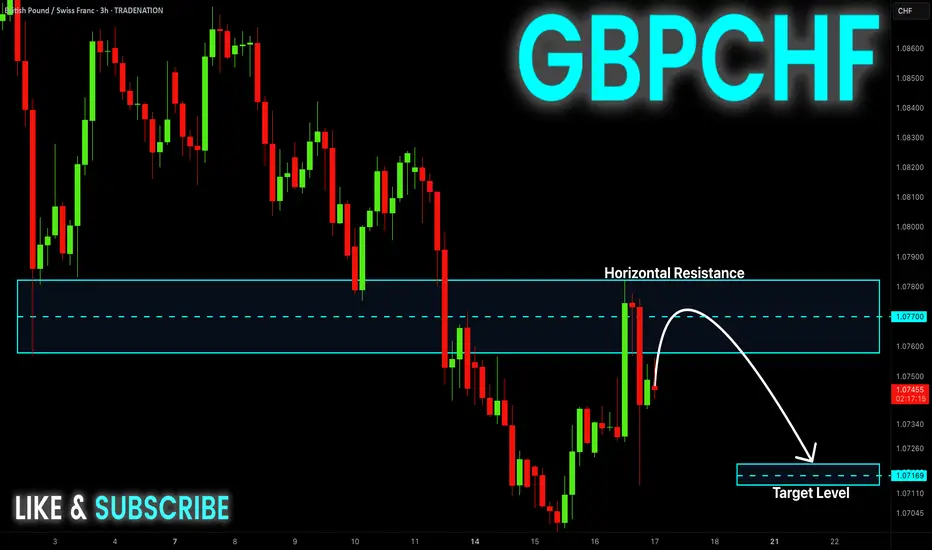
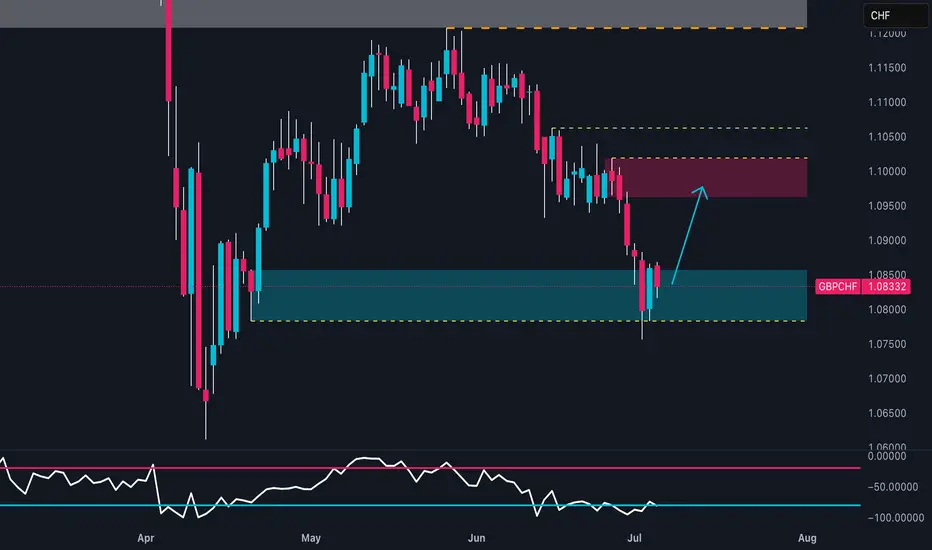
GBP-CHF Local Short! Sell!
Hello,Traders!
GBP-CHF made a retest of
The wide horizontal resistance
Of 1.0780 and we are already
Seeing a bearish pullback
So as the pair is trading in a
Downtrend we will be expecting
A further bearish move down
Sell!
Comment and subscribe to help us grow!
Check out other forecasts below too!
Disclosure: I am part of Trade Nation's Influencer program and receive a monthly fee for using their TradingView charts in my analysis.
GBPCHF Technical Analysis! BUY!
My dear followers,
I analysed this chart on GBPCHF and concluded the following:
The market is trading on 1.0733 pivot level.
Bias - Bullish
Technical Indicators: Both Super Trend & Pivot HL indicate a highly probable Bullish continuation.
Target - 1.0775
About Used Indicators:
A super-trend indicator is plotted on either above or below the closing price to signal a buy or sell. The indicator changes color, based on whether or not you should be buying. If the super-trend indicator moves below the closing price, the indicator turns green, and it signals an entry point or points to buy.
Disclosure: I am part of Trade Nation's Influencer program and receive a monthly fee for using their TradingView charts in my analysis.
———————————
WISH YOU ALL LUCK
GBPCHF TRADE SETUPWait for retest the entry level then take a trade for sell otherwise skip this setup
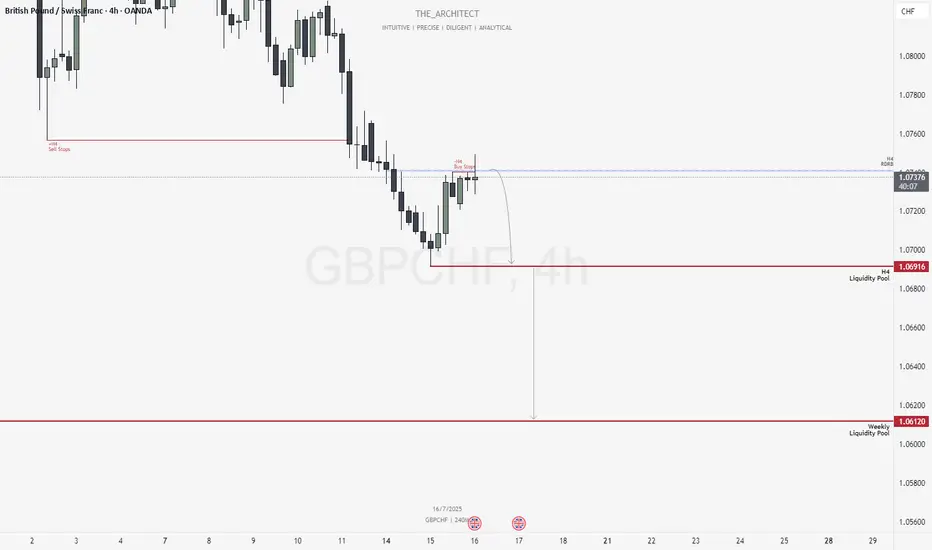
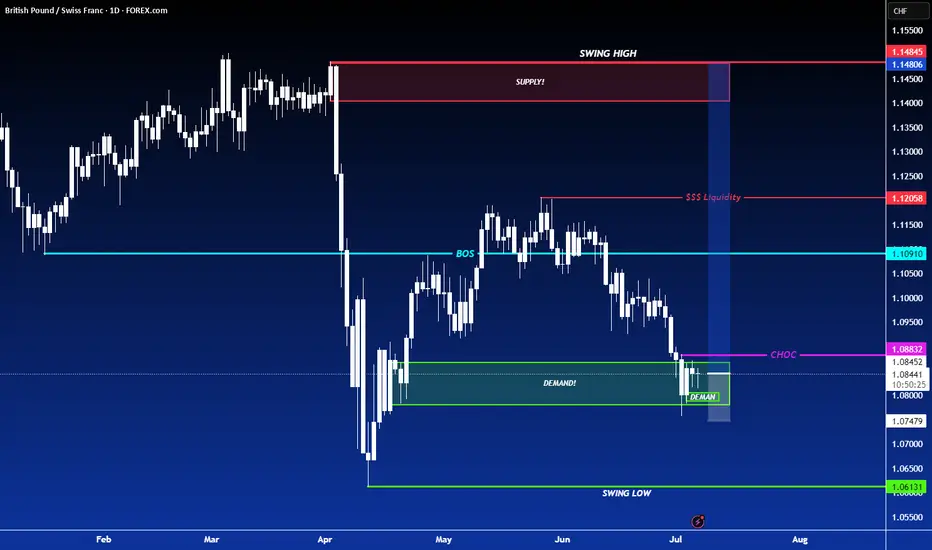
GBPCHF: Bearish Structure Aligns for Potential Sell Setups!Greetings Traders,
In today’s analysis of GBPCHF, we observe that the institutional order flow is currently bearish, and as such, we aim to align with this bias by identifying selling opportunities from key institutional resistance zones.
Higher Timeframe Context:
Weekly TF:
The weekly timeframe, which serves as our macro bias, is firmly bearish. This sentiment is reinforced on the H4 timeframe—our intermediate structure—which is also delivering consistent lower highs and lower lows. The alignment between these two timeframes strengthens our conviction to trade in the direction of institutional bearish order flow.
Key Observations on H4:
Re-delivered & Re-balanced Price Zone: Price has retraced into a previously balanced area that has now been re-delivered into, signaling institutional interest. Rejection from this zone adds to our bearish bias.
Buy Stop Raid: Price action has swept H4 buy stops in this area, providing confirmation that smart money may have used this liquidity for order pairing into short positions.
Entry Zone: The current rejection suggests a high-probability shorting opportunity from this region, provided confirmation on the lower timeframes.
Trading Plan:
Entry Strategy: Await confirmation at the current H4 resistance for short entries.
Targets: First target is the H4 liquidity pool located at discount prices. The longer-term objective is the weekly liquidity pool, which represents the primary draw on liquidity.
Continue to monitor price action closely, maintain patience for confirmation, and manage risk according to your trading plan.
Kind Regards,
The Architect 🏛️📉
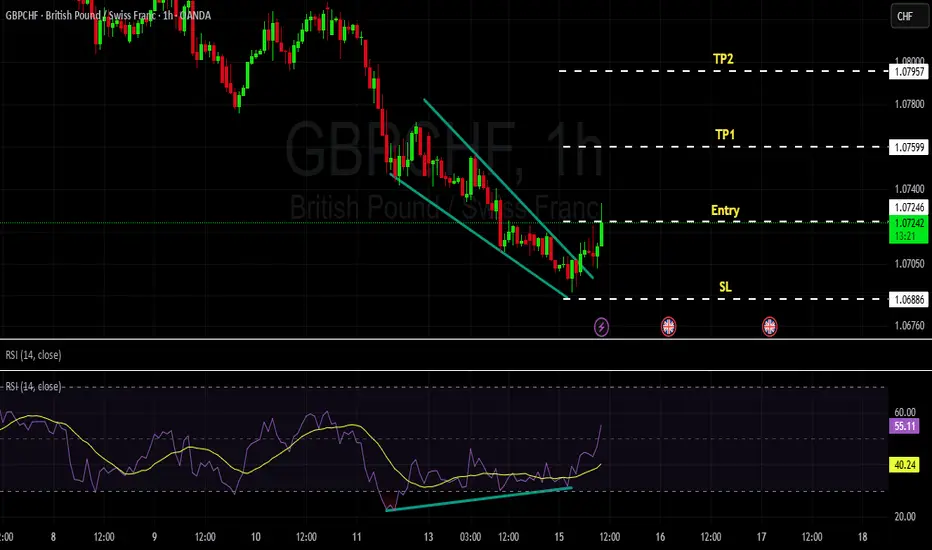
GBPCHF - Bullish BUY Market has formed a strong divergence in the bearish trend on 1H time frame- market has also formed as wedge patter which is a good sign of reversal.
market has currently broken the last LH.
we take instant entry and place SL as defined on the charts with R:R of 1:1 and 1:2 we put our TPs.
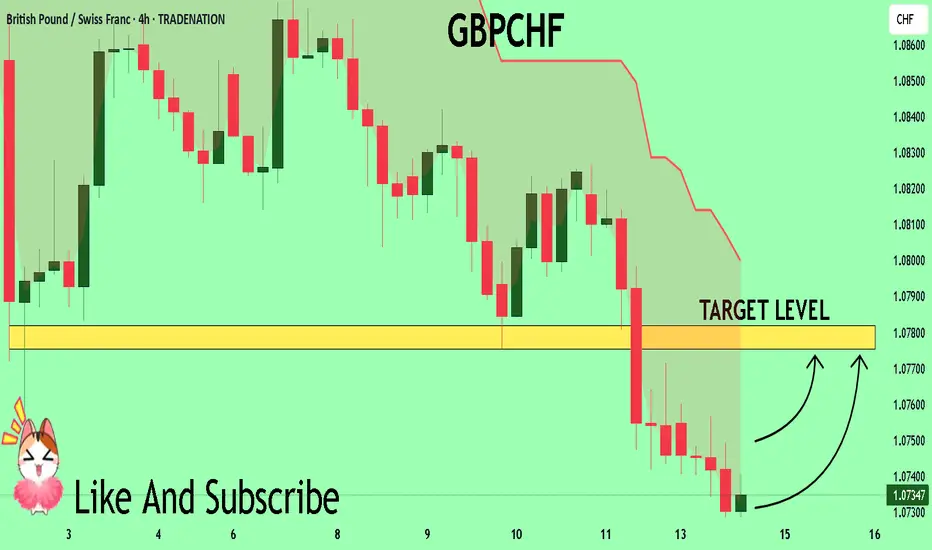
GBP-CHF Bearish Breakout! Sell!
Hello,Traders!
GBP-CHF is trading in a strong
Downtrend and the pair
Broke the key horizontal
Level around 1.0780 which
Reinforces our bearish
Bias and we will be
Expecting a further
Bearish move down
On Monday!
Sell!
Comment and subscribe to help us grow!
Check out other forecasts below too!
Disclosure: I am part of Trade Nation's Influencer program and receive a monthly fee for using their TradingView charts in my analysis.

Inverse cup pattern in GBPCHFI think I had late drawn on this pattern lolz
Price is now at the last stage of the falling rectangle, please sell at whatever high forming according to own analysis/setups, project at the very beginning of the move.
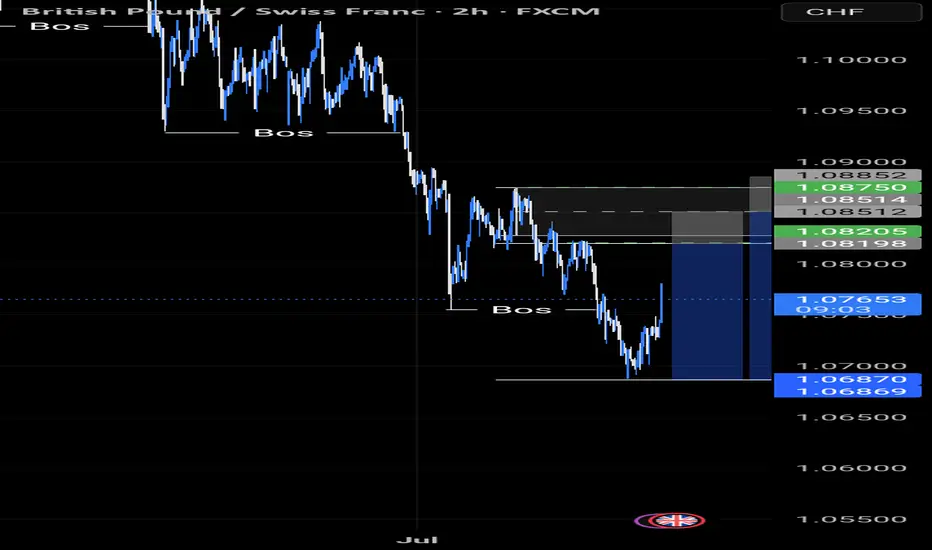
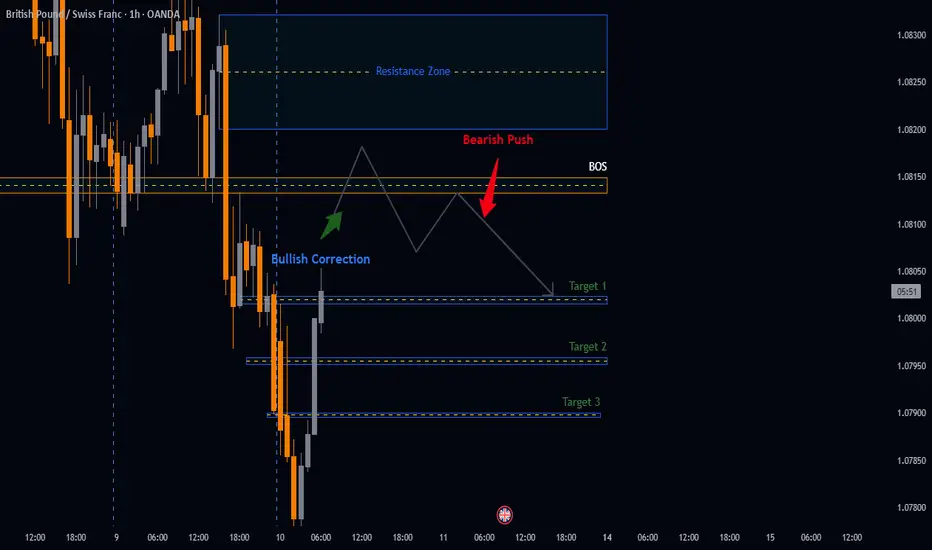
GBPCHF Potential Bearish SetupDistribution pattern with breakdown below key support suggests downside momentum.
Break above our Resistance zone will invalidate our trade setup; good idea to watch out if that happens.
- Breakdown Level: 1.08149 -1.08133
- Entry Strategy: Sell orders at BOS
- Stop Loss: Above Resistance zone
- Target Zones:
- Primary Target: Target 1 (R:R 1:2)
- Secondary Target: Target 2 (R:R 1:3)
- Extension Target: Target 3 (R:R 1:4)
Bearish/Bullish Confirmations:
🔻 Rejection candlestick patterns
🔻 Bearish Reversal patterns
🔻 Impulsive moves in line with setups directional bias
Position Management:
- Exit: Partial profits at targets
- Stop adjustment: Trail stops when target are hit
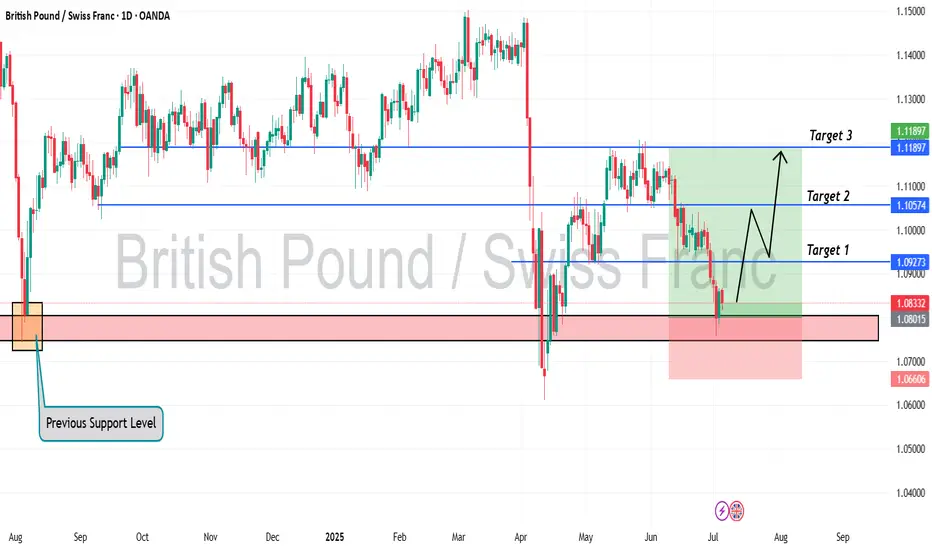
GBCHF Will Fly from a Old support LevelHello Traders
In This Chart GBPCHF HOURLY Forex Forecast By FOREX PLANET
today GBPCHF analysis 👆
🟢This Chart includes_ (GBPCHF market update)
🟢What is The Next Opportunity on GBPCHF Market
🟢how to Enter to the Valid Entry With Assurance Profit
This CHART is For Trader's that Want to Improve Their Technical Analysis Skills and Their Trading By Understanding How To Analyze The Market Using Multiple Timeframes and Understanding The Bigger Picture on the Charts
GBPCHF SHORTThe price formed a Head and shoulders reversal pattern. If occur clear breakout then i expect it to move lower.
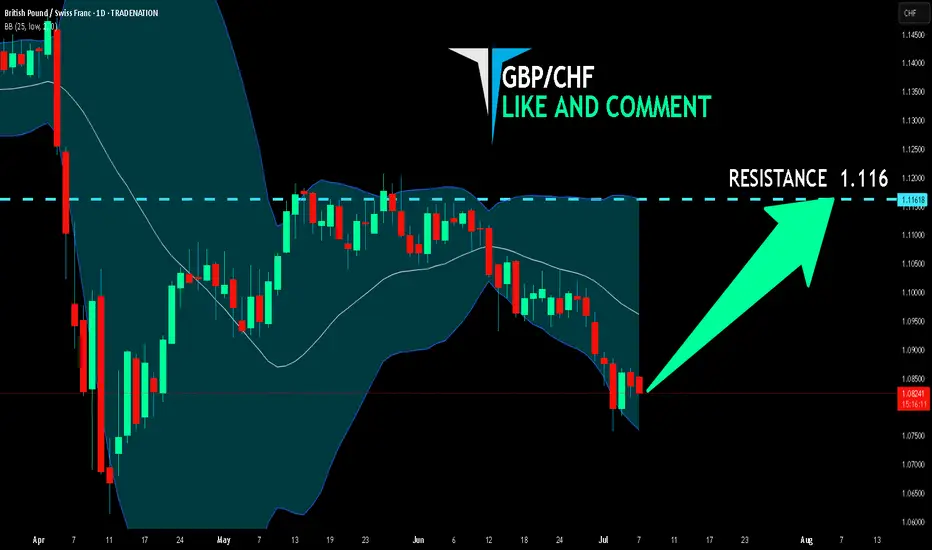
GBP/CHF LONG FROM SUPPORT
Hello, Friends!
GBP/CHF pair is in the downtrend because previous week’s candle is red, while the price is obviously falling on the 1D timeframe. And after the retest of the support line below I believe we will see a move up towards the target above at 1.116 because the pair oversold due to its proximity to the lower BB band and a bullish correction is likely.
Disclosure: I am part of Trade Nation's Influencer program and receive a monthly fee for using their TradingView charts in my analysis.
✅LIKE AND COMMENT MY IDEAS✅
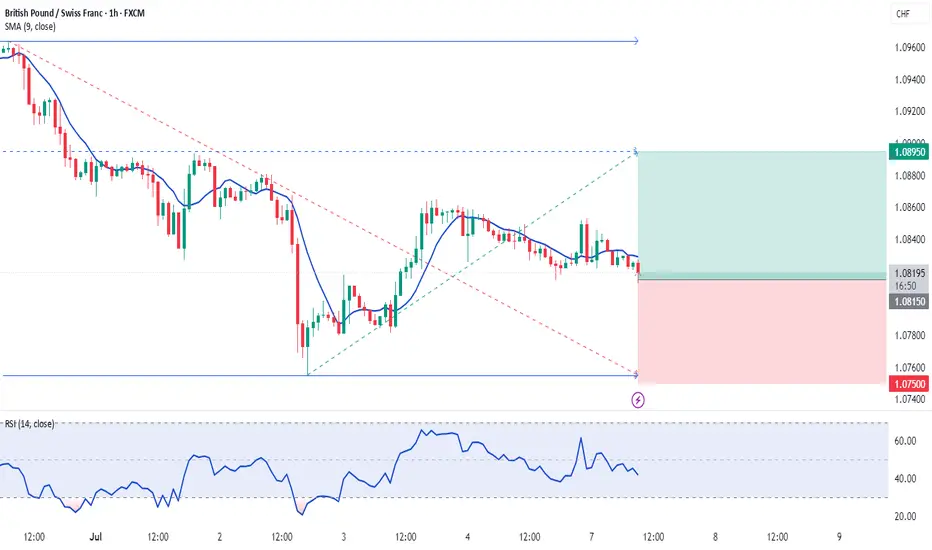
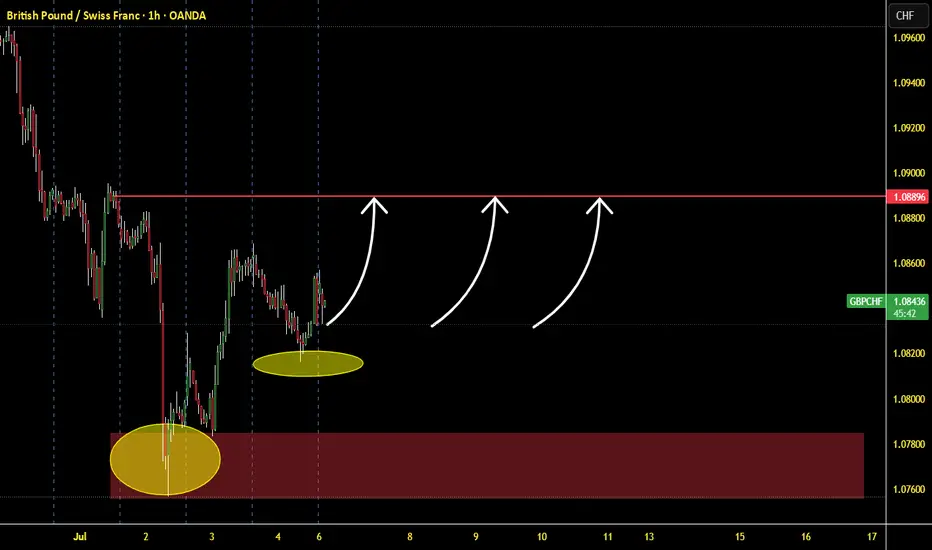
07.07.2025 #GBPCHFBUY 1.08150 | STOP 1.07500 | TAKE 1.08950 | Initial upward movement around a strong range of local support.
LONG ON GBP/CHFGBP/CHF has tapped into a major demand zone and has lots of buy side liquidity to the upside near the supply zone to collect.
I will be buying GBP/CHF to the supply zone looking to catch 400-600 pips.
GBPCHF SELLBy utilizing levels, historical patterns, , we can formulate a hypothesis that the market might follow a similar trajectory if bearish sentiment prevails.
GBP/CHF Headed to 1.10 – But Bulls Might Regret It📉 1. Price Action & Technical Structure (D1)
Key demand zone tested with bullish reaction:
Price reacted strongly around the 1.0790–1.0840 structural demand area, previously the origin of a significant bullish impulse. The latest daily candle closed above the previous swing low, suggesting a potential technical rebound.
Immediate target:
The 1.0980–1.1010 zone, aligning with:
A clear supply area
RSI bouncing from oversold territory
A visible imbalance left unfilled
Technical bias: Short-term LONG to fill the imbalance before a potential institutional-driven short setup at supply.
2. Retail Sentiment
86% of traders are LONG, with an average entry of 1.0997
Only 14% are SHORT, with lower volume and better pricing
Current price: 1.0833, meaning most long traders are in drawdown
Contrarian view:
The heavy long positioning creates a liquidity pool between 1.0990–1.1010, making that zone highly attractive for institutional distribution and liquidation of retail longs, especially if accompanied by a structural shift.
🎯 Operational impact:
Supports a technical long to 1.10, but high risk of reversal once that level is reached.
3. COT Report
GBP (British Pound – CME)
Non-commercials:
Long: -6,434 → massive unwind of bullish exposure
Short: +2,028 → rising bearish bets
Net positioning is increasingly bearish
Commercials:
Long: +7,459 → increasing coverage against GBP weakness
Short: -569 → slight reduction
Positioning is mixed, but commercials are taking defensive long positions
GBP interpretation:
Bearish pressure rising from institutional speculators, despite some commercial support.
CHF (Swiss Franc – CME)
Non-commercials:
Long: +327
Short: +1,215
Net positioning still heavily short, but shorts increasing again
Commercials:
Long: +1,909
Short: +307
Commercials are accumulating long CHF positions (bullish sign)
CHF interpretation:
Divergence between commercials (bullish CHF) and speculators (still short) → shift may be underway.
4. July Seasonality
GBP:
Historically strong in July, especially the last 2 years (+3.5%)
Positive tendency across 10y/15y/20y averages
CHF:
Also seasonally positive in July, but underperforms GBP across most timeframes (except 2Y where CHF is also strong)
Operational impact:
Favors short-term bullish GBP/CHF bias, supported by seasonal momentum.
✅ Final Outlook
Current short-term bias is bullish, driven by:
Clear technical rebound
Visible imbalance toward 1.10
Seasonal divergence in favor of GBP
However, excessive retail long positioning + COT speculative pressure on GBP suggest this rally could be a distribution phase, offering an optimal short opportunity at 1.10.
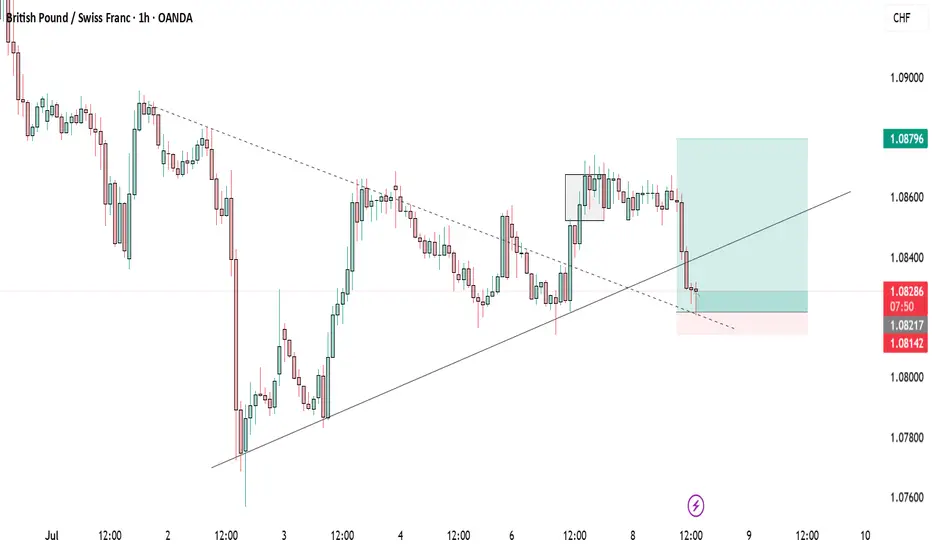
GBP/CHF Long Setup📈 GBP/CHF Long Setup
🕒 1H Timeframe
📍Entry: 1.0800
🎯 Target: 1.0889
I'm currently long GBPCHF after seeing a strong bounce from a key demand zone. Price has printed a higher low and is showing bullish structure on the 1H. Targeting a break above local resistance toward 1.0889.
🔍 Multiple rejections from demand + bullish momentum = high probability setup.
📊 Let’s see if price can push through those liquidity levels.
📍 Risk-managed and eyes on PA — updates to follow.
#GBPCHF #Forex #TradeSetup #PriceAction #SmartMoney #MarketStructure #SwingTrade
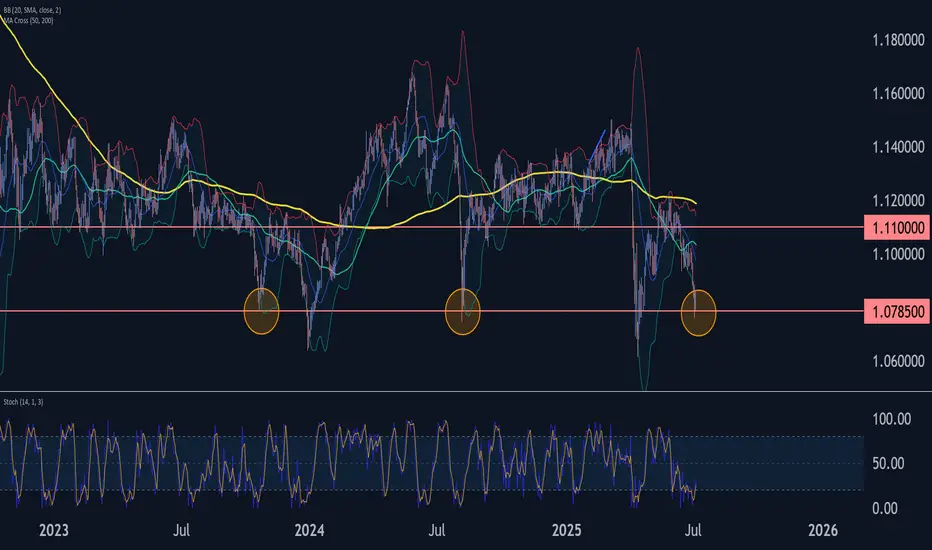
GBPCHF Wave Analysis – 3 July 2025- GBPCHF reversed from strong support level 1.0785
- Likely to rise to resistance level 1.0950
GBPCHF currency pair recently reversed up from the strong support level 1.0785 (which has been steadily reversing the price from last August as can be seen below).
The upward reversal from the support level 1.0785 created the daily Japanese candlesticks reversal pattern Bullish Engulfing.
Given the strength of the support level 1.0785 and the oversold daily Stochastic, GBPCHF currency pair can be expected to rise to the next round resistance level 1.0950.
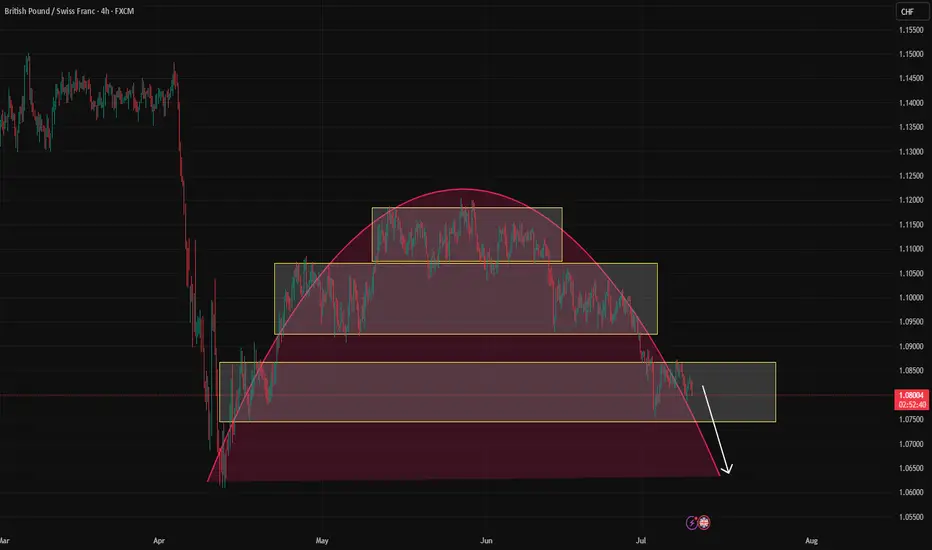
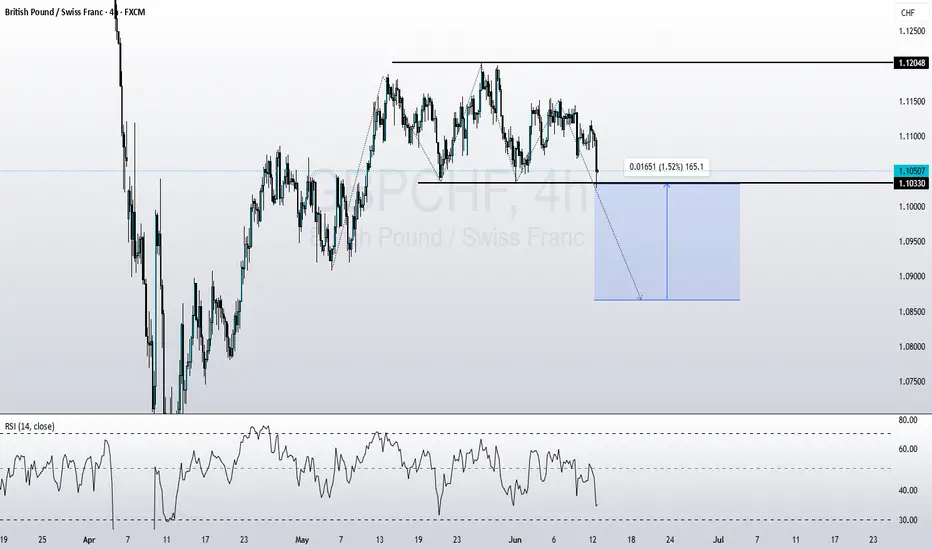
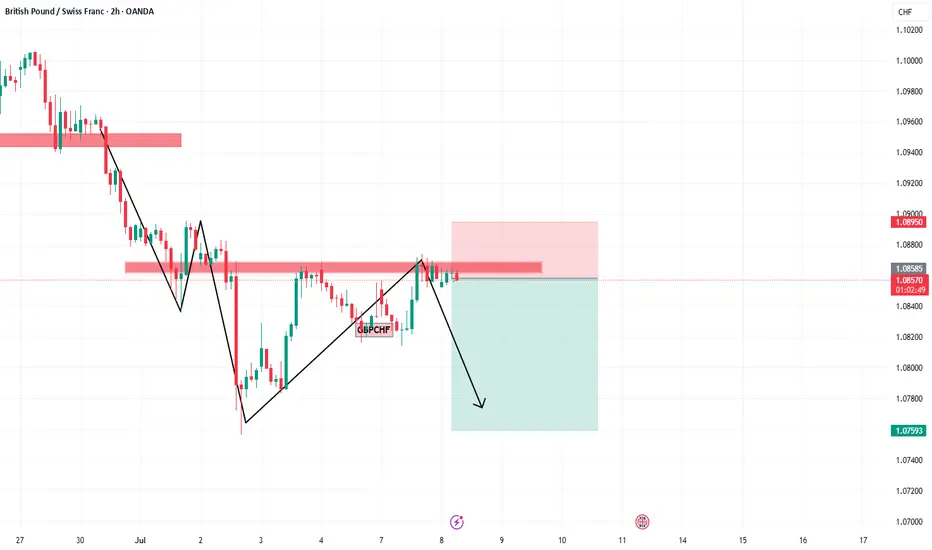
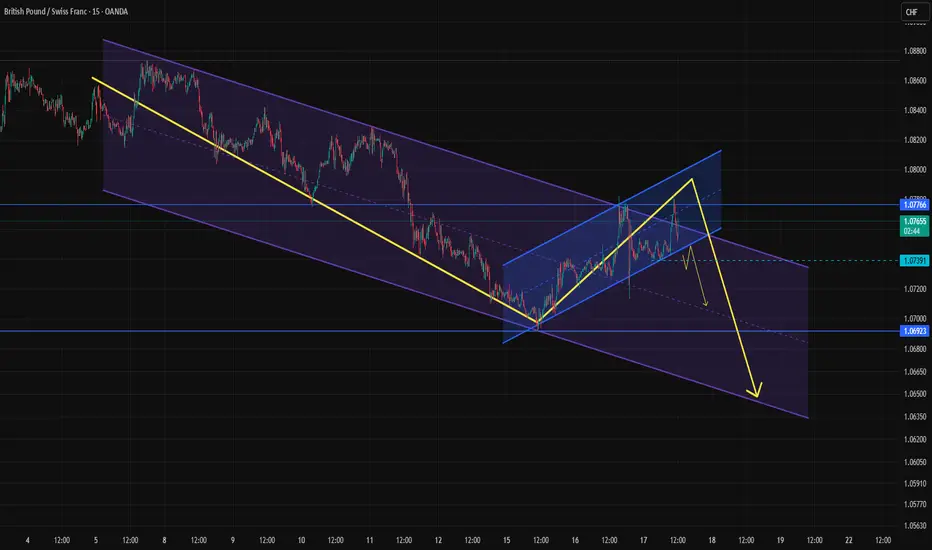
Analysis based on a channel within two cyclesWe have a large descending channel, which appears to be forming a smaller ascending channel as part of a correction.
Once the correction is confirmed and completed, it could provide a good opportunity for a short position.
However, if the lower boundary isn't broken and the price moves higher, we’ll hold off and wait for a new structure to form.
GBPCHF TRADE IDEA We seem to be pulling back on GBPCHF
We anticipate a pullback to our Fibonacci level for a continuation trade to the downside on GBPCHF.
Let's see how the market does it's thing