The Day AheadKey Data Releases:
US:
Q2 GDP – Crucial insight into US economic momentum.
July ADP Employment – A labor market pulse-check ahead of Friday's payrolls.
June Pending Home Sales – Gauges housing market resilience.
Europe:
Germany, France, Italy, Eurozone Q2 GDP – A comprehensive picture of Eurozone growth trajectory.
June Retail Sales (Germany), Consumer Spending (France), Wages and Industrial Sales (Italy) – Offer inflation and demand signals.
Eurozone July Economic Confidence – Reflects business and consumer sentiment.
Australia:
June CPI – May influence RBA policy expectations.
Central Bank Decisions:
Federal Reserve:
Widely anticipated decision following disinflationary signals and resilient growth.
Bank of Canada:
Eyes on dovish shift as domestic momentum cools.
Major Earnings:
Tech Titans: Microsoft, Meta, Qualcomm, ARM – Key drivers of market sentiment, especially AI and cloud-related narratives.
Luxury & Autos: Hermes, Porsche, Mercedes-Benz – Demand indicators from high-end consumers.
Banks & Financials: HSBC, UBS, Intesa Sanpaolo, Robinhood – Update on global credit and trading conditions.
Industrials & Energy: Airbus, Lam Research, Rio Tinto, Vinci, BAE – Supply chain and CapEx insights.
Consumer & Retail: Ford, adidas, Hershey, Kraft Heinz, Etsy, Just Eat – Demand resilience and margin pressures.
US Treasury:
Quarterly Refunding Announcement – Market-sensitive update on bond issuance plans, with implications for yields and risk sentiment.
Conclusion:
This is a pivotal day for markets, combining top-tier macroeconomic data, central bank rate decisions, and heavyweight earnings. The Fed’s stance will likely steer risk appetite, while GDP prints across the US and Europe will refine global growth expectations. Meanwhile, earnings from major tech and consumer names will test the strength of market leadership. Volatility is likely to rise, with traders balancing soft-landing hopes against persistent inflation risks and policy uncertainty.
This communication is for informational purposes only and should not be viewed as any form of recommendation as to a particular course of action or as investment advice. It is not intended as an offer or solicitation for the purchase or sale of any financial instrument or as an official confirmation of any transaction. Opinions, estimates and assumptions expressed herein are made as of the date of this communication and are subject to change without notice. This communication has been prepared based upon information, including market prices, data and other information, believed to be reliable; however, Trade Nation does not warrant its completeness or accuracy. All market prices and market data contained in or attached to this communication are indicative and subject to change without notice.
GBPEUR trade ideas

Sell EURGBP now for a quick scalping Sell EURGBP now for a quick scalping ...... looking for 20 pips plus on profit target here

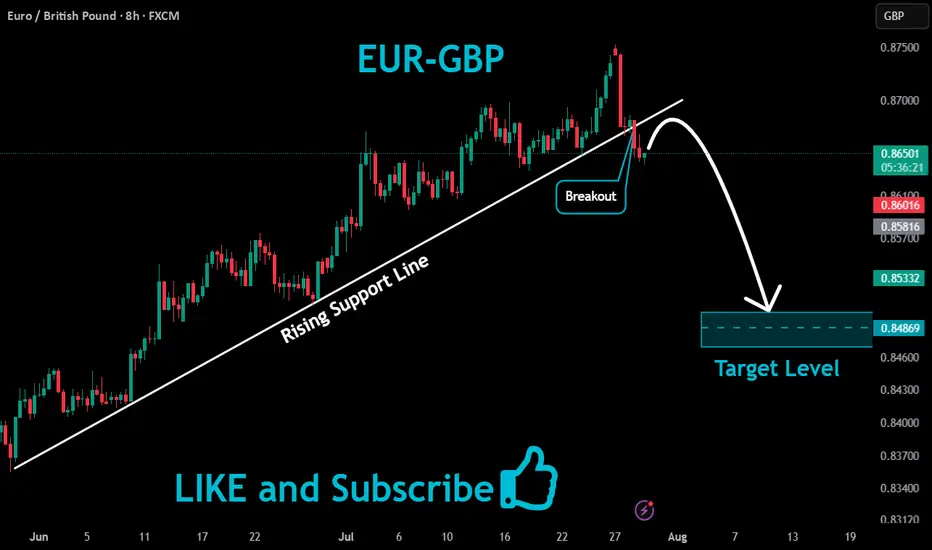
EURGBP Bearish Breakout!
HI,Traders !
#EURGBP broke the rising
Support line and the breakout
Is confirmed so we are
Bearish biased and we
Will be expecting a
Further move down !
Comment and subscribe to help us grow !
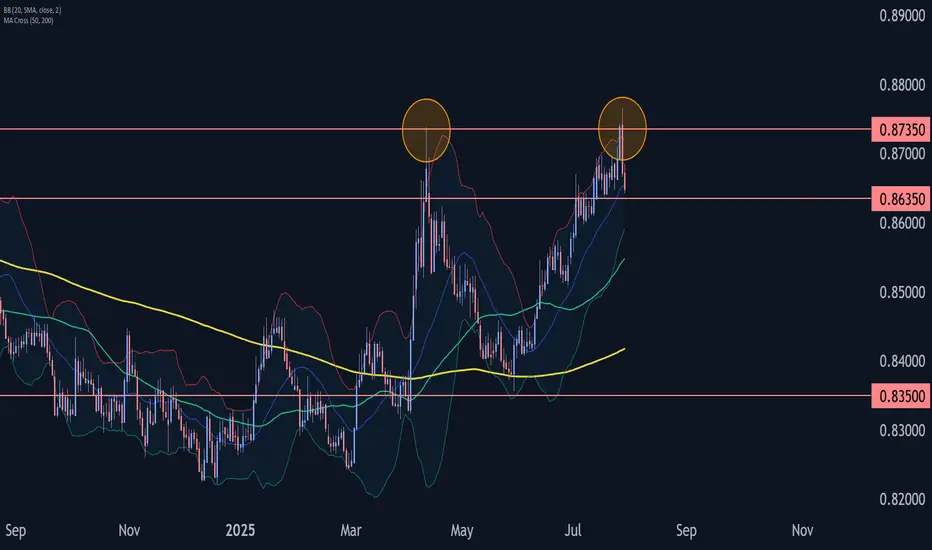
EURGBP Wave Analysis – 29 July 2025- EURGBP reversed from the resistance zone
- Likely fall to support level 0.8635
EURGBP currency pair recently reversed down from the resistance zone between the multi-month resistance level 0.8735 (which stopped sharp wave (A) in April) and the upper daily Bollinger Band.
The downward reversal from this resistance zone created the daily Japanese candlesticks reversal pattern Dark Cloud Cover.
Given the strength of the resistance level 0.8735, EURGBP currency pair can be expected to fall to the next support level 0.8635 (low of the previous minor correction ii).
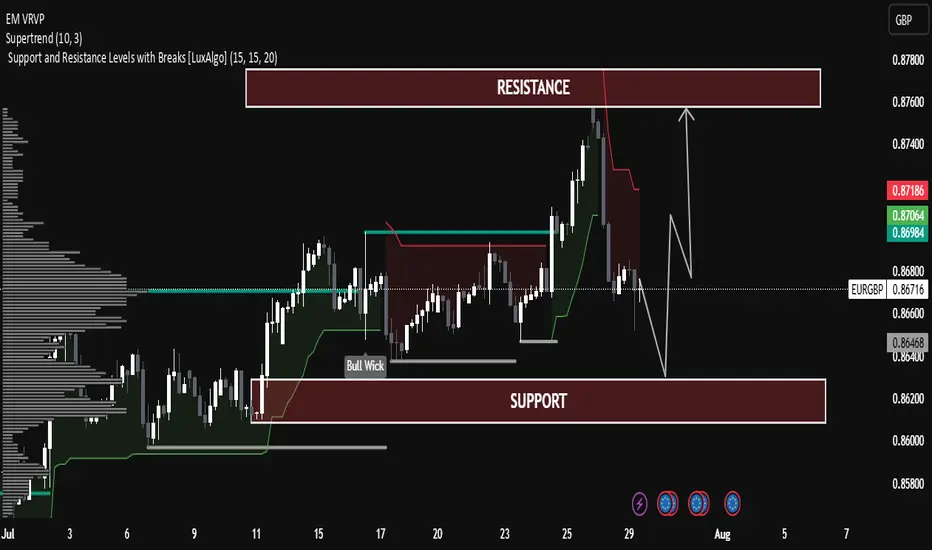
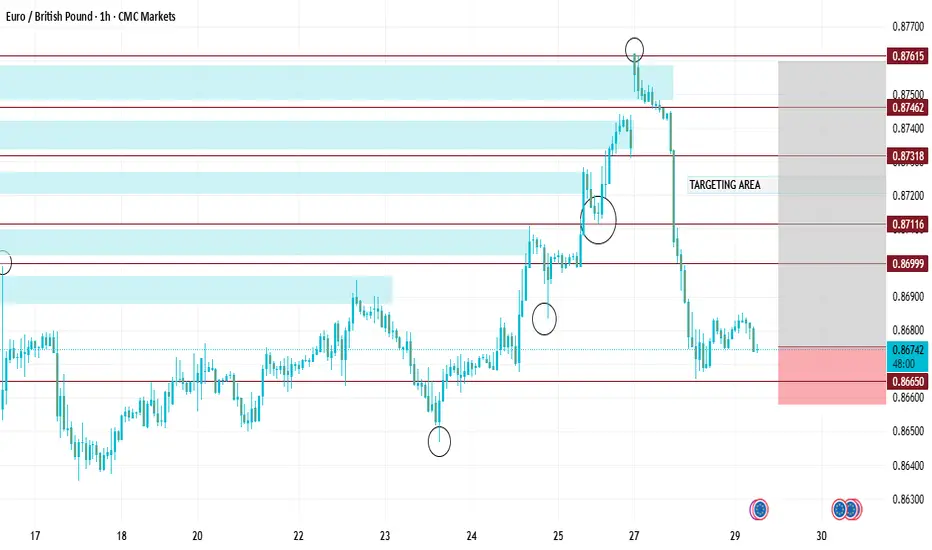
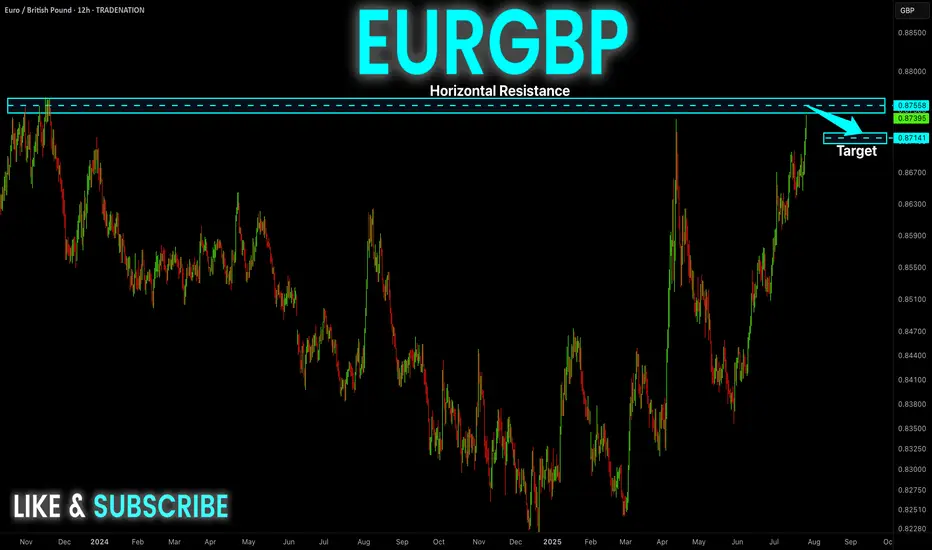
EUR/GBP Technical Analysis – Range-Bound Structure EUR/GBP Technical Analysis – Range-Bound Structure with Potential Rebound
The pair is currently trading within a well-defined horizontal channel between:
Support Zone: 0.86400 – 0.86200
Resistance Zone: 0.87800 – 0.87600
Price is currently near the mid-level (0.86756), showing consolidation after a rejection from resistance.
Supertrend Indicator:
The Supertrend (10,3) is currently bearish (red line above the price), indicating short-term downward pressure.
Price recently broke below the Supertrend line near the highs, suggesting a correction is underway.
Volume Profile (Left Side):
Significant volume has been transacted around the current market range (Point of Control).
This indicates strong interest and fair value, often leading to sideways movement before the next breakout.
Bull Wick Highlight (Mid-July):
Indicates buying pressure from lower levels, acting as historical demand near 0.86400.
🔄 Price Projection & Scenario Planning:
✅ Scenario A: Bullish Rejection from Support
If price retests the support zone (0.86400 – 0.86200) and forms a bullish rejection (e.g., pin bar or engulfing), a bounce is likely.
Target: Resistance zone 0.87600 – 0.87800
Confirmation: Bullish candle + break of 0.86900 resistance.
❌ Scenario B: Bearish Breakout Below Support
A break and close below 0.86200 may trigger a deeper correction.
Next possible downside target: 0.85800
Volume drop and strong red candles would support this.
🔧 Technical Summary:
Indicator Status
Structure Sideways / Range-bound
Supertrend Bearish (Short-term)
Support Zone 0.86200 – 0.86400
Resistance Zone 0.87600 – 0.87800
Bias Neutral-to-Bullish (above support)
🧠 Educational Note:
This chart is a great example of range trading—where traders look to buy near support and sell near resistance, especially when there is no strong trend. Patience and confirmation signals (like wick rejections or volume spikes) are key in such setups.
Do you agree with a big profit in EURGBP?Hi my dears
The pattern seems to be broken, so let's go up.
Join me with a guaranteed profit.
If you liked my analysis, please support my page.
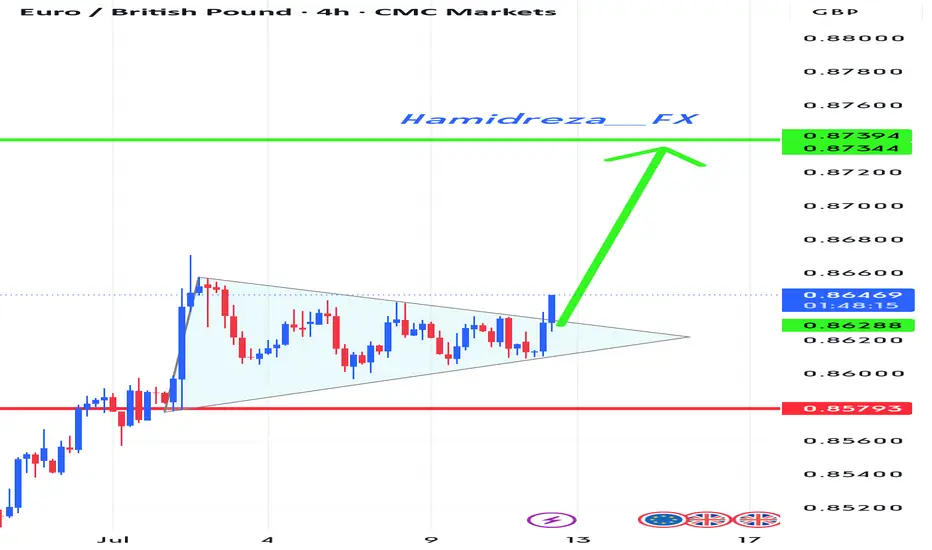
Check the trend Given the price behavior within the current resistance range, possible scenarios have been identified. It is expected that after some volatility and correction, we will see a continuation of the upward trend.
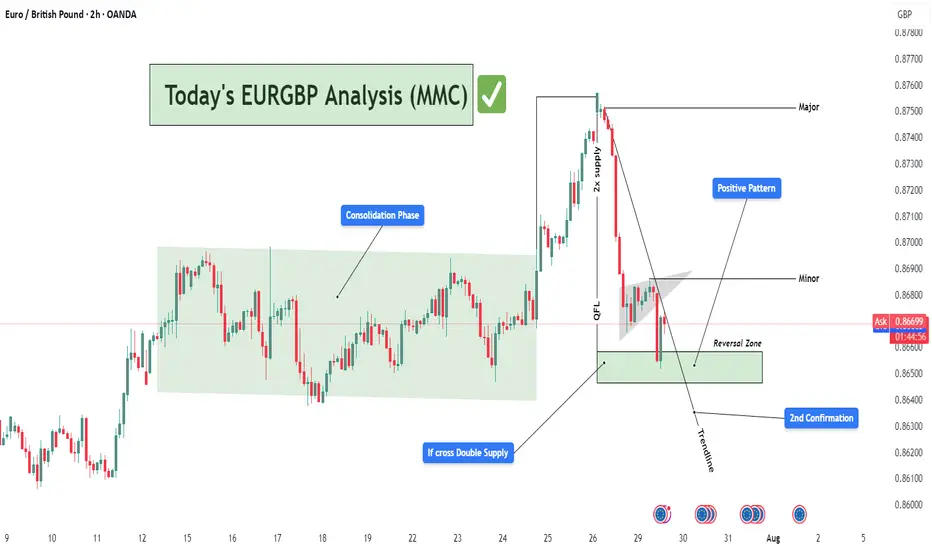
EURGBP Bullish Reversal Setup from Demand Zone (MMC Strategy)📊 Detailed Technical Analysis:
The EURGBP pair on the 2-hour chart is currently at a critical technical juncture, showing signs of a potential bullish reversal. This analysis follows Market Maker Concepts (MMC), which combines liquidity engineering, smart money movements, and structure shifts. Let’s break it down:
🔄 1. Consolidation Phase – Accumulation in Action (Smart Money Footprint)
Between July 15 to 24, the price moved within a tight range — classic consolidation behavior.
This phase suggests accumulation by institutional players, quietly building long positions while trapping retail shorts and longs.
This kind of sideways structure typically precedes a high-volume breakout, which happened right after.
📌 Lesson: Consolidation is often the calm before the storm — prepare for a breakout when this phase completes.
🚀 2. Breakout with QFL Pattern – Aggressive Bullish Shift
The price broke above the consolidation range and surged strongly.
This breakout followed a classic QFL (Quick Flip Level) structure — where price forms a base, drops temporarily, and then explodes upward.
The area of breakout aligns with a “2x Supply” zone — meaning this zone acted as a magnet for stop orders, and once breached, added more fuel to the rally.
📌 Why QFL Matters: It marks a shift in market sentiment — from balanced to strongly biased, in this case toward bulls.
📉 3. Pullback Phase – Structural Correction Begins
After reaching a high near 0.87500 (major resistance), price began to pull back sharply.
It formed a minor descending flag/channel, a classic corrective pattern, often a pause before resuming the larger trend.
A descending trendline has been drawn to capture this pullback structure.
📌 Important: Pullbacks are healthy — they allow for re-entries and provide better R:R setups.
📍 4. Reversal Zone – Key Demand Revisited
Price now sits within a Reversal Zone (Demand Area), marked in green on the chart.
This level previously served as the base for the breakout and aligns with institutional buying interest.
The area acts as a high-probability buy zone, supported by:
Trendline support
Price rejecting lower levels
Historical reaction at this zone
📌 Why It’s Crucial: If price respects this demand zone, it confirms bullish intent and creates a low-risk buying opportunity.
✅ 5. 2nd Confirmation – Price Action Support
The chart marks a "2nd Confirmation" label at a slightly lower level — this is a final support level, a safety net.
If price dips and bounces here again, it confirms buyer strength.
Strong price reaction at this level would validate a trend continuation setup back toward highs.
💹 6. Positive Pattern – Early Reversal Signs
Inside the demand zone, a bullish structure is forming.
This could be an inverted head & shoulders, or a double bottom pattern.
These patterns often act as launch pads for upward moves, especially when combined with institutional demand.
📌 MMC Insight: Market Makers engineer dips to induce panic, only to reverse aggressively once liquidity is absorbed.
🎯 Trade Plan Based on the Analysis:
Buy Zone: Between 0.86450 – 0.86700 (Reversal Zone)
Stop-Loss: Below 0.86250 (beneath 2nd confirmation)
Take Profits:
🎯 TP1: 0.86900 (Minor resistance)
🎯 TP2: 0.87500 (Major swing high)
Risk-to-Reward: 1:2 or higher depending on entry timing
🧠 MMC Strategy Summary for Minds:
This EURGBP 2H chart is a textbook example of MMC-based trading. We saw:
Institutional accumulation (consolidation phase)
QFL breakout (confirmation of bullish intent)
Return to demand (market maker’s discount area)
Early bullish signals (positive price action patterns)
Multiple confluences at the Reversal Zone (trendline, demand, confirmation zone)
Such a combination offers a high-probability swing trade setup. Patient traders can wait for the structure to break upward and join the trend with tight risk and clear targets.
29.07.25 Morning ForecastPairs on Watch -
FX:EURGBP
FX:AUDUSD
FX:NZDUSD
A short overview of the instruments I am looking at for today, multi-timeframe analysis down to what I will be looking at for an entry. Enjoy!

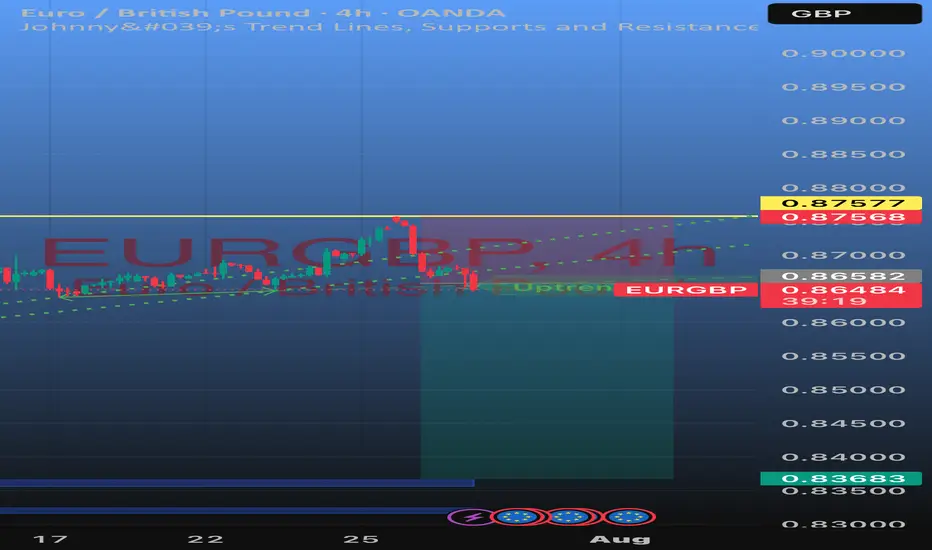
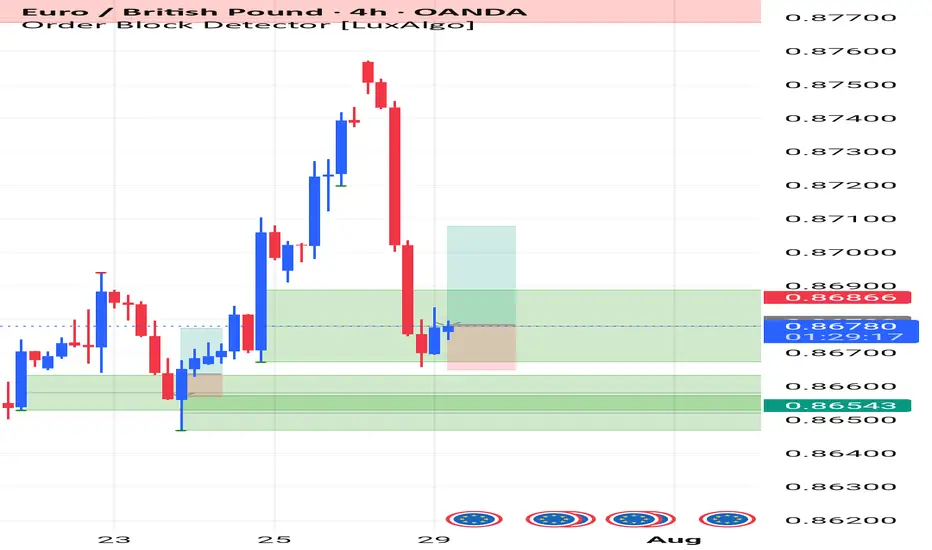
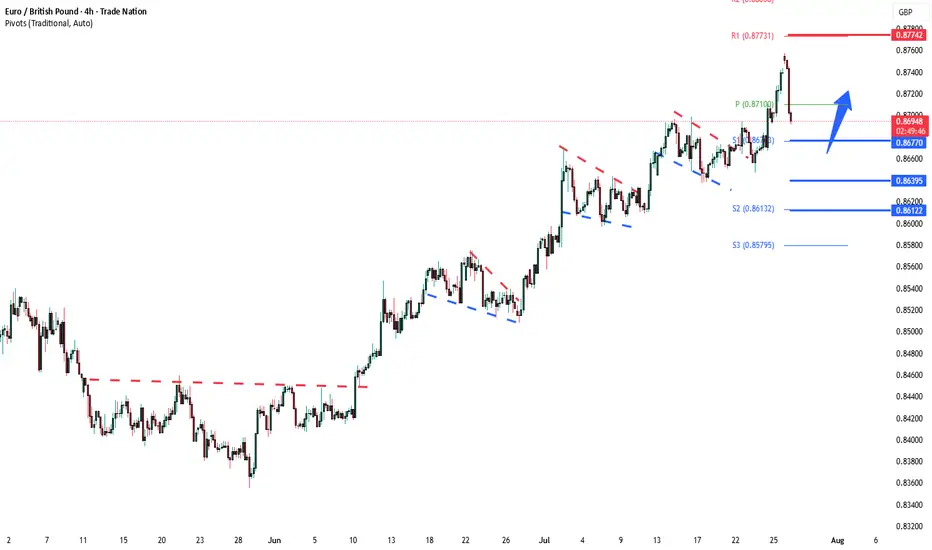
$EURGBP rade Setup: EURGBP – Buy Opportunity Identified We haveOANDA:EURGBP rade Setup: EURGBP – Buy Opportunity Identified
We have spotted a favorable buying opportunity on the EURGBP currency pair, supported by technical patterns and recent market behavior.
EURGBP is showing signs of a bullish reversal after bouncing off a short-term support zone near the 0.86680–0.86700 range.
The entry at 0.86786 offers a strong technical position, just above the support, and aligned with the start of a potential upward swing.
The first target of 0.86850 is modest but strategically placed to lock in quick intraday profits while confirming the upward move.
The first target of 0.86850 is modest but strategically placed to lock in quick intraday profits while confirming the upward move.
The second target at 0.86980 sits at a prior resistance level, which has historically triggered pullbacks—an ideal mid-term objective.
The third and final target at 0.87100 aligns with a significant psychological resistance zone, offering a well-balanced reward.
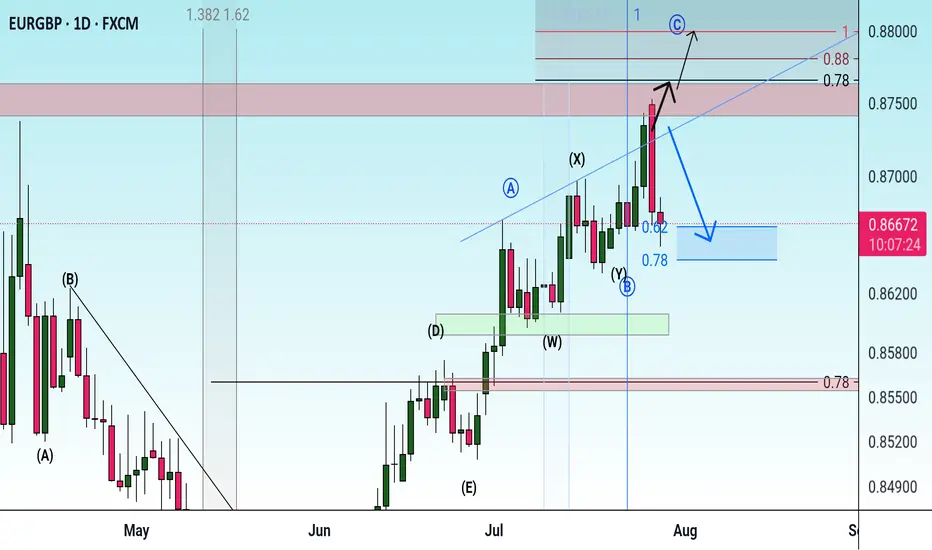
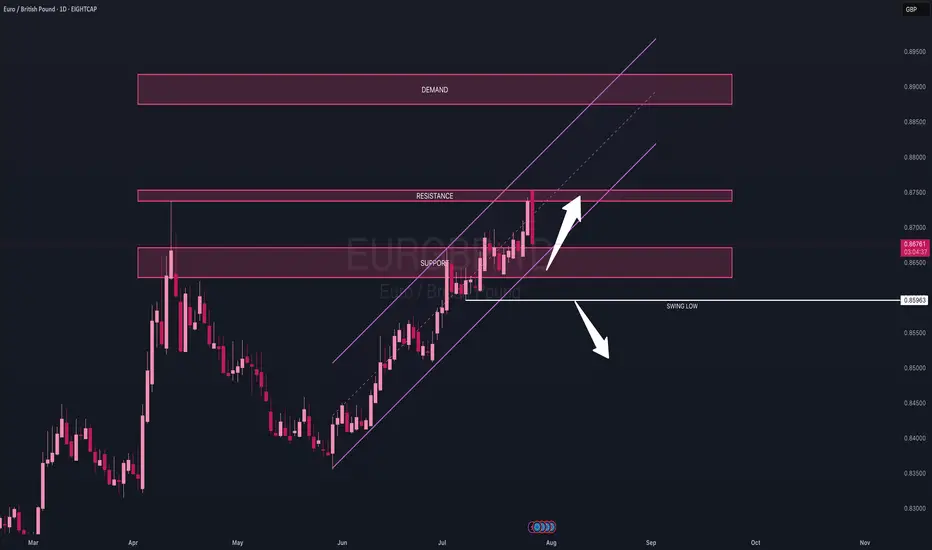
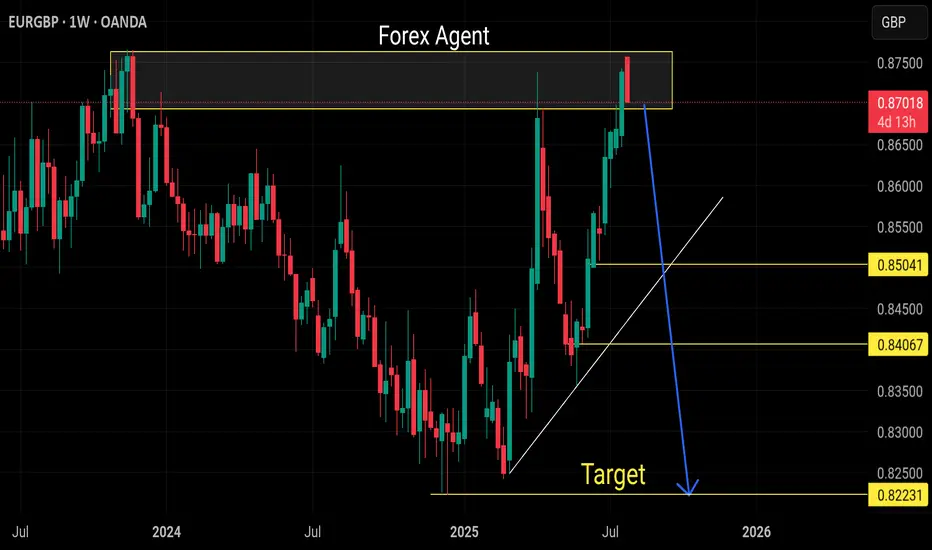
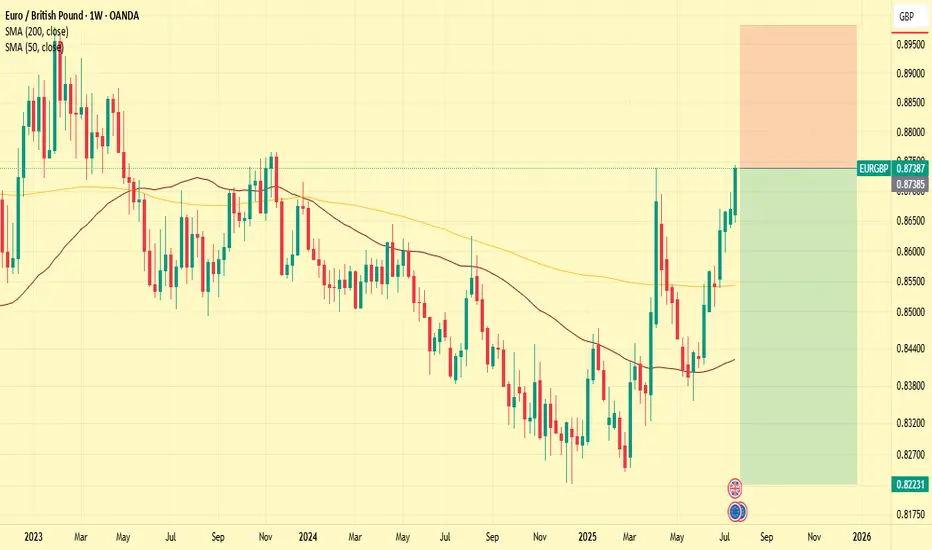
EUR/GBP OUTLOOK ON THE DAILYOn the daily timeframe, price retested a key resistance zone on Friday, which was previously tapped in April. This level originally acted as a demand area back in November 2023.
After the April rejection, price dropped approximately 381 pips before beginning its current bullish incline. As of now, price is retesting this resistance area, which is expected to flip into support to allow for continued upward momentum.
My bias remains bullish as long as this support holds, with a target toward the next demand area from March 2023.
However, a break below the daily swing low at 0.85963 would invalidate this scenario and shift the structure.
⚠️ As always, trade responsibly — risk only 1–2% of your capital per day and stay alert, especially around volatile sessions.
Stay sharp and trade safe!
EUR/GBP sell opportunity confirmed!EURGBP plummeted over 0.76% today from its high. It’s now confirmed that we could experience a correction on the weekly high. A sell opportunity is envisaged from the H4 timeframe.
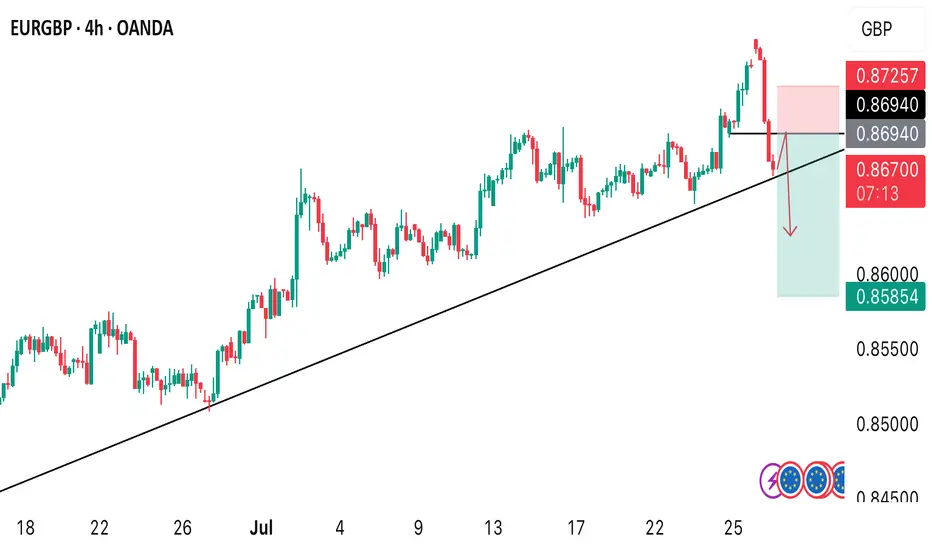
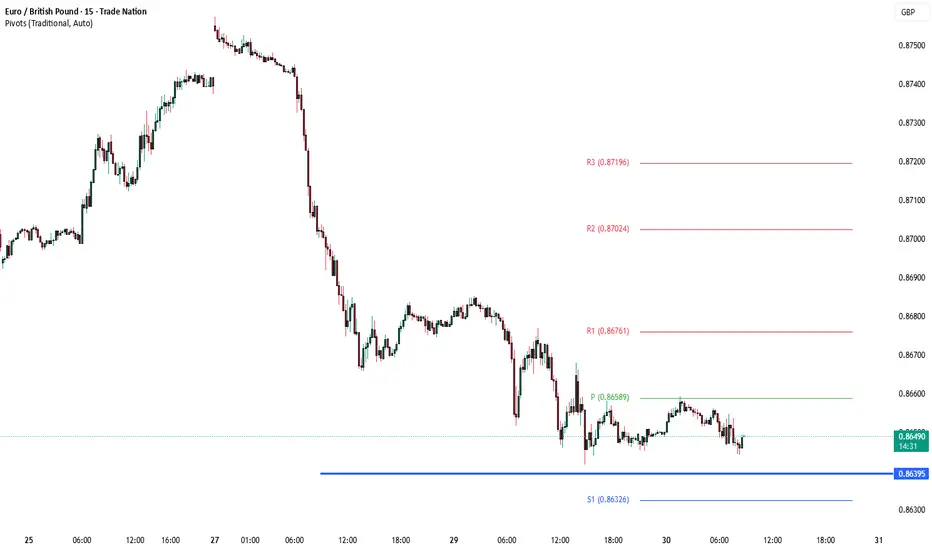
EURGBP overbought pullback support at 0.8677The EURGBP remains in a bullish trend, with recent price action showing signs of a corrective pullback within the broader uptrend.
Support Zone: 0.8677 – a key level from previous consolidation. Price is currently testing or approaching this level.
A bullish rebound from 0.8677 would confirm ongoing upside momentum, with potential targets at:
0.8775 – initial resistance
0.8807 – psychological and structural level
0.8845 – extended resistance on the longer-term chart
Bearish Scenario:
A confirmed break and daily close below 0.8677 would weaken the bullish outlook and suggest deeper downside risk toward:
0.8640 – minor support
0.8612 – stronger support and potential demand zone
Outlook:
Bullish bias remains intact while the GBPUSD holds above 0.8677 A sustained break below this level could shift momentum to the downside in the short term.
This communication is for informational purposes only and should not be viewed as any form of recommendation as to a particular course of action or as investment advice. It is not intended as an offer or solicitation for the purchase or sale of any financial instrument or as an official confirmation of any transaction. Opinions, estimates and assumptions expressed herein are made as of the date of this communication and are subject to change without notice. This communication has been prepared based upon information, including market prices, data and other information, believed to be reliable; however, Trade Nation does not warrant its completeness or accuracy. All market prices and market data contained in or attached to this communication are indicative and subject to change without notice.
Sell eurgbpStrong sell expected as euro ready to weak across all cross pairs
Weekly daily overbought pair
Ready for the bearish correction
DeGRAM | EURGBP exited the channel📊 Technical Analysis
● Breakout: price burst from the July descending wedge, reclaimed 0.8695 former cap, and is now riding a steep intraday channel of higher-highs; the channel mid-line aligns with the broken wedge roof, adding fresh support.
● A pennant is consolidating just above 0.8695; its measured pole and the outer channel top converge at the next horizontal barrier 0.8739.
💡 Fundamental Analysis
● Softer UK July composite-PMI (47.9 vs 50.2 prior) revived BoE cut bets, while ECB speakers flagged “premature to talk easing,” narrowing the rate gap in the euro’s favour.
✨ Summary
Long 0.8695-0.8705; pennant break targets 0.8739. Bias void on a 30 m close below 0.8648.
-------------------
Share your opinion in the comments and support the idea with like. Thanks for your support!
EURGBPOANDA:EURGBP 💼 Trade Idea: EUR/GBP – Short Position
A potential selling opportunity has emerged on the EUR/GBP currency pair, suggesting that the Euro may continue to weaken against the British Pound. Based on current technical patterns and market sentiment, a short position could be favorable at the identified levels.
📉 Entry Zone: 0.87467
🎯 1st Target: 0.87300
🎯 2nd Target: 0.87250
🎯 3rd Target: 0.87140
🛑 Stop Loss: 0.87950
---
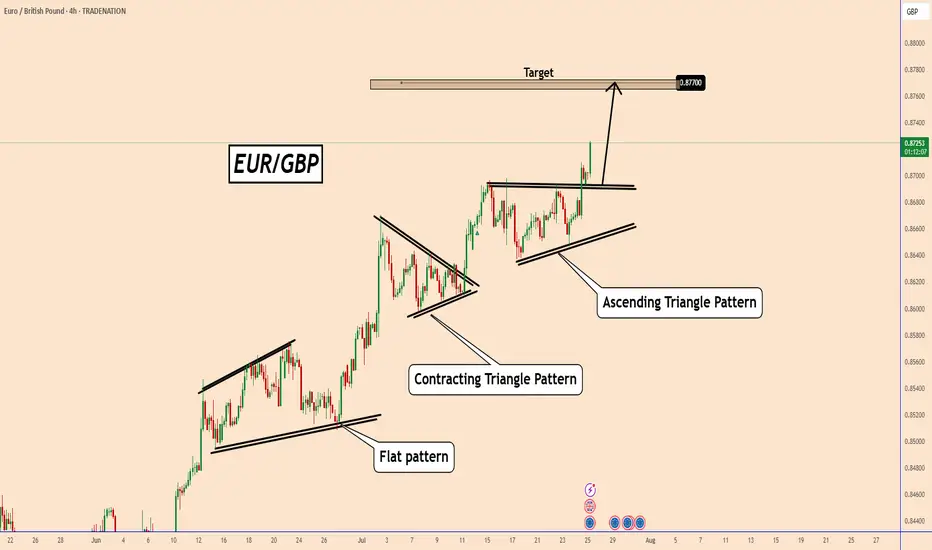
EURGBP Is Rising Further After UK Retail Sales missed estimatesEURGBP Is Rising Further After UK Retail Sales missed estimates
EURGBP already broke out from an Ascending Triangle pattern after it spent some time in accumulation and without direction the price is rising today.
This is the third and clear bullish pattern that EURGBP broke out and the chances to rise one more time are high.
K retail sales is supporting this bullish movement because they failed to meet expectations.
Overall, the data was higher compared to the last month, but the fact that it missed expectations suggests that the UK economy is growing in small steps.
You may find more details in the chart!
Thank you and Good Luck!
PS: Please support with a like or comment if you find this analysis useful for your trading day
Disclosure: I am part of Trade Nation's Influencer program and receive a monthly fee for using their TradingView charts in my analysis.
Swing Short for EURGBPPrice will likely turn bearish again soon. Expecting the Pound to regain ground.
EUR-GBP Swing Short! Sell!
Hello,Traders!
EUR-GBP keeps growing in
A strong uptrend but the pair
Is locally overbought so after
The price hits a horizontal
Resistance level of 0.8764
We will be expecting a
Local bearish correction
Sell!
Comment and subscribe to help us grow!
Check out other forecasts below too!
Disclosure: I am part of Trade Nation's Influencer program and receive a monthly fee for using their TradingView charts in my analysis.
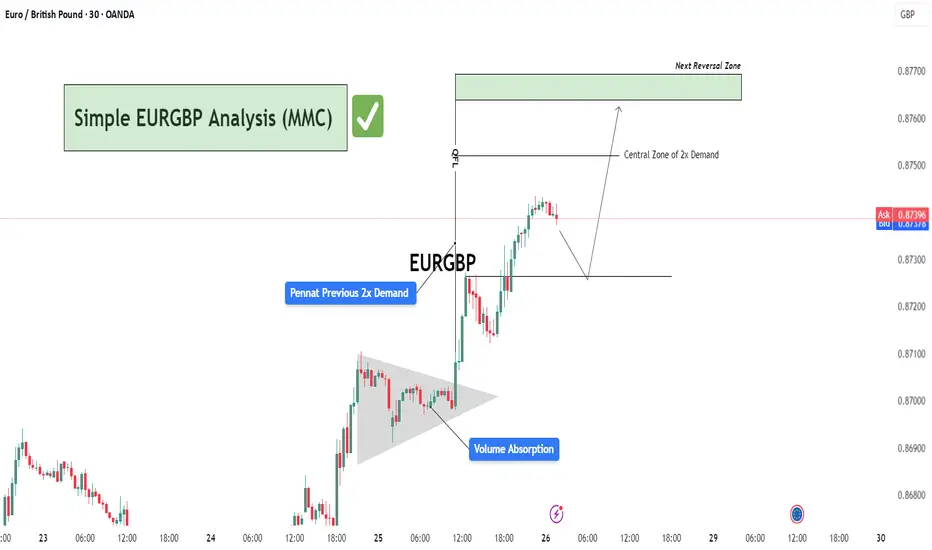
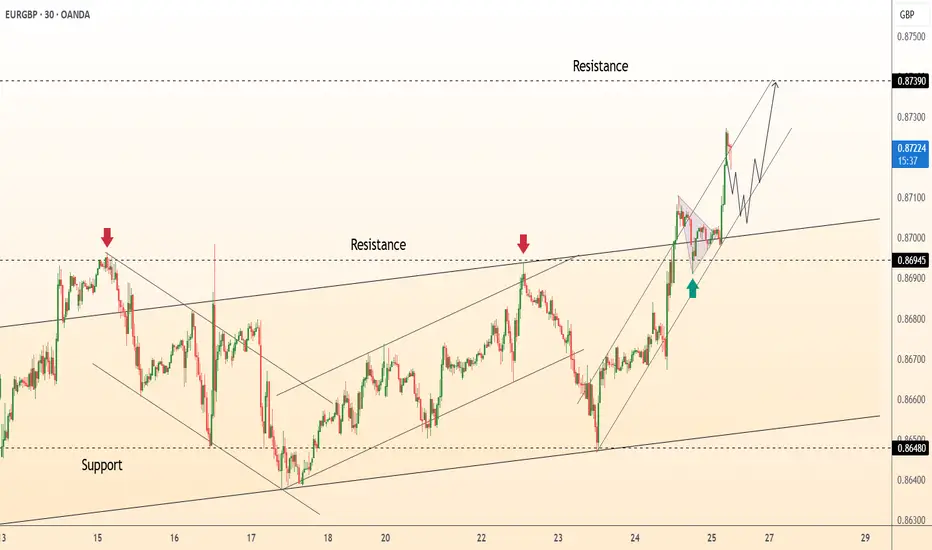
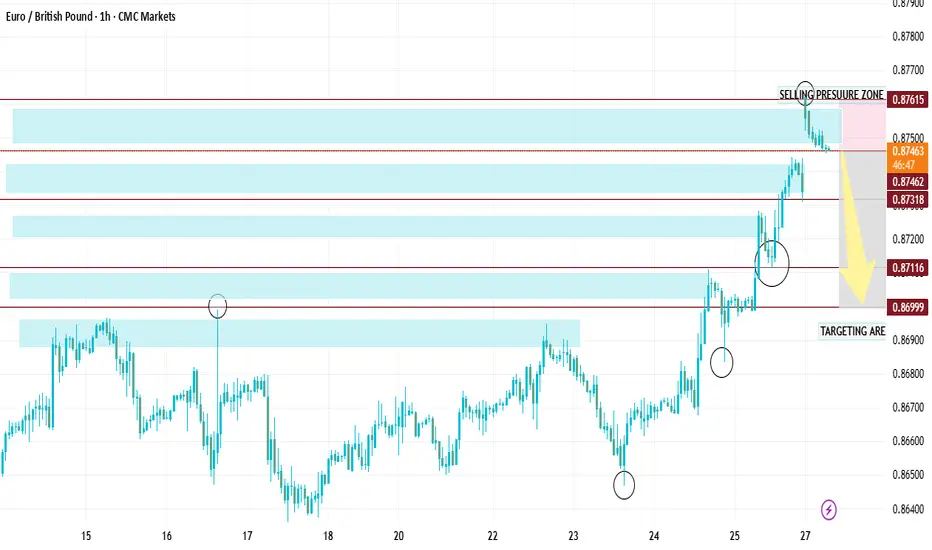
Simple EURGBP Analysis (MMC) – Bullish Continuation or Reversal?🕵️♂️ Chart Overview – 30-Min Timeframe (OANDA)
This EURGBP chart illustrates a classic bullish continuation structure following a volume absorption phase and pennant formation, leading into a vertical price expansion toward a potential reversal zone. The technical flow demonstrates smart money accumulation and re-accumulation before a sharp bullish leg.
🔷 Phase 1: Bullish Accumulation via Pennant Formation
The chart begins with a tight consolidation structure marked as a pennant, typically a continuation pattern.
This area coincides with “Previous 2x Demand”, hinting at a strong institutional buying interest.
The Volume Absorption label suggests that sell-side liquidity was efficiently absorbed—often a precursor to bullish breakouts.
📈 Phase 2: Breakout & Price Expansion
Price breaks out of the pennant aggressively, validating the absorption theory.
The post-breakout rally continues with minimal retracement, showcasing impulsive bullish momentum.
The QFL (Quasimodo Failure Level) is also marked—this serves as a structural footprint left by trapped sellers.
🟩 Next Levels to Watch: Reversal or Re-Entry Zones
As the price approaches the green "Next Reversal Zone" (0.87650–0.87700), watch for potential exhaustion or a reaction.
The Central Zone of 2x Demand (just below 0.87500) could act as a re-entry level for continuation long setups.
Anticipated short-term correction before continuation, as depicted by the projected path.
🧠 Strategic Insight & Trade Planning
Aggressive Bulls: May target breakout pullbacks near the Central Zone of Demand for intraday continuation.
Conservative Traders: Should wait for a clean reaction from the green Reversal Zone. If rejection is confirmed, short opportunities with tight stops become favorable.
Watch the price behavior around 0.87300–0.87500—this will likely dictate whether continuation or correction prevails.