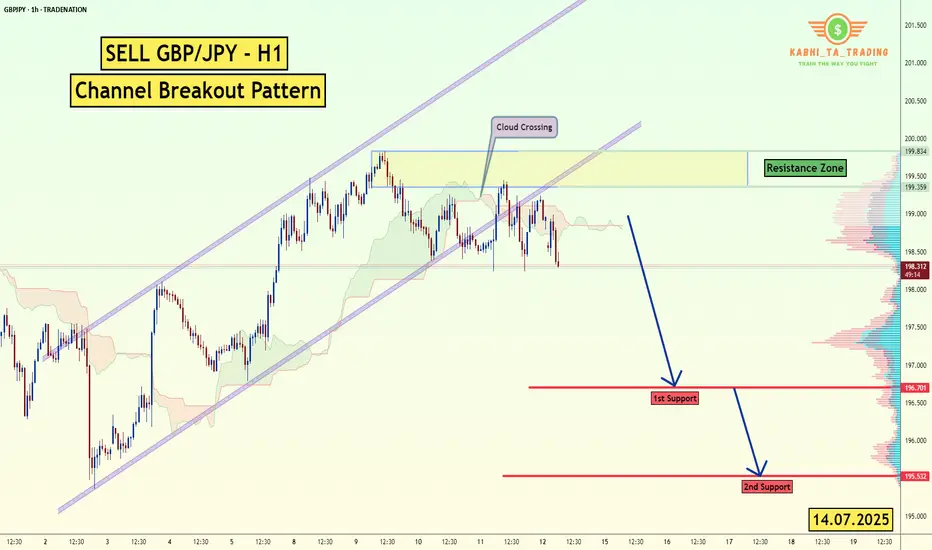
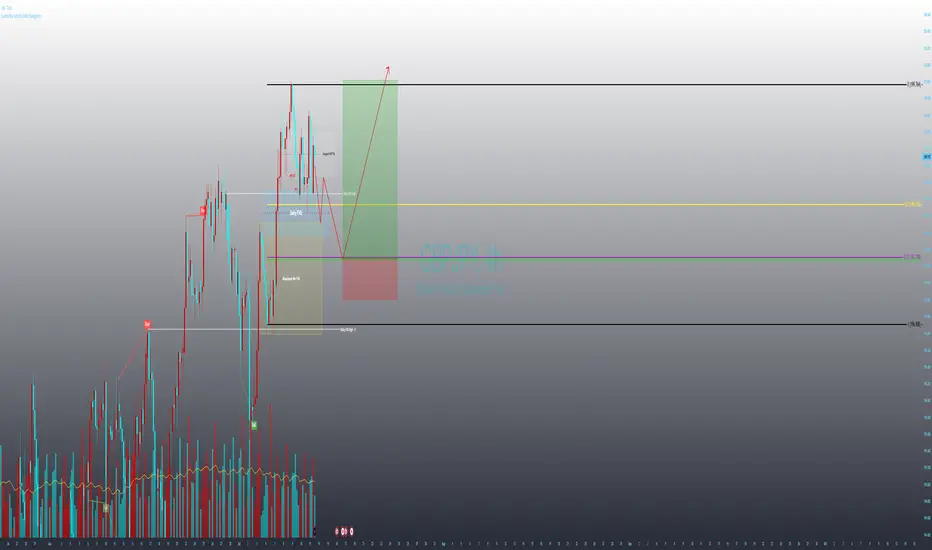
GBP/JPY -H1- Channel Breakout (14.07.2025)The GBP/JPY Pair on the H1 timeframe presents a Potential Selling Opportunity due to a recent Formation of a Channel Breakout Pattern. This suggests a shift in momentum towards the downside in the coming hours.
Possible Short Trade:
Entry: Consider Entering A Short Position around Trendline Of The Pattern.
Target Levels:
1st Support – 196.70
2nd Support – 195.53
🎁 Please hit the like button and
🎁 Leave a comment to support for My Post !
Your likes and comments are incredibly motivating and will encourage me to share more analysis with you.
Best Regards, KABHI_TA_TRADING
Thank you.
Disclosure: I am part of Trade Nation's Influencer program and receive a monthly fee for using their TradingView charts in my analysis.
GBPJPY trade ideas
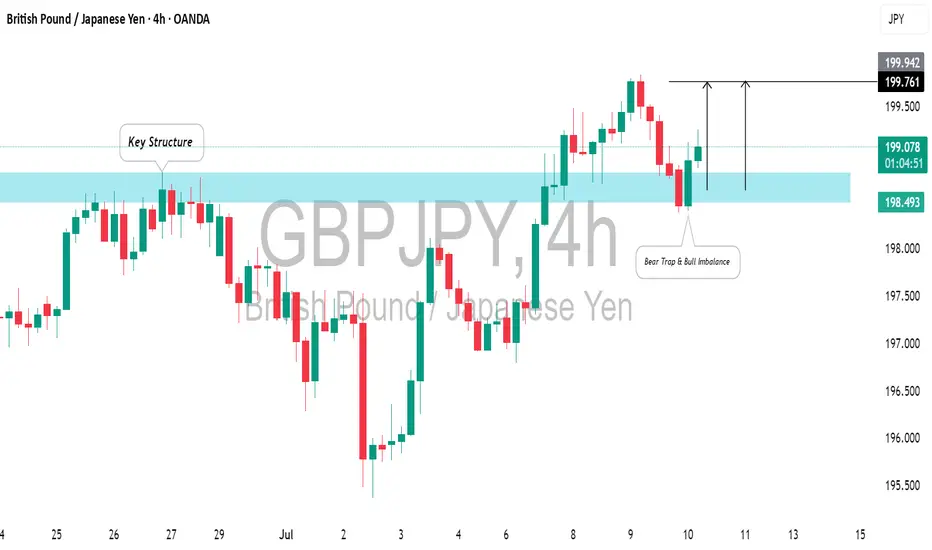
GBPJPY: Bullish Move From SupportGBPJPY may continue rising from the highlighted blue horizontal support level.
A brief liquidity spike below that, followed by a bullish imbalance candle on the 4-hour chart, supports this.
I anticipate a rise to 199.94.
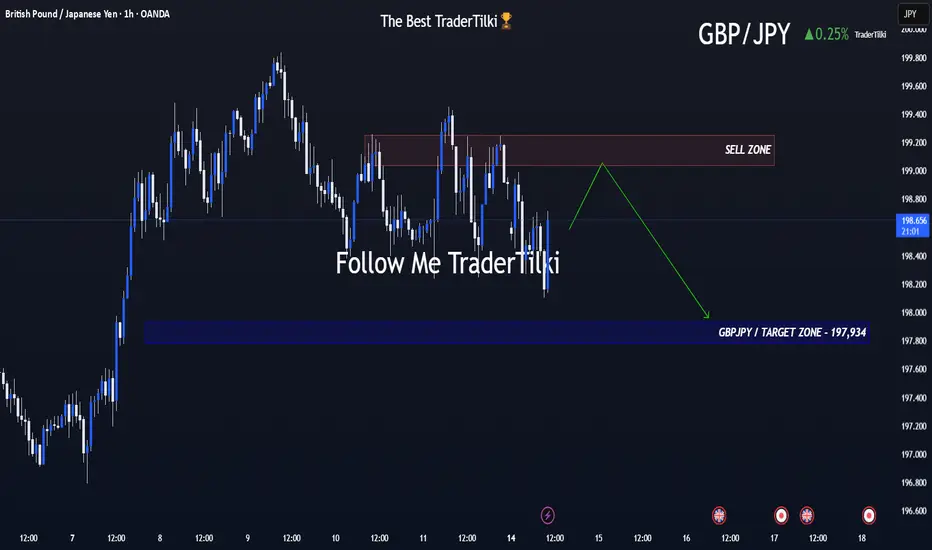
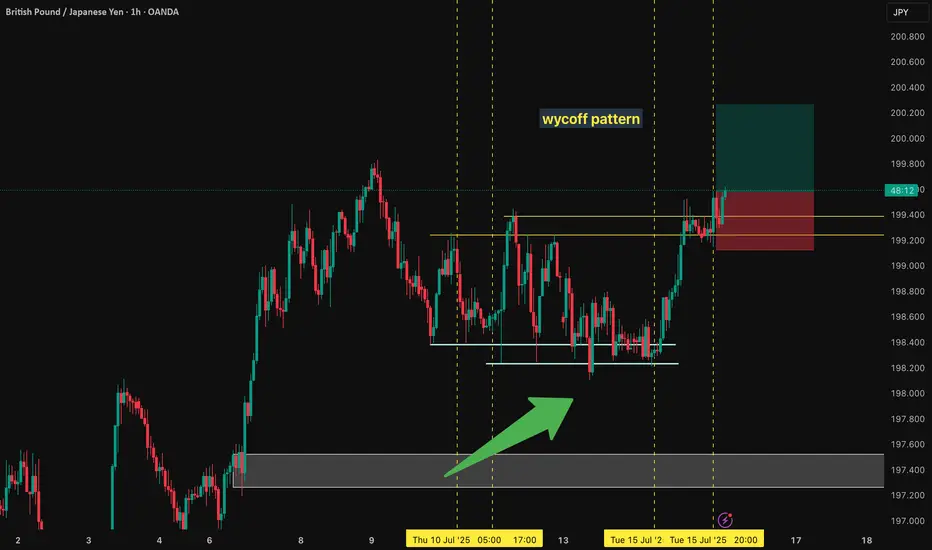
GBPJPY: floating at the top – is a drop being loaded?GBPJPY is hovering around 198.91 after an impressive rally, but now it's trapped between two key zones: 199.85 – a resistance level that keeps rejecting price, and 198.20 – a fragile support below. The price action reveals a tense sideways pattern, like a spring coiling up before release.
What’s concerning is that buyers have attempted to break above the high multiple times and failed – and each failure comes with weaker rebounds. With the Bank of England shifting toward a “pause” stance and the yen gaining mild support from rising risk-off sentiment, the market is starting to lean toward a correction.
If price breaks below 198.20, it could mark the beginning of a deeper slide back toward the lower boundary of the channel. Don’t be fooled by the silence – sometimes, calm is the precursor to a sharp fall.
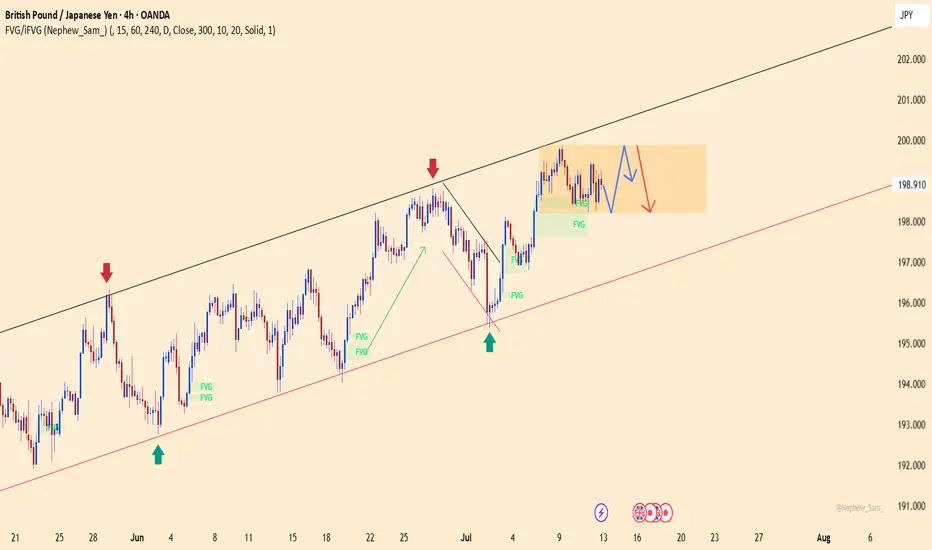
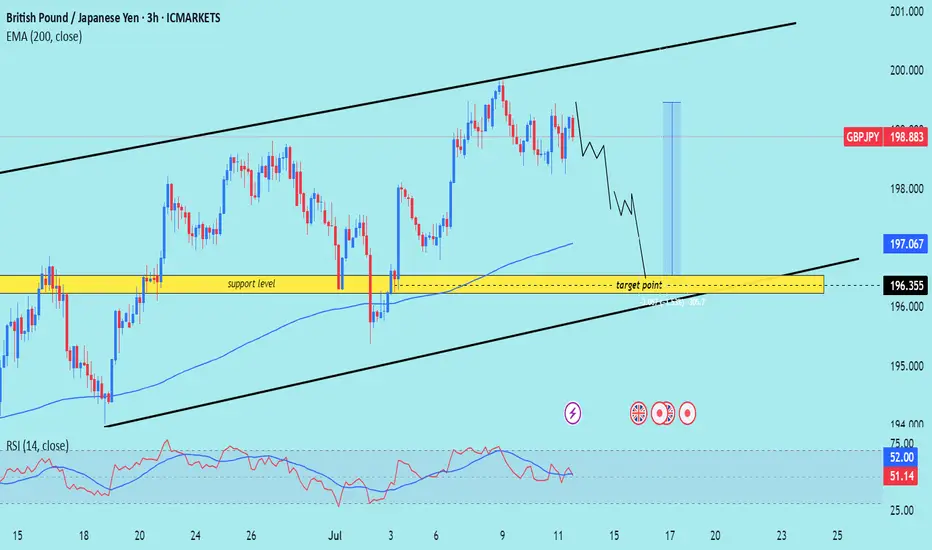
GBP/JPY) Bearish Analysis Read The captionSMC trading point update
Technical analysis of GBP/JPY on the 3-hour timeframe, suggesting a potential short-term pullback within a larger ascending channel.
---
Analysis Summary
Pair: GBP/JPY
Timeframe: 3H
Current Price: 198.883
Bias: Bearish move toward channel support
---
Key Technical Insights
1. Ascending Channel Formation:
Price is moving within an upward-sloping channel.
Current structure suggests price is heading toward the lower trendline support.
2. Support Level & Target Zone:
The yellow zone around 196.355 is a major support area and target point, coinciding with both structural support and the bottom of the channel.
3. EMA (200 Close):
Price is still above the 200 EMA (197.067), so overall trend remains bullish — but current move is a correction.
4. RSI (14):
RSI is neutral near 51.14, allowing room for further downward movement before becoming oversold.
---
Target Point
Target: 196.355 (support zone and bottom of channel)
---
Trade Idea
Direction Entry Stop-Loss Target
Sell 198.80–199.00 Above 199.70 196.35
SMC trading point
---
Summary
GBP/JPY is likely to retrace toward support at 196.35 before possibly bouncing within the larger bullish structure. This offers a short-term selling opportunity, with potential buy setups near the lower trendline later.
Please support boost 🚀 this analysis)
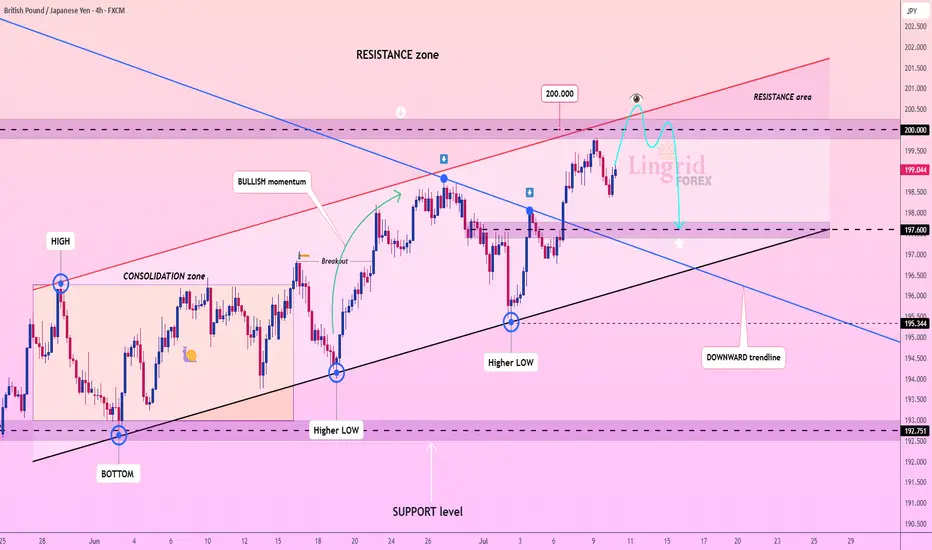
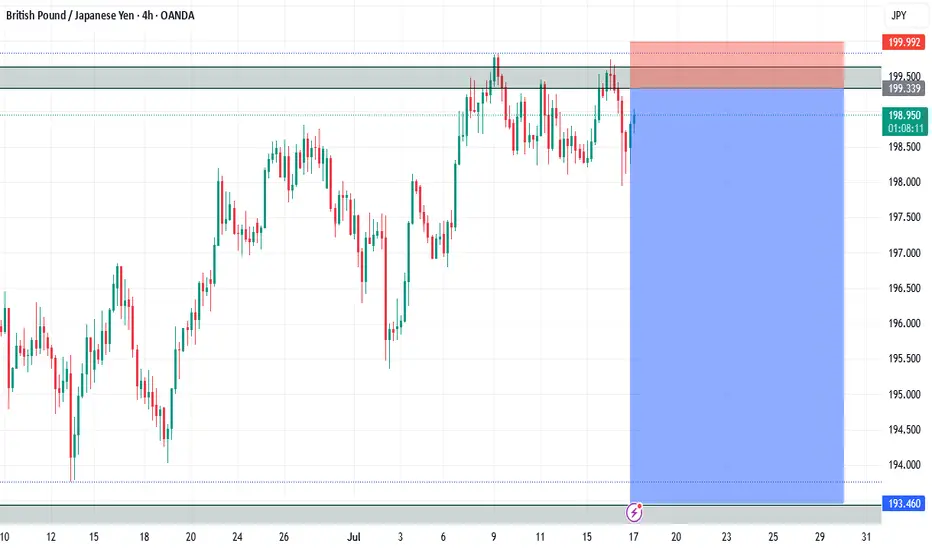
Lingrid | GBPJPY possible Pullback From Psychological LevelThe price perfectly fulfilled my last idea . FX:GBPJPY is testing the upper boundary of the resistance zone near the psychological 200.000 mark after a strong bullish impulse. Price is showing early signs of rejection from the red trendline and horizontal resistance, suggesting potential for a corrective move. If confirmed, a drop toward the 197.600–197.000 region becomes likely, aligning with the lower bound of the rising channel. A break below this level could expose deeper downside toward the 195.5 support.
📉 Key Levels
Sell trigger: confirmed rejection from 200.000 with bearish engulfing
Sell zone: 200.50–200.00 (key resistance zone and trendline touch)
Target: 197.600
Invalidation: sustained close above 200.500 flips structure bullish
💡 Risks
Strong bullish continuation above 200.000 would invalidate short setup
Yen weakness from BOJ policy shifts could drive GBPJPY higher
Support at 197.600 may cause bounce and false breakout scenarios
If this idea resonates with you or you have your own opinion, traders, hit the comments. I’m excited to read your thoughts!
GBPJPY Bullish Breakout IncomingAnother bullish breakout on the H4 TF is pending. The trend has been consistently bullish and confirmations of a continuation are clear.
Wait for that breakout of the bullish pattern and ride the trend.

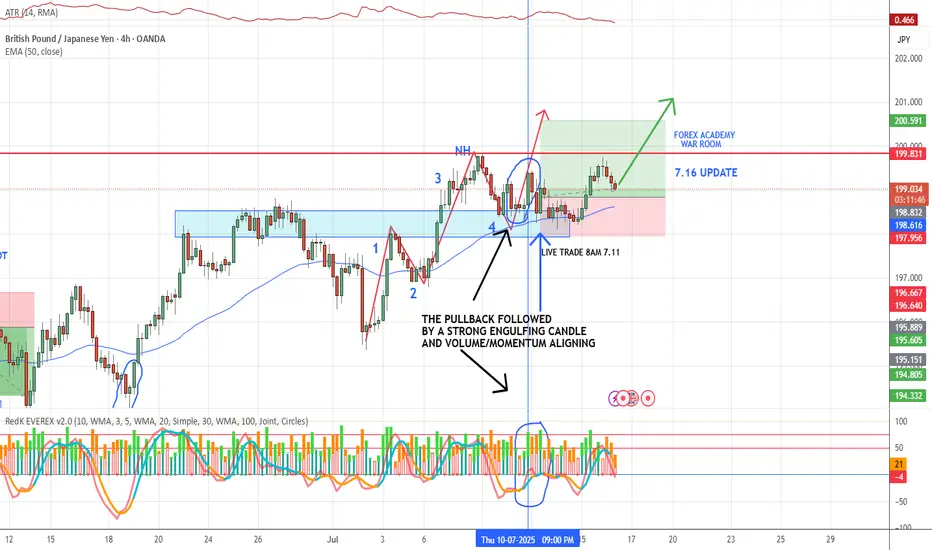
7.14 GBP/JPY 4H LIVE TRADE UPDATENow that the swing low has been tested and broken we should see this market heading higher

GBPJPY is in the Down Trend From Resistance LevelHello Traders
In This Chart GBPJPY HOURLY Forex Forecast By FOREX PLANET
today GBPJPY analysis 👆
🟢This Chart includes_ (GBPJPY market update)
🟢What is The Next Opportunity on GBPJPY Market
🟢how to Enter to the Valid Entry With Assurance Profit
This CHART is For Trader's that Want to Improve Their Technical Analysis Skills and Their Trading By Understanding How To Analyze The Market Using Multiple Timeframes and Understanding The Bigger Picture on the Charts
Will GBPJPY uptrend continue??Price is at a crucial point where traders are beginning to watch what’s likely to happen next in the market. Is market likely to continue to trade higher? From the technical standpoint, if price continues to rise and break the 200.000 level we will look for a buy opportunity in this market.
17.07.25 Morning ForecastPairs on Watch -
OANDA:US30USD
CAPITALCOM:DE40
FX:GBPJPY
A short overview of the instruments I am looking at for today, multi-timeframe analysis down to what I will be looking at for an entry. Enjoy!

GBPJPY Surges as Trade Tensions Weaken YenGBPJPY Surges as Trade Tensions Weaken Yen
GBPJPY remains firmly in a bullish trend, having broken through two key resistance levels.
The first breakout occurred at 196.80, followed by a decisive move above 198.75 on Monday, signaling accelerating bullish momentum.
On July 7, the White House issued a strong letter to Japan’s Prime Minister, expressing concerns over the trade deficit and announcing a 25% tariff on Japanese goods, effective August 1, 2025.
This development has added pressure on the yen, and the weakness could persist in the near term.
However, the situation is still unfolding. Trump is expected to send additional letters today, which could inject further volatility into the markets.
You may find more details in the chart!
Thank you and Good Luck!
PS: Please support with a like or comment if you find this analysis useful for your trading day
GBPJPYGBP/JPY is undergoing a trend reversal.
What matters is that, based on price action and fractal concepts, the bullish trend has ended.
Practice proper risk management and protect your profits.
7.16 GBP/JPY LIVE TRADE UPDATE DAY 4We are waiting for a break and close above the previous swing high to confirm the uptrend continuation.
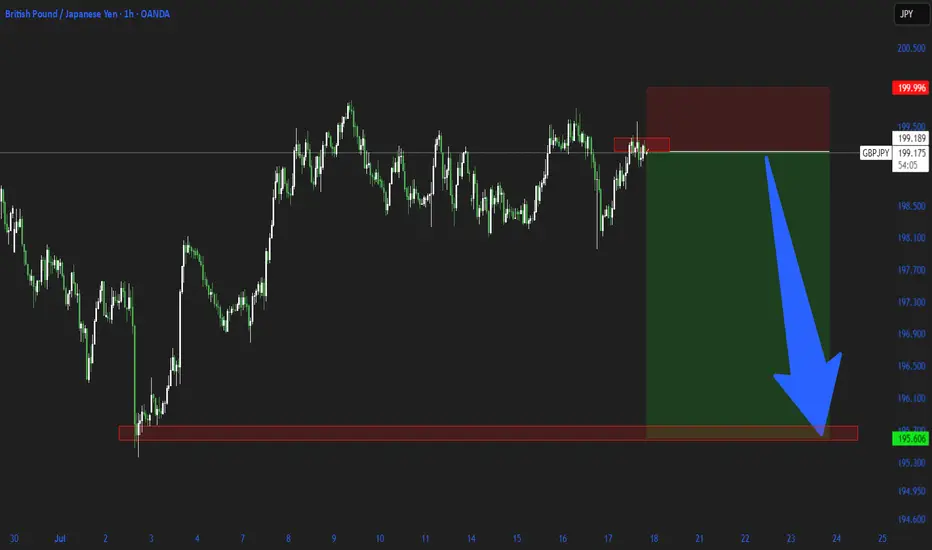
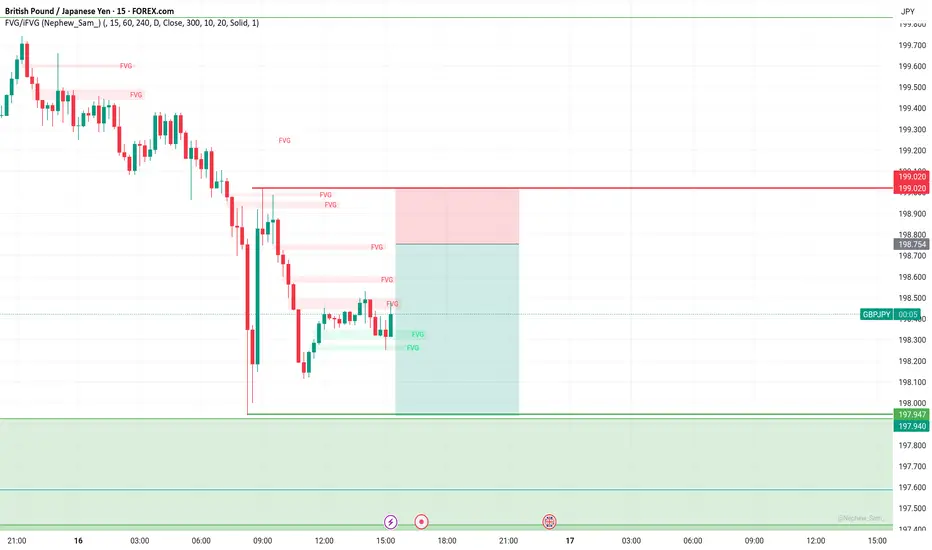
Volatile Times for GBPJPY: What’s Going On Behind the Moves?Good morning, Guys,
I’m anticipating a new short opportunity on GBPJPY once the pair reaches my sell zone level. From there, my target is set at 197.934.
Every like from you is what truly motivates me to keep sharing these insights.
Massive thanks to everyone who shows love and support!
GBPJPY SellThis currency pair is in a clear downtrend. The best idea is to sell at the moment of hitting the downtrend line.

Guppy - Long TradeExpecting a bearish move down and then a strong reversal at the levels displayed!
Happy Trading!
GBP/JPY Quick trade on the 15 minTrending down into a order block. Medium Risk as HTF are in the middle of the range just above the order block
My View On GBP/JPYWhy I think the tops in
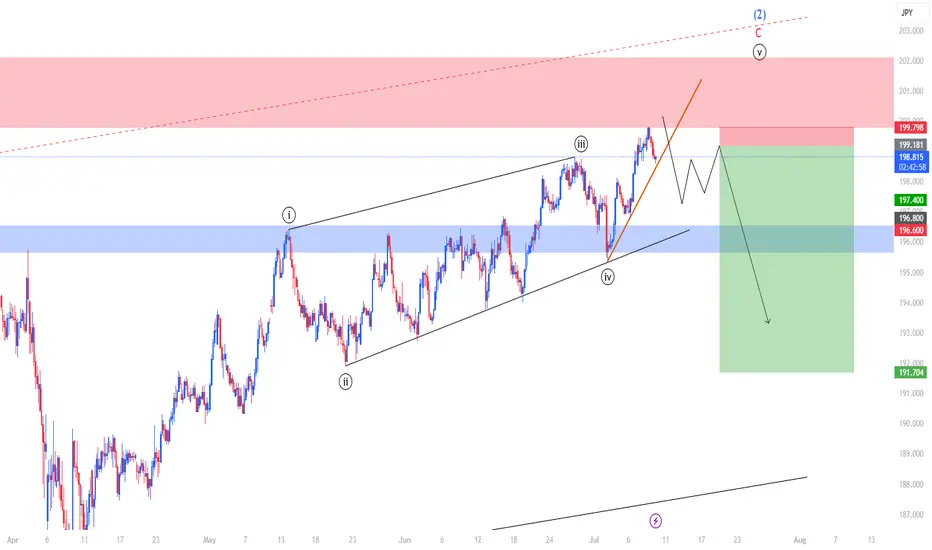
Elliott Wave Structure Completed
We’re now at the conclusion of a 5‑wave impulse (i→v) that tops off within wave (1), followed by an A‑B‑C corrective sequence. Wave C peaks right inside a major supply zone — classic exhaustion of bullish momentum.
Resistance & Trendline Rejection
Price hit a red supply/resistance area, tested it, and has already broken back below the short‑term upward trendline. That break is a reliable early signal that the uptrend is losing steam.
Bearish Continuation Pattern Forming
The drawn schematic suggests a sequence of lower highs is setting up—then a break toward the blue support zone near 196.60–197.40. All signs point to a deeper correction or even a fresh downtrend for wave (3).
Technical Confluence at Wave (2)
Wave (2) ends within multiple layers of resistance: a price zone, a wave count, and a rising wedge. Combined, this quadruple confluence is a textbook reversal scenario.
Macro factors support a top:
Central bank divergence is flattening
Yen may rebound on global uncertainty
Sterling faces domestic fragility
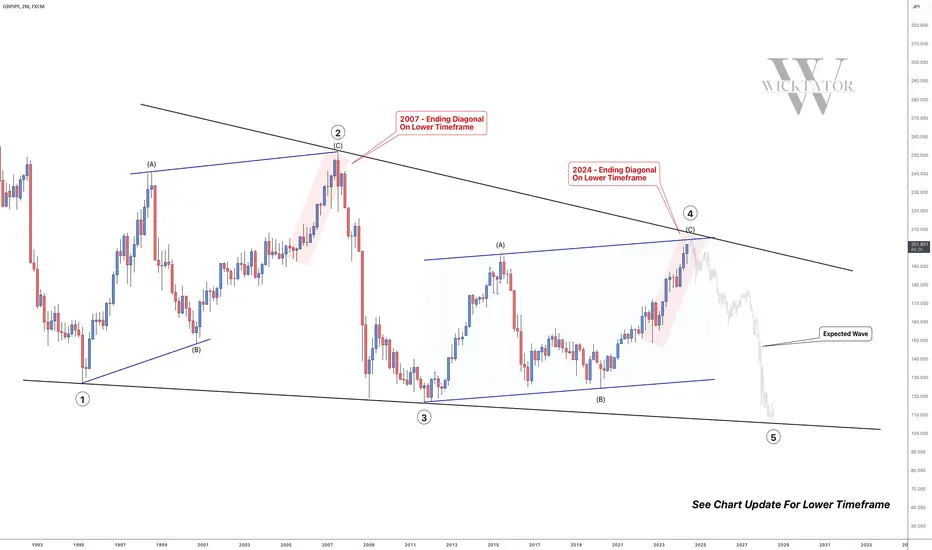
GBPJPY - Multi Year SHORTS Coming! (Over 10,000pips)Here we have the 2 month chart of GBPJPY. We can see that we're in a massive ending diagonal made up of 5 waves.
We are currently on wave 4 and have almost completed. At the moment we are working within the parameters of a channel however we must be aware that we may exceed the channel. The channel is just there for us to use as a guideline.
In 2007, we have a really nice ending diagonal (expanding) before we made that ridiculous +13k pip drop.
See below for the 2D GBPJPY chart from 2007:
We can see that the lower timeframe diagonal broke down beautifully.
We are anticipating something similar this time round!
See below for the 2D GBPJPY chart of the current diagonal:
We've got an almost identical price action as 2007. We just got to wait a little and watch for the break of the red trendline and enter and hold.
See below for the 2week chart of GBPJPY:
Trade Idea:
- Watch for a break of the ending diagonal
- Alternatively, you can wait for a pullback after the ending diagonal breaks
- stop loss above highs once entry trendline breaks
- Swing Target: 100 (10,000pips)
What do you guys think?
Goodluck and as always, trade safe!
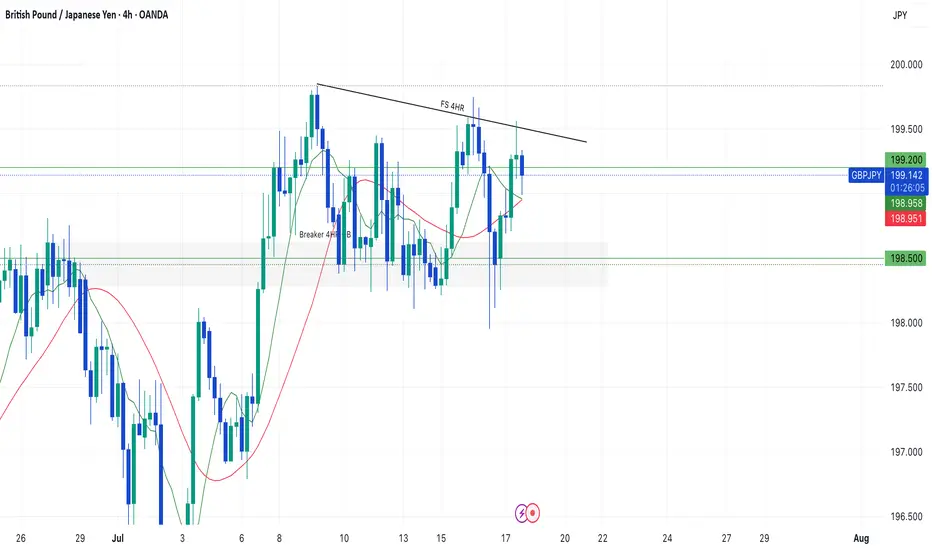
Waiting for the bigger move with GBPJPYHi Traders!
Right now, GJ is failing to swing higher at a major resistance at 199.200. Looking at the 4HR, yesterday July 16th, price wicked down to 198.000 retesting a previous 4HR CHOCH, then pulling back up to continue consolidation in between 198.000 and 199.200. However, on the 4HR price didn't close below 198.000 with continuation, which would make me believe that if the new 4HR CHOCH is valid, eventually price will break through 199.200. This will require patience if I want a bigger move. A more conservative approach to this trade, for me, would be entering on the break with a retest/bounces off 199.200.
SL below a new HL, TP1: 201.000, Overall TP: 202.000.
In addition, the only way I would sell is if price broke down past 198.500/198.200, and kept rejecting. Then, I could see a downside. But, imo price action just it's giving that confirmation right now.
*DISCLAIMER: I am not a financial advisor. The ideas and trades I take on my page are for educational and entertainment purposes only. I'm just showing you guys how I trade. Remember, trading of any kind involves risk. Your investments are solely your responsibility and not mine.*
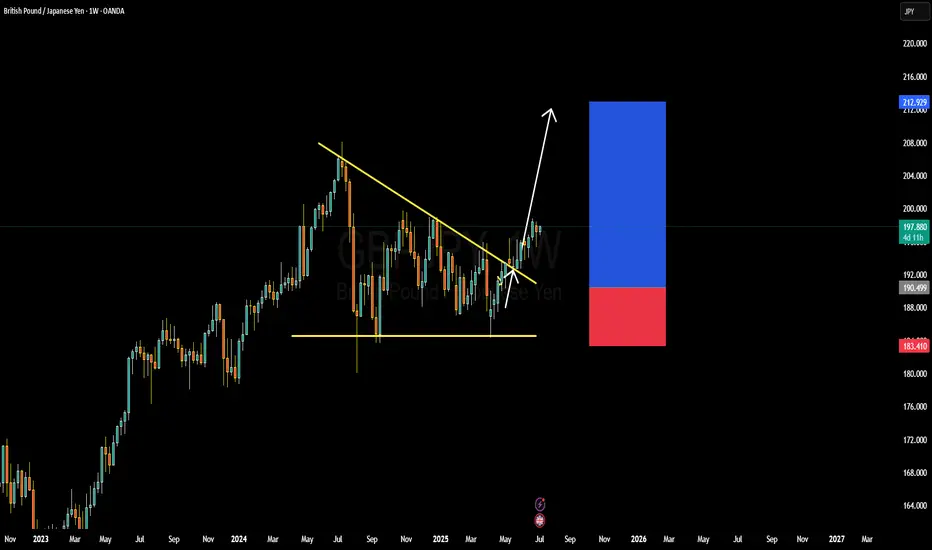
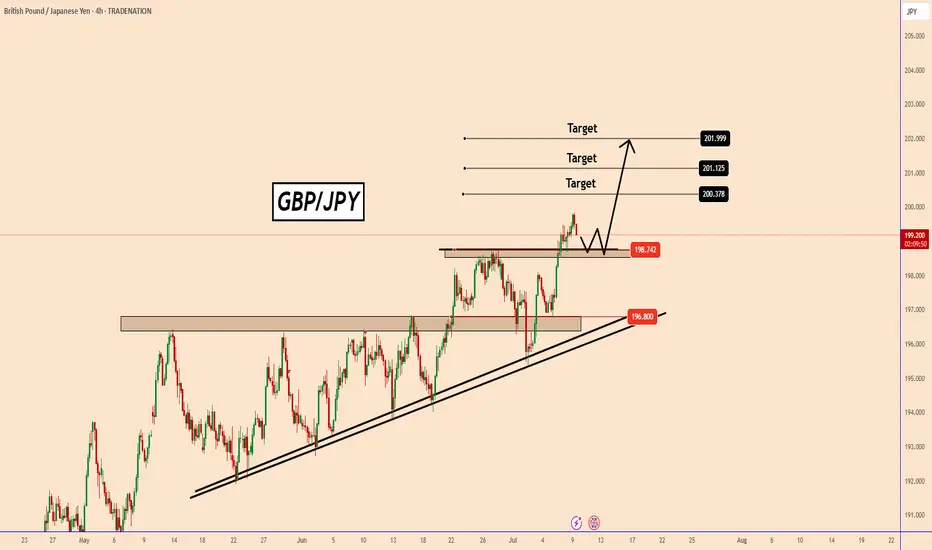
GBPJPY BULLISH OR BEARIS DETAILED ANALYSISGBPJPY has successfully broken out of a long-term falling wedge on the weekly chart, and the bullish momentum is unfolding as expected. Price has rallied from 190.00 to the current 197.00 level, delivering solid profits from the breakout zone. This continuation setup is extremely strong, with the market respecting the wedge breakout structure and forming higher highs. As long as we hold above the 190.00 support, the bullish bias remains fully intact, with 205.00 as the next key upside target.
Fundamentally, the British pound remains well-supported due to the Bank of England’s hawkish stance. Despite softer inflation data, the BoE has signaled a cautious approach to rate cuts compared to other central banks, maintaining underlying GBP strength. On the other side, the Japanese yen continues to weaken as the Bank of Japan sticks with its ultra-loose monetary policy. Yen weakness is further fueled by rising US and UK bond yields, widening the yield differential and attracting carry trades into GBPJPY.
Technically, the breakout is unfolding with textbook precision. Price has cleared descending resistance, retested it, and is now building a new leg higher. The volume profile is supporting this bullish breakout, and market structure is confirming further upside. The 200.00 psychological level may act as a minor resistance, but once cleared, 205.00 is well within range and aligns with major Fibonacci extensions.
GBPJPY is also benefiting from increased volatility in risk-on sentiment, as equity markets remain firm and bond yields rise globally. Traders are favoring high-yielding currencies like GBP while shorting low-yielders like JPY. With the fundamentals and technicals now strongly aligned, this trade is well-positioned to deliver continued profits toward 205.00 and beyond.