GBPJPY: Strong Bullish Reversal from Demand ZoneGBPJPY has bounced sharply from a key demand zone, indicating renewed bullish momentum. The pair continues to follow the broader bullish bias in GBP crosses, with JPY weakness driven by the Bank of Japan's dovish policy stance.
Technical Analysis (4H Chart)
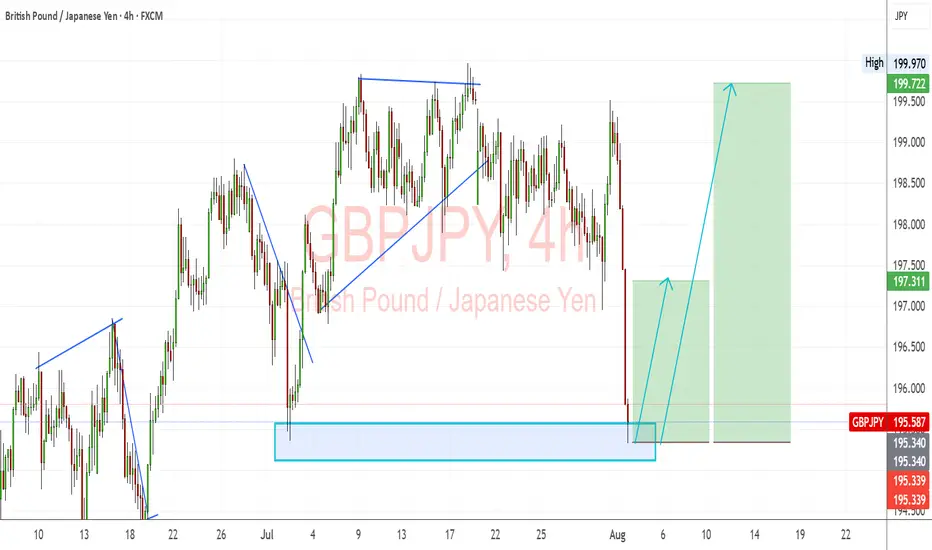
Pattern: Bullish rejection from the 195.30–195.50 demand zone.
Current Level: 195.58, rebounding from strong support, setting up for a potential upward leg.
Key Support Levels:
195.34 – immediate demand zone and critical support.
194.90 – deeper backup support if a pullback occurs.
Resistance Levels:
197.31 – near-term resistance and first upside target.
199.72 – extended target if bullish continuation strengthens.
Projection: As long as 195.34 holds, GBP/JPY could push toward 197.31, with potential for 199.72 if GBP strength persists.
Fundamental Analysis
Bias: Bullish.
Key Fundamentals:
GBP: Supported by the BOE’s cautious but tight stance due to persistent inflation pressures.
JPY: Remains fundamentally weak, with the BoJ avoiding major policy tightening while intervention threats only provide short-term support.
Risk Sentiment: Mild risk-on conditions favor GBP over safe-haven JPY.
Risks:
BoJ FX intervention could temporarily strengthen JPY.
A dovish BOE shift could slow GBP momentum.
Key Events:
BOE policy updates and UK CPI.
BoJ commentary and risk sentiment indicators.
Leader/Lagger Dynamics
GBP/JPY is a leader among JPY pairs due to GBP’s volatility and strength. It often outpaces EUR/JPY and CHF/JPY, making it a key pair for JPY sentiment shifts.
Summary: Bias and Watchpoints
GBP/JPY is bullish, with price rebounding from the 195.34 demand zone. Upside targets are 197.31 and 199.72. Watch for BOE communication, BoJ intervention signals, and global risk sentiment for confirmation of the move.
GBPJPY trade ideas
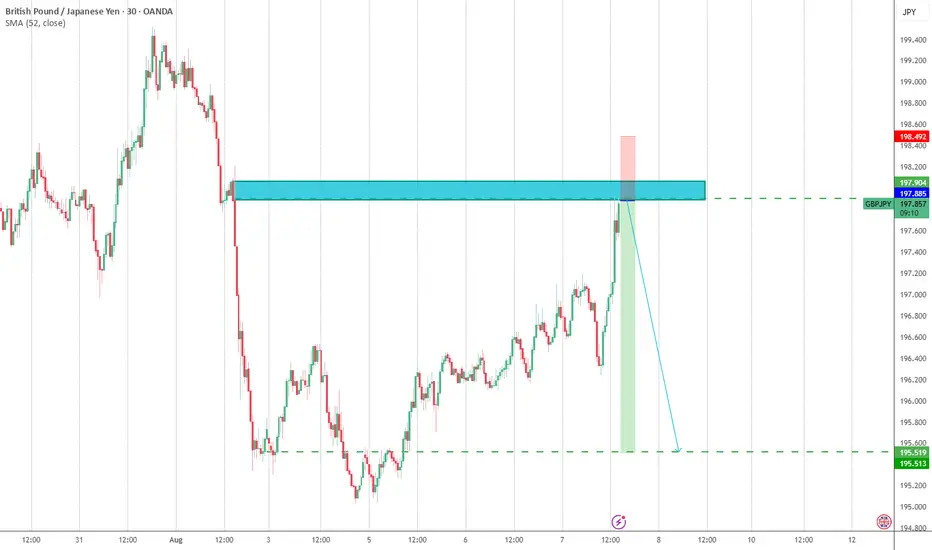
GBPJPY Sell Setup from Two Key Levels!Hey friends 👋
Here’s my carefully prepared GBPJPY analysis, just for you 📊
In this setup, I’ll be opening sell positions from two key levels:
1️⃣ 197.477
2️⃣ 198.100
My target level is: 🎯 195.560
Every single like you give truly fuels my motivation to keep sharing these insights.
Huge thanks to everyone who supports and encourages me with their likes 🙏

GBPJPY: More Growth is Coming! 🇬🇧🇯🇵
GBPJPY will likely bounce from a key daily support,
following a formation of a double bottom pattern
on an hourly time frame.
I think that the price will reach 196.7 level soon.
❤️Please, support my work with like, thank you!❤️
I am part of Trade Nation's Influencer program and receive a monthly fee for using their TradingView charts in my analysis.

GBPJPY : Short-Term Bullish SetupGBPJPY – Short-Term Bullish Setup
GBPJPY has just broken above a minor resistance zone, signaling a shift in short-term momentum.
The previous 1-hour candle closed strong and bullish, suggesting that the pair could continue gaining strength in the next few hours.
This move appears to be driven mainly by market speculation and ongoing tariff discussions, adding fuel to the bullish outlook.
Key levels to watch:
196.05
196.45
197.00
You may find more details in the chart!
Thank you and Good Luck!
PS: Please support with a like or comment if you find this analysis useful for your trading day
Disclosure: I am part of Trade Nation's Influencer program and receive a monthly fee for using their TradingView charts in my analysis.

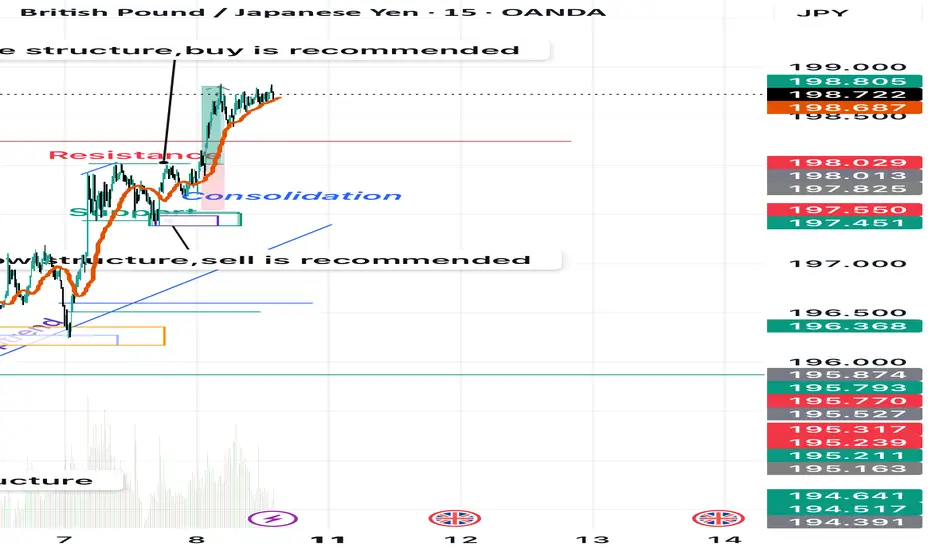
Market Structure Analysis of GBPJPY on the 4H TimeframeMulti-Timeframe Context (HTF: 4H, LTF: M15)
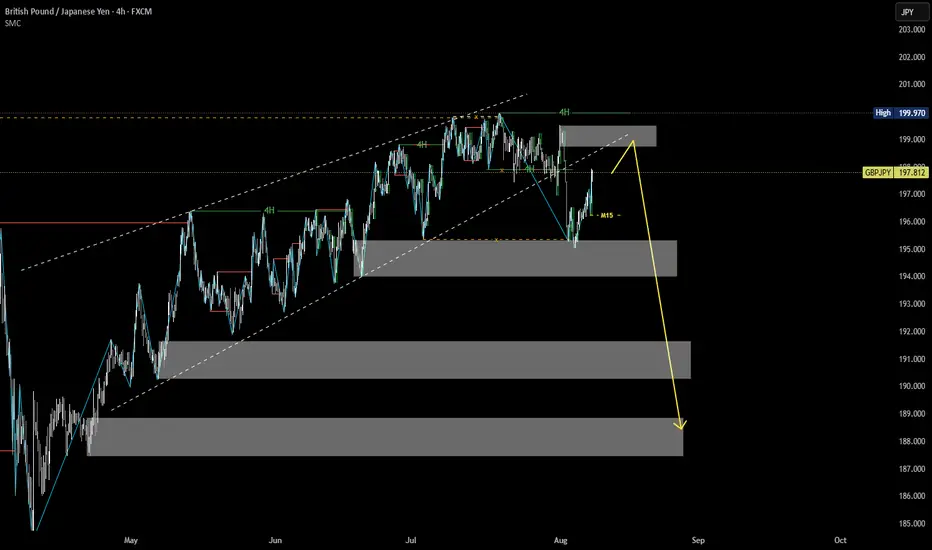
The main trend on the 4H chart is bearish.
Price is currently in a retracement phase (pullback).
On the M15, price is in a bullish short-term structure.
We monitor the M15 market structure closely to look for signs of weakness and identify high-probability short entries in alignment with the 4H downtrend.
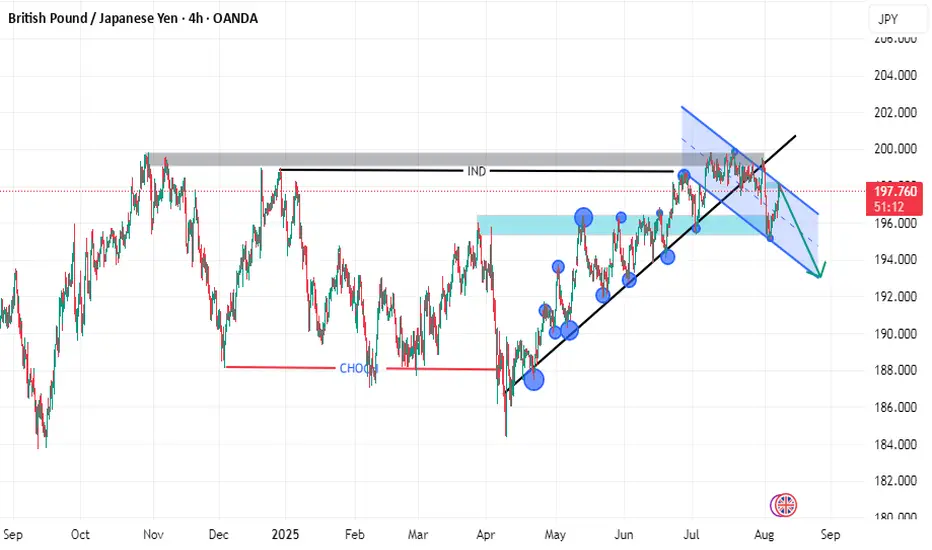
GJ| Bullish Outlook | IDM + SSL Sweep - OB Reaction(Refined & Structured):
• Pair: GBPJPY
• Bias: Bullish
• 4H Overview: Price broke major highs with bullish structure still intact. After pulling back into discounted territory, I dropped to mid timeframes to anticipate continuation.
• 30M Structure: Price took out sell-side liquidity and IDM, then mitigated a clean internal order block. Structure is refined and showing signs of smart money activity.
• Entry Zone: Watching LTFs for a clean change of character off fresh demand zones.
• Targets: 5M and 30M structural highs depending on delivery.
• Mindset Note: Patience wins here. When structure and liquidity align this clean, all that’s left is letting LTF confirm it. No need to chase—let the setup speak first.

GBP/JPY - Full Trade Plan📉 GBP/JPY Short Setup – Structure Cracking Below
Pair: GBP/JPY
Timeframe: 4H / Daily
Bias: Bearish
Entry Zone: 196.900 - 197.100 (71% + EMA Retest)
Target Zones:
🔹 TP1: 195.00
🔹 TP2: 190.00 (W-Target)
🧠 Technical Breakdown:
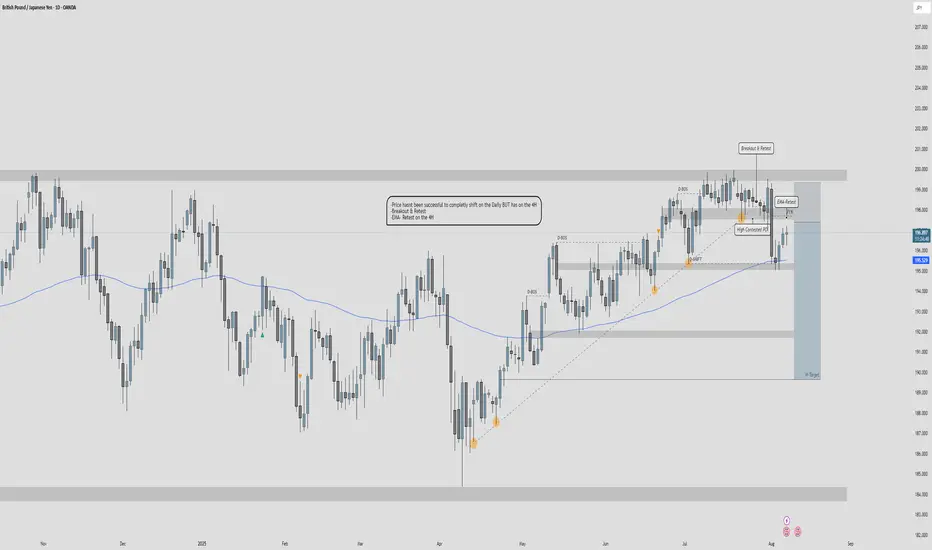
✅ 4H Structure Shift Confirmed
Price has broken and shifted structure on the 4H timeframe.
Multiple BOS (Breaks of Structure) confirm a weakening bullish trend.
✅ Daily Still Holding – But Weak
Daily structure hasn't fully flipped yet, but bullish pressure is cracking.
This gives us a high-risk-reward opportunity before full higher-timeframe confirmation.
✅ Breakout & Retest + 71% Retracement
Classic breakout and retest pattern from the high.
Price has pulled back into the 71% Fib level, providing a premium entry.
✅ Retest of EMA + Contested POI
Price also tested the 4H EMA, acting as dynamic resistance.
This zone overlaps with a previous point of interest (POI) – heavy confluence for sell pressure.
📌 Sell Plan:
Sell Zone: 196.900 – 197.100 (watch for rejection candles or LTF structure breaks)
Stop Loss: Above the last swing high or EMA
Take Profits:
TP1: 195.00
TP2: 190.00 (Weekly Target)
⚠️ Risk Management
Only execute once LTF confirms entry (M15/M5 BOS or bearish engulfing rejection).
Position size with R:R in mind; this setup offers a potential 1:4+ move.
🗓️ Market Outlook:
GBP/JPY is showing early signs of rolling over. The 4H shift, combined with a premium retest and EMA rejection, creates a clean short window. Watch the daily close for full confirmation.
🔔 Like and follow for more clean smart money & structure-based setups.
GBPJPY - Catching The Falling Knife... ConservativelyDon't catch the falling knife! This is a common warning in the trading industry. Although i do agree with it (in some circumstances), I think what's more important is for us to perform analysis and be confident on where that knife may find a floor at.
In the case of the OANDA:GBPJPY I think we've seen that floor which may present us with the opportunity to but IF... I say if because simply making that prediction isn't enough. As a trade, what I want to see if some sort of signal from the market (while at that level) that price is more likely to do what I predict, than not.
If you have any questions, comments or want to share your views, please do so below. Also be sure to hit that like button & give me a follow, that way you don't miss my future trading ideas.
Akil

GBP/JPY Long Attack After MA Breakout – Loot the Beast!🔓 GBP/JPY Bullish Break-In Heist! 💷💣 Price Cracked the MA Vault 🎯
🏴☠️ Welcome to the GBP/JPY Treasure Run!
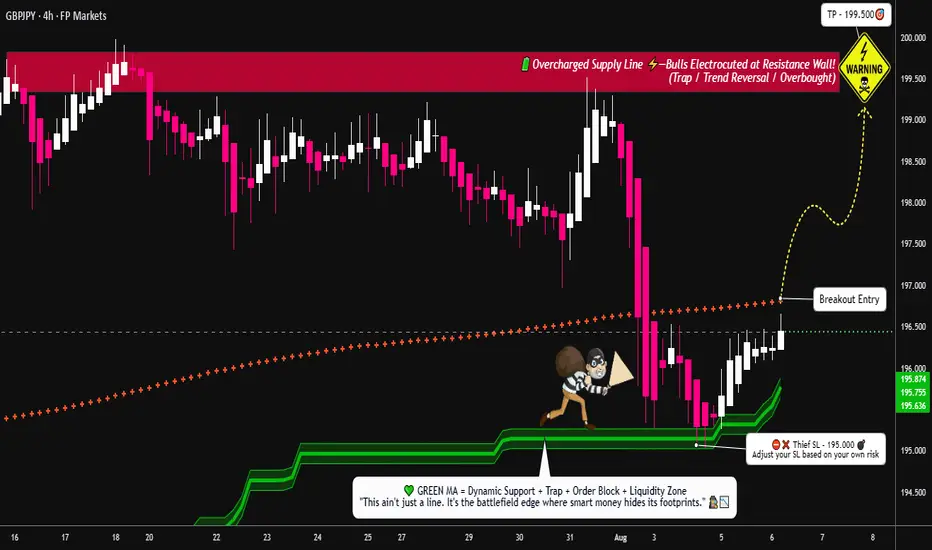
Thief Trader’s back in the FX vault—this time we’re after the Beast Pair. A clean moving average breakout just unlocked the vault at 196.900, and we’re going in heavy with layered long entries!
📈 Heist Blueprint:
Asset: GBP/JPY
🧭 Plan: Bullish (Price has broken key MA level)
🎯 Entry: ANY price above 196.900 (after MA breakout confirmation)
📉 Stop Loss: 195.000 (secure the backdoor)
💰 Target: 199.500 (clean getaway zone)
🔫 Entry Method: Limit orders stacked like trapdoors — Thief’s layering strategy in motion!
💼 Strategy Breakdown:
⚔️ Scalp Raiders: Snipe quick profits on the M15-M30 pullbacks.
🛡 Swing Bandits: Ride this bullish wagon up to 199.500. Use trailing SL to stay alive.
📡 Chart Radar: Eyes on volume spikes + MA alignment = green signal for aggressive buys.
🧠 Market Logic Behind the Heist:
🔥 MA breakout confirms buyer strength
🔍 Intermarket flow supports GBP dominance
📊 Sentiment & positioning flip to bullish
💼 Risk events priced in – no traps detected (yet)
🚨 Caution for Rookie Thieves:
News bombs ahead? Lock down with tighter SLs or pause the raid until the dust settles.
💎 Join the Crew of Chart Bandits!
👍 Like this plan? 🔁 Share it.
💬 Drop your view. 💣 Boost it with a 🚀
We're not just trading—we’re robbing the market with style.
🔐 Stay dangerous, stay profitable…
THIEF TRADER OUT. 🏴☠️📉📈
GBPJPY SELL SWEET SETUP SHOOOOOOOOOOOOORT HHHHHHHHHI think we should research selling opportunity
because we have uptrend line has broken and tested
and we have bearish channel and the price reflect from resistance on time frame 1W
SO SHORTLY i will sell Especially since we have a rebound from the imbalance as well.
Look at this picture as it makes it clearer to you
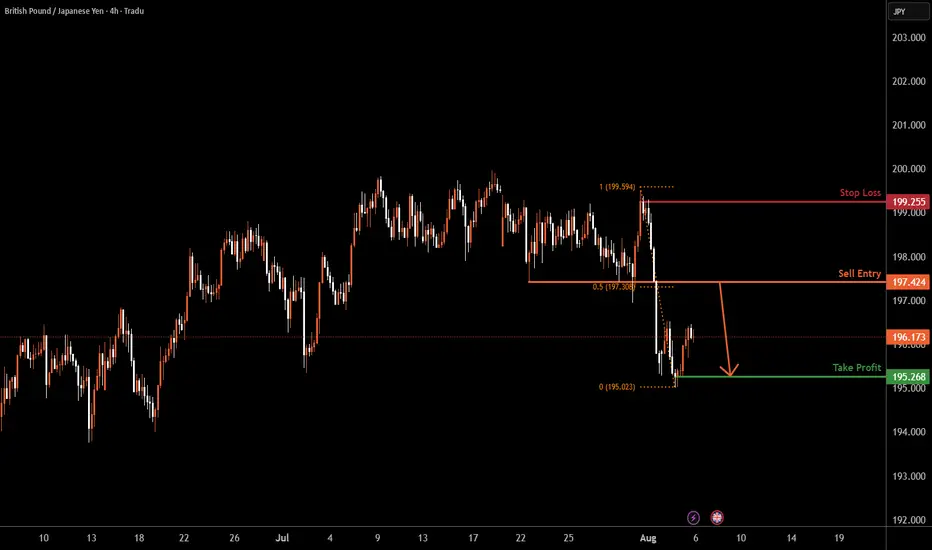
GBPJPY H4 | Heading into 50% Fibonacci resistanceGBP/JPY is rising towards the sell entry at 197.42, which has been identified as a pullback resistance that aligns with the 50% Fibonacci retracement and could reverse to the downside.
Stop loss is at 199.25, which is a swing high resistance.
Take profit is at 195.26, which is a swing low support.
High Risk Investment Warning
Trading Forex/CFDs on margin carries a high level of risk and may not be suitable for all investors. Leverage can work against you.
Stratos Markets Limited (tradu.com ):
CFDs are complex instruments and come with a high risk of losing money rapidly due to leverage. 65% of retail investor accounts lose money when trading CFDs with this provider. You should consider whether you understand how CFDs work and whether you can afford to take the high risk of losing your money.
Stratos Europe Ltd (tradu.com ):
CFDs are complex instruments and come with a high risk of losing money rapidly due to leverage. 66% of retail investor accounts lose money when trading CFDs with this provider. You should consider whether you understand how CFDs work and whether you can afford to take the high risk of losing your money.
Stratos Global LLC (tradu.com ):
Losses can exceed deposits.
Please be advised that the information presented on TradingView is provided to Tradu (‘Company’, ‘we’) by a third-party provider (‘TFA Global Pte Ltd’). Please be reminded that you are solely responsible for the trading decisions on your account. There is a very high degree of risk involved in trading. Any information and/or content is intended entirely for research, educational and informational purposes only and does not constitute investment or consultation advice or investment strategy. The information is not tailored to the investment needs of any specific person and therefore does not involve a consideration of any of the investment objectives, financial situation or needs of any viewer that may receive it. Kindly also note that past performance is not a reliable indicator of future results. Actual results may differ materially from those anticipated in forward-looking or past performance statements. We assume no liability as to the accuracy or completeness of any of the information and/or content provided herein and the Company cannot be held responsible for any omission, mistake nor for any loss or damage including without limitation to any loss of profit which may arise from reliance on any information supplied by TFA Global Pte Ltd.
The speaker(s) is neither an employee, agent nor representative of Tradu and is therefore acting independently. The opinions given are their own, constitute general market commentary, and do not constitute the opinion or advice of Tradu or any form of personal or investment advice. Tradu neither endorses nor guarantees offerings of third-party speakers, nor is Tradu responsible for the content, veracity or opinions of third-party speakers, presenters or participants.
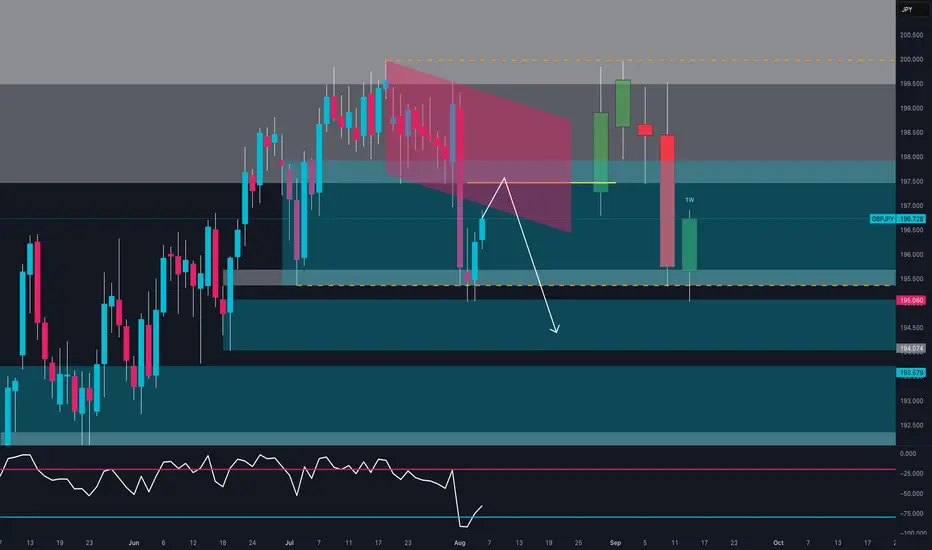
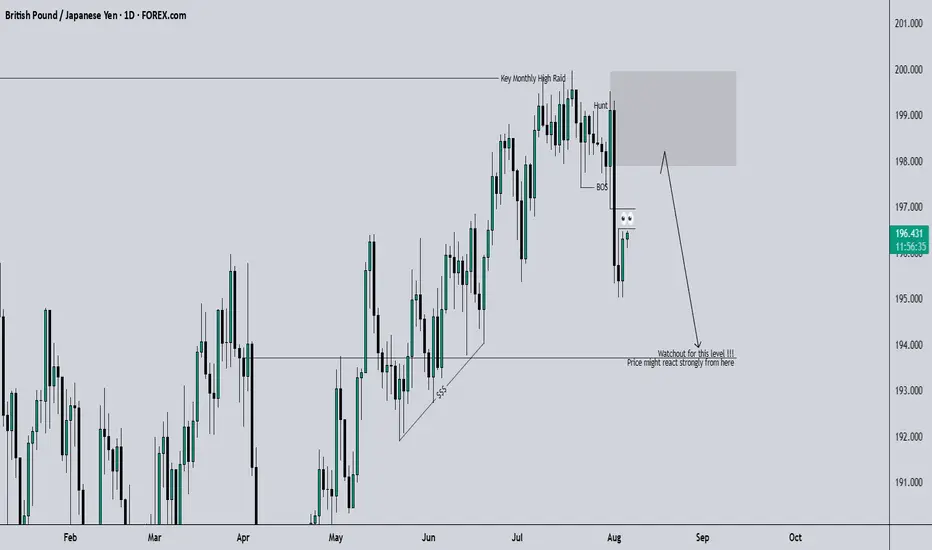
GBP/JPY Trap? Smart Money Might Be Setting Up the Next Drop📊 1. Technical Overview
Price broke the bullish structure decisively, closing below a key demand zone between 195.00–196.00, leaving a large unfilled imbalance.
Last week's recovery candle suggests a potential pullback toward 197.40–197.80, now acting as a resistance confluence.
The descending channel and weak RSI further support a continuation of the bearish trend.
Bearish targets: 193.50 and 192.20
📈 2. COT (Commitment of Traders) Report
GBP:
Non-commercials are cutting long positions (–5,961) and adding shorts (+6,637) → Bearish divergence developing on GBP.
JPY:
Non-commercials are heavily increasing short exposure (+15,113), but remain strongly net-long overall, indicating a potential exhaustion of bullish JPY positioning.
💭 3. Retail Sentiment
Positioning is neutral: 51% long / 49% short.
This balance suggests no excessive retail bias, leaving room for directional moves without immediate contrarian pressure.
📆 4. Seasonality
August is historically bearish for GBP/JPY:
• –2.82% (20Y average)
• –3.04% (15Y average)
• –1.44% (5Y average)
The data shows a consistent historical bias to the downside during this month.
🎯 5. Strategic Outlook
• Primary Bias: Bearish below 197.40–197.80
• Invalidation: Weekly close above 198.10
• Targets: 195.00 > 193.50 > 192.20
The confluence of technical rejection, bearish COT dynamics, neutral sentiment, and negative seasonality supports a corrective scenario for August.
Trade Idea – GBPJPYBased on the daily market structure and Elliott Wave count, there’s potential for another bullish push to complete Wave 5.
However, on the H4 timeframe, price may still create one more lower low (LL) before confirming the upward move.
🔔 Wait for confirmation — either a break of structure or a bullish engulfing candle on the H1 timeframe before entering any buy positions.
#GBPJPY #ForexAnalysis #ElliottWave #Wave5Setup #UKTraders #USTraders #SwingTrading #PriceAction #ForexStrategy #H1Confirmation

GBP/JPY WEEKThis week in the markets was nothing short of amazing. I stayed sharp, made calculated moves, and turned challenges into opportunities. Every trade taught me something new, and I kept my focus steady even when the charts got wild. It felt good to see my strategy pay off and my confidence grow with every win. Overall, it was a powerful reminder that persistence, patience, and smart decisions can really make the difference. Ready to keep this momentum going! OANDA:GBPJPY
GBPJPYLet´s see if this up movement is only fake image of what the price needs to do.
For me till tomorrow afternoon the trend needs to be bearish.
Don´t put a big order.
You can see my account "passiveincomes" in signal start.
thks
blessings.
GBPJPY SWING: SHORT-TERM BEARISH OPPORTUNITYHi there,
Overall for the 3rd quarter of the year, I speculate a bullish candle close, however, for price to rally, it needs to trade lower to gather the needed liquidity. Hence, the short-term bearish move.
If you turn your chart to the 3M, you will see the wick of the last quarter's candle which translates to the Monthly OB that price is most likely to trade into after running multiple stops.
Check out my next post on CADJPY.
Cheers,
Jabari
GBP/JPY BULLS ARE GAINING STRENGTH|LONG
Hello, Friends!
Previous week’s red candle means that for us the GBP/JPY pair is in the downtrend. And the current movement leg was also down but the support line will be hit soon and lower BB band proximity will signal an oversold condition so we will go for a counter-trend long trade with the target being at 197.696.
Disclosure: I am part of Trade Nation's Influencer program and receive a monthly fee for using their TradingView charts in my analysis.
✅LIKE AND COMMENT MY IDEAS✅

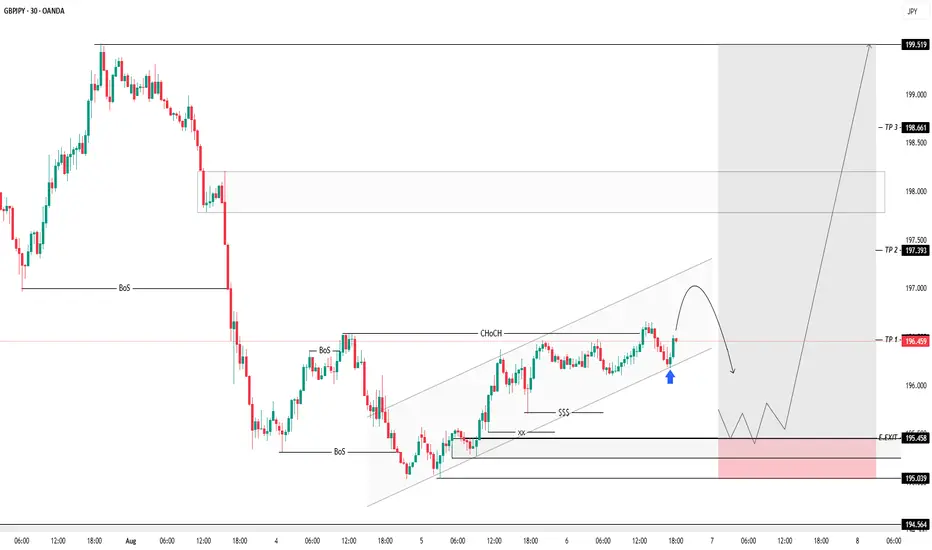
BUY ROAD MAP FOR GBPJPYGBPJPY Update
Price is respecting the bullish channel and reacted well from the internal structure (blue arrow 📍). Expecting a short-term pullback before continuation to higher targets.
🔽 TP Zone: 195.45
🔼 Final TP: 199.51
Watching price action closely around key demand zones.
GBPJPY Will Move Higher! Long!
Take a look at our analysis for GBPJPY.
Time Frame: 1h
Current Trend: Bullish
Sentiment: Oversold (based on 7-period RSI)
Forecast: Bullish
The market is approaching a key horizontal level 195.702.
Considering the today's price action, probabilities will be high to see a movement to 197.050.
P.S
Please, note that an oversold/overbought condition can last for a long time, and therefore being oversold/overbought doesn't mean a price rally will come soon, or at all.
Disclosure: I am part of Trade Nation's Influencer program and receive a monthly fee for using their TradingView charts in my analysis.
Like and subscribe and comment my ideas if you enjoy them!

GBP/JPY Stages Three-Day RallyGBP/JPY climbs to a fresh weekly high (197.93) as it stages a three-day rally, and a close above the 195.70 (61.8% Fibonacci extension) to 196.60 (23.6% Fibonacci extension) region may lead to a test of the July high (199.98).
A breach above 201.20 (23.6% Fibonacci retracement) opens up 202.00 (23.6% Fibonacci extension), but GBP/JPY may struggle to extend the recent series of higher highs and lows should fail to close above the 195.70 (61.8% Fibonacci extension) to 196.60 (23.6% Fibonacci extension) region.
A breach of the monthly low (195.04) may GBP/JPY toward the June low (192.73), with a move/close below the 192.40 (50% Fibonacci extension) to 193.50 (38.2% Fibonacci extension) zone opening up the May low (190.33).
--- Written by David Song, Senior Strategist at FOREX.com

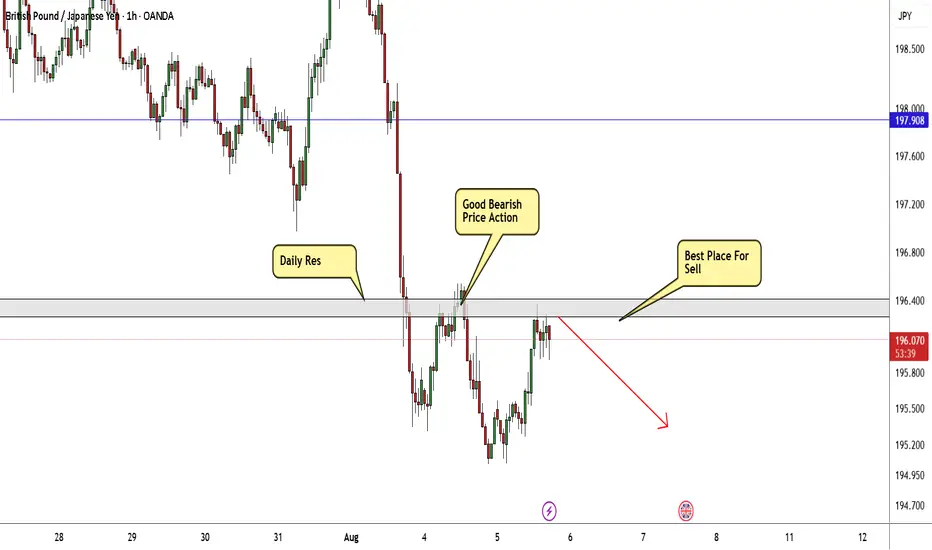
GBP/JPY Breakout Done , Short Setup Valid To Get 150 Pips !Here is my 1H Chart on GBP/JPY , We Have A Daily closure below my old support and new res and we have a very good bearish Price Action on 1 And 2 Hours T.F Also the price trying to retest the area now and giving a good bearish price action on smaller time frames , , So i see it`s a good chance to sell this pair and targeting 100 to 150 pips . and if we have a daily closure again above my new res then this idea will not be valid anymore .
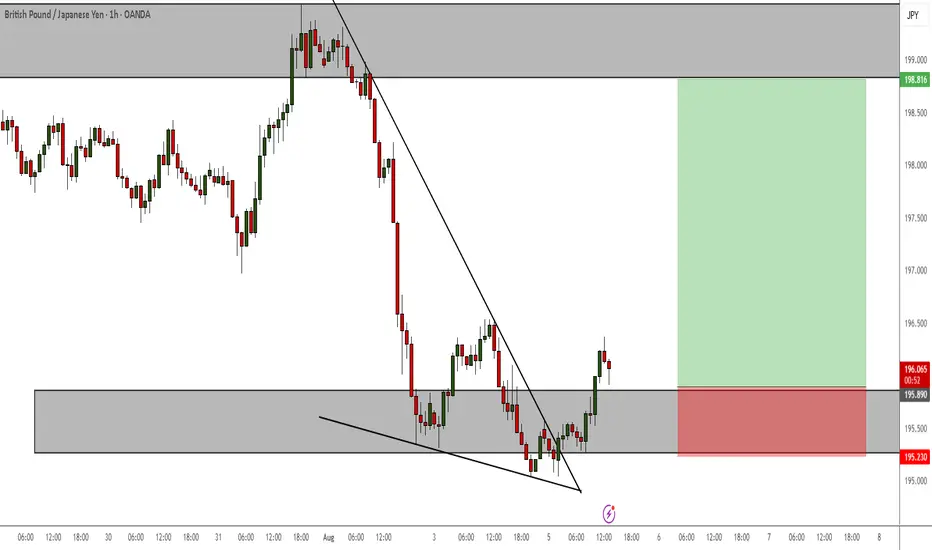
GBPJPY Falling Wedge - Bearish-to-bullish reversal patternI see a breakout and retest of a bullish confirmation pattern and price is showing strong rejections in the form of bullish hammers on H4 TF
GBPJPY ready to drop?GBPJPY has printed a weekly bearish engulfer with a cross over of a weekly doji and price rejected from a weekly and monthly resistance line. As price is rejecting from a very important monthly and weekly resistance level, it is highly likely price may continue to drop to weekly support level.
As 4H timeframe showing a strong head and shoulder with rejection below, we may see continuation with strong trend.
Upon price action confirmation, a sell trade is high probable.
