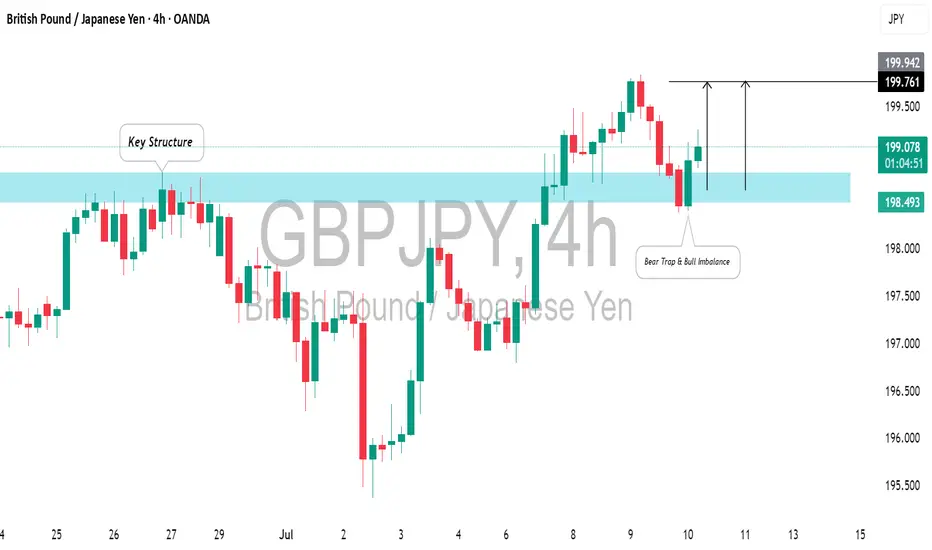
GBPJPY: Bullish Move From SupportGBPJPY may continue rising from the highlighted blue horizontal support level.
A brief liquidity spike below that, followed by a bullish imbalance candle on the 4-hour chart, supports this.
I anticipate a rise to 199.94.
GBPJPY trade ideas
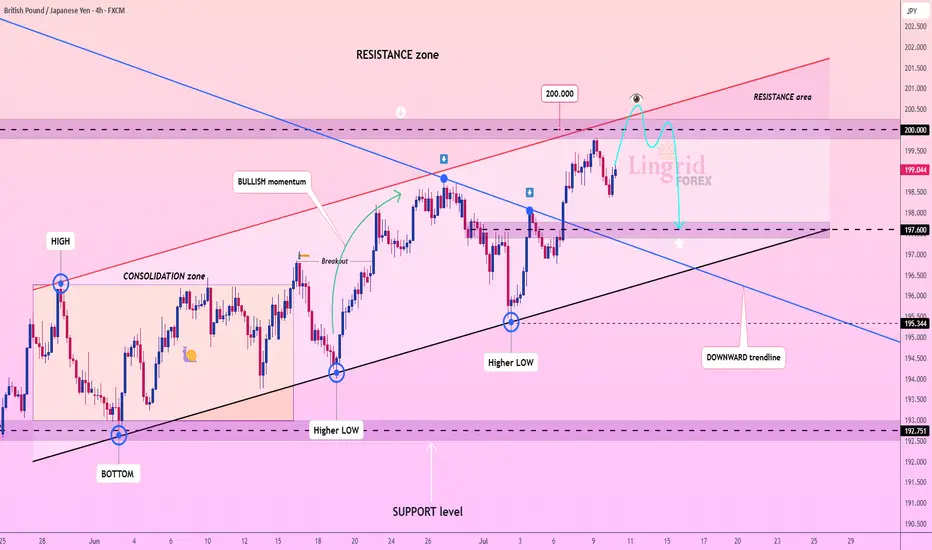
Lingrid | GBPJPY possible Pullback From Psychological LevelThe price perfectly fulfilled my last idea . FX:GBPJPY is testing the upper boundary of the resistance zone near the psychological 200.000 mark after a strong bullish impulse. Price is showing early signs of rejection from the red trendline and horizontal resistance, suggesting potential for a corrective move. If confirmed, a drop toward the 197.600–197.000 region becomes likely, aligning with the lower bound of the rising channel. A break below this level could expose deeper downside toward the 195.5 support.
📉 Key Levels
Sell trigger: confirmed rejection from 200.000 with bearish engulfing
Sell zone: 200.50–200.00 (key resistance zone and trendline touch)
Target: 197.600
Invalidation: sustained close above 200.500 flips structure bullish
💡 Risks
Strong bullish continuation above 200.000 would invalidate short setup
Yen weakness from BOJ policy shifts could drive GBPJPY higher
Support at 197.600 may cause bounce and false breakout scenarios
If this idea resonates with you or you have your own opinion, traders, hit the comments. I’m excited to read your thoughts!
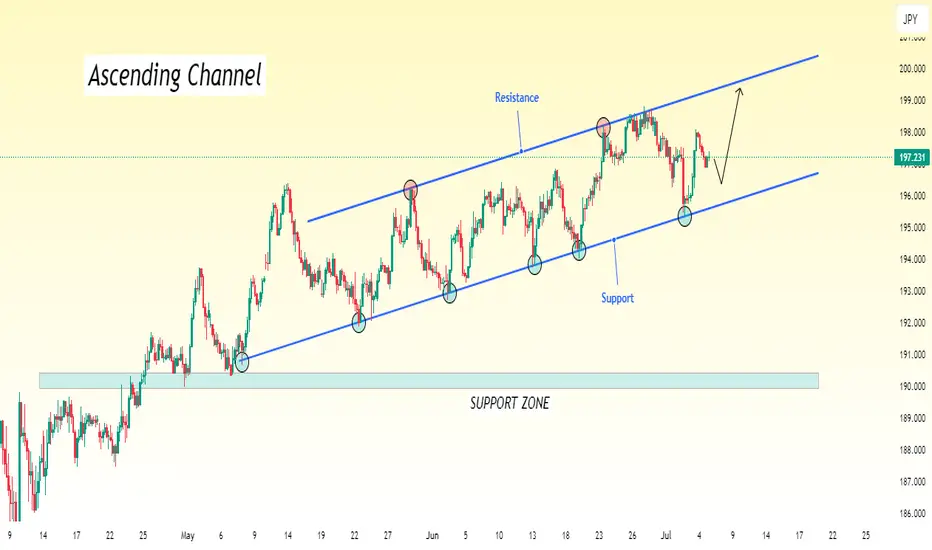
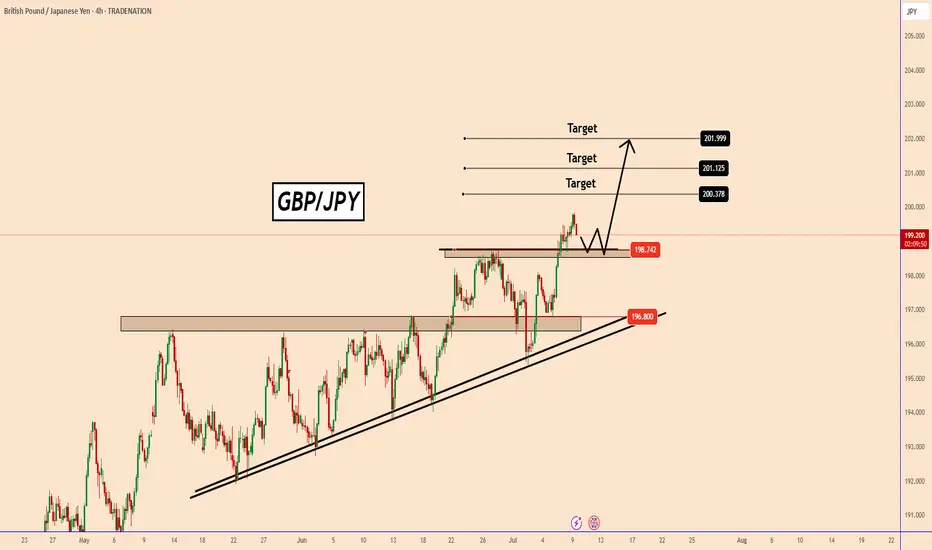
GBP/JPY Rising Within Ascending Channel – Target in SightGBP/JPY is currently moving within an ascending channel, where price action is forming higher highs and higher lows. This pattern indicates a steady uptrend.
At the moment, the pair is approaching the upper boundary (resistance line) of the channel. Based on the current momentum and structure, we expect the price to continue its upward movement and test the upper trendline.
This upper line serves as our near-term target, where we may look to take profit or reassess the trade setup. As long as the price remains within the channel and respects the trendline structure, the bullish bias remains intact.
GBPJPY Surges as Trade Tensions Weaken YenGBPJPY Surges as Trade Tensions Weaken Yen
GBPJPY remains firmly in a bullish trend, having broken through two key resistance levels.
The first breakout occurred at 196.80, followed by a decisive move above 198.75 on Monday, signaling accelerating bullish momentum.
On July 7, the White House issued a strong letter to Japan’s Prime Minister, expressing concerns over the trade deficit and announcing a 25% tariff on Japanese goods, effective August 1, 2025.
This development has added pressure on the yen, and the weakness could persist in the near term.
However, the situation is still unfolding. Trump is expected to send additional letters today, which could inject further volatility into the markets.
You may find more details in the chart!
Thank you and Good Luck!
PS: Please support with a like or comment if you find this analysis useful for your trading day
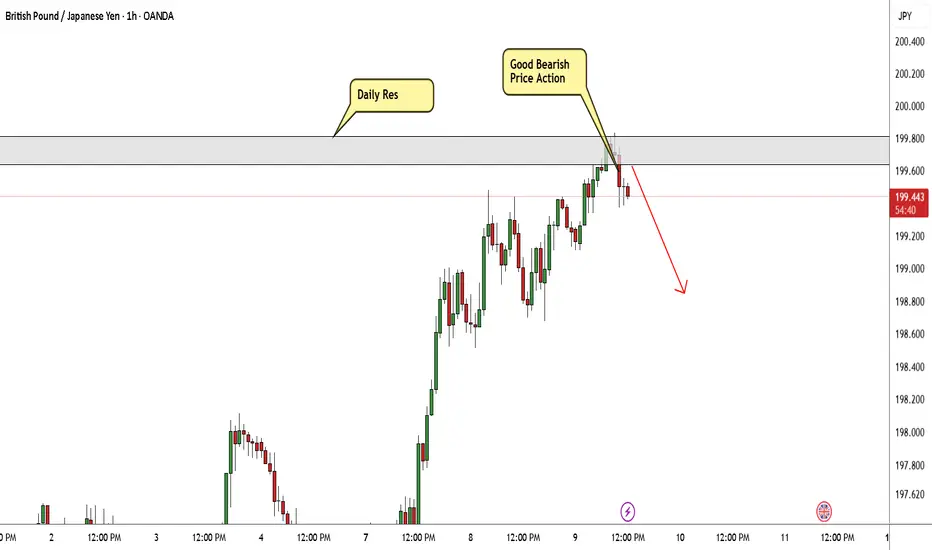
GBP/JPY At Selling Area , Can We Sell It Now To Get 150 Pips ?Here is my opinion on GBP/JPY , The price at daily res area that forced the price to go down very hard last time and now the price retesting it , i want to see a good bearish price action on 4H T.F To get A Confirmation to can sell and i feel safe , we can enter now a sell trade with small lot size and when we have a good confirmation on bigger T.F We can add another entry , if we have a daily closure above my daily res then this idea will not be valid .
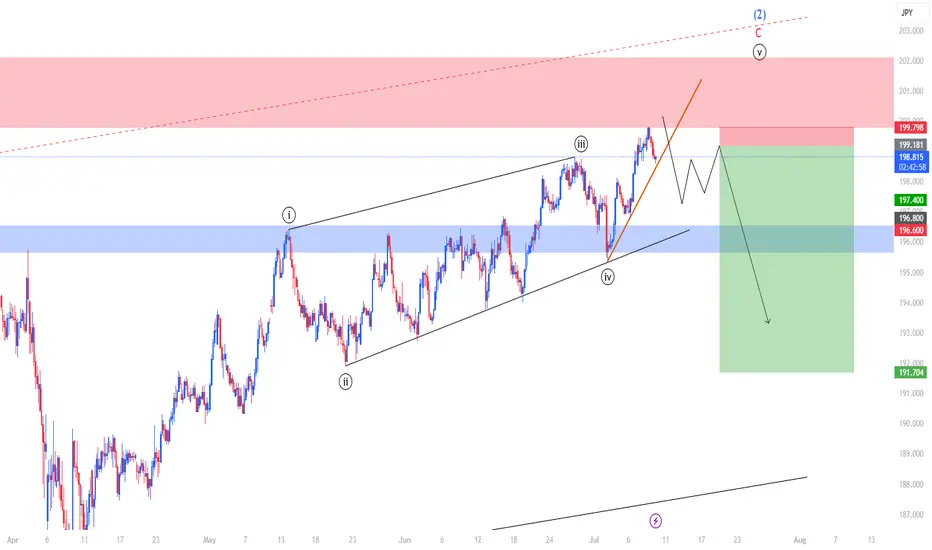
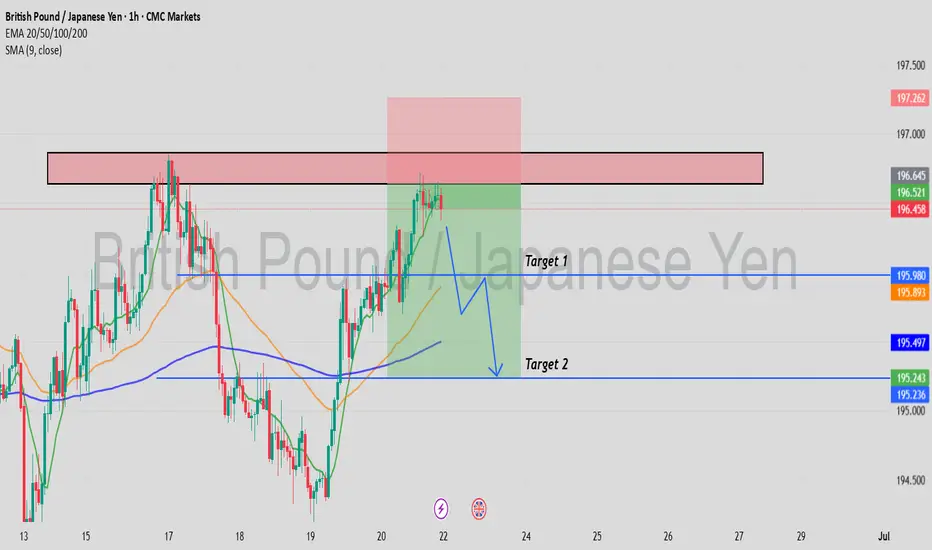
My View On GBP/JPYWhy I think the tops in
Elliott Wave Structure Completed
We’re now at the conclusion of a 5‑wave impulse (i→v) that tops off within wave (1), followed by an A‑B‑C corrective sequence. Wave C peaks right inside a major supply zone — classic exhaustion of bullish momentum.
Resistance & Trendline Rejection
Price hit a red supply/resistance area, tested it, and has already broken back below the short‑term upward trendline. That break is a reliable early signal that the uptrend is losing steam.
Bearish Continuation Pattern Forming
The drawn schematic suggests a sequence of lower highs is setting up—then a break toward the blue support zone near 196.60–197.40. All signs point to a deeper correction or even a fresh downtrend for wave (3).
Technical Confluence at Wave (2)
Wave (2) ends within multiple layers of resistance: a price zone, a wave count, and a rising wedge. Combined, this quadruple confluence is a textbook reversal scenario.
Macro factors support a top:
Central bank divergence is flattening
Yen may rebound on global uncertainty
Sterling faces domestic fragility
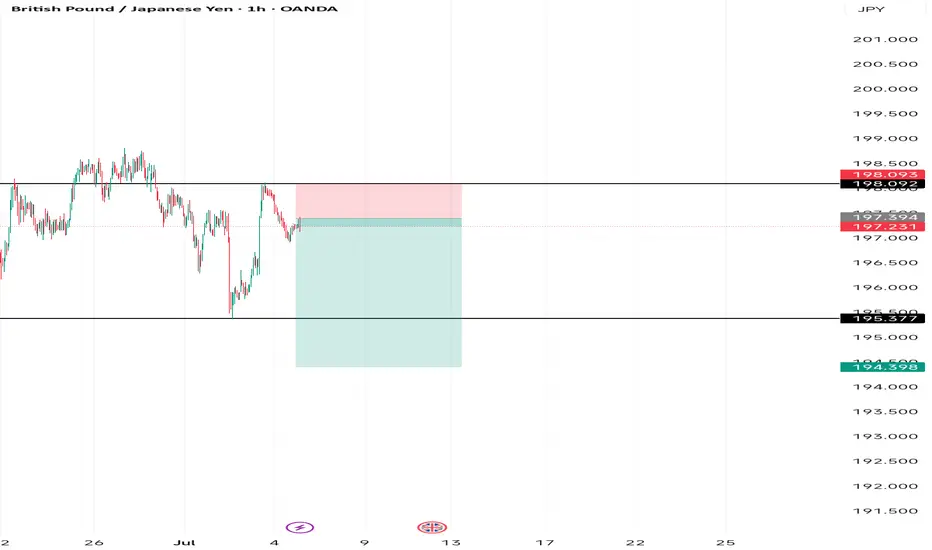
Shorty GbpJpyLook for liquidity sweep at the end of each trend
Mark your retracement zones
Use Fibonacci to find your sl and tp zones
Rule of your deposit
Try to set sl at 10% of your deposit
Use a reasonable lot size
AND MAKE A TRADE
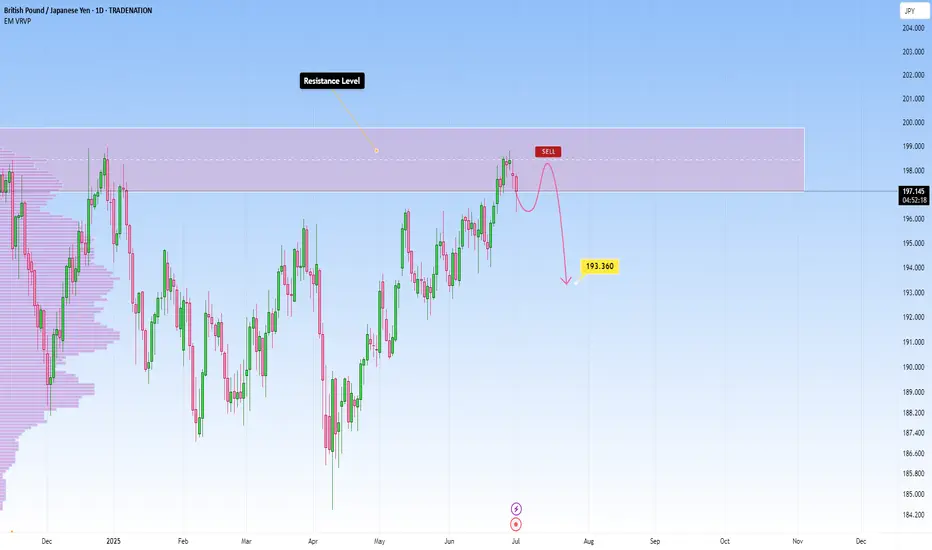
GBPJPY sitting at resistance – Is a drop to 193.360 likely?GBPJPY is sitting right at a key daily resistance zone. This is a level where it has struggled to break through and reversed strongly to the downside. So this makes it definitely one to monitor, especially if you’re eyeing potential short setups.
If we start seeing signs that the price is getting rejected here: like long wicks, strong bearish candles, it could be the early indication of another move lower. My focus is on a moderate drop toward the 193.360 area, similar to what we’ve seen in past pullbacks. Nothing too dramatic, just a simple downside play if sellers step in again.
But if we get a strong breakout? That changes everything: it would hint that bulls are taking full control. This area is pretty important and could give us a better idea of where price is headed next.
Just sharing my thoughts on support and resistance, this isn’t financial advice. Always confirm your setups and manage your risk properly.
Disclosure: I am part of Trade Nation's Influencer program and receive a monthly fee for using their TradingView charts in my analysis.
GBPJPY Breakout and Potential RetraceHey Traders, in the coming week we are monitoring GBPJPY for a buying opportunity around 196.600 zone, GBPJPY was trading in a downtrend and successfully managed to break it out. Currently is in a correction phase in which it is approaching the retrace area at 196.600 support and resistance zone.
Trade safe, Joe.
Will GBPJPY uptrend continue??Price is at a crucial point where traders are beginning to watch what’s likely to happen next in the market. Is market likely to continue to trade higher? From the technical standpoint, if price continues to rise and break the 200.000 level we will look for a buy opportunity in this market.
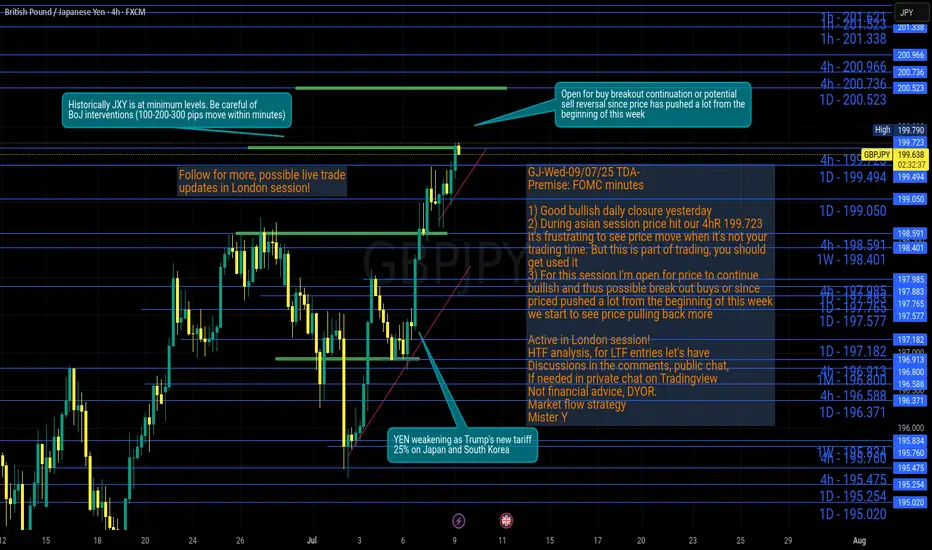
GJ-Wed-09/07/25 TDA-Asian push, price hit our 4hR 199.723Analysis done directly on the chart
Follow for more, possible live trades update!
I often share my live trades in Tradingview public chat in London session, stay tuned!
When you have a specific trading time during the day,
it's can be frustrating when moves happen outside of
your trading time. But remember this is part of the game,
we will never catch every single move on the chart.
Don't force the entries, learn to get used to it.
Premise:
A simple idea plan (like Tradingview public posts) won't describe everything.
No one can predict how market will move, it's always good to react to how it moves.
It gives an idea of how price might move, but no one come from FUTURE.
So I always encourage people to openly and actively discuss in real time.
For example discussing on Tradingview public chat (and more).
I don't give signals blindly, people should learn
and understand the skill.
Following blindly signals you won't know how to
manage the trade, where precisely put sl and tp,
lot size and replicate the move over time.
That's why you need active real time discussions.
Trading is not get rich quick scheme!
Active in London session!
Not financial advice, DYOR.
Market Flow Strategy
Mister Y
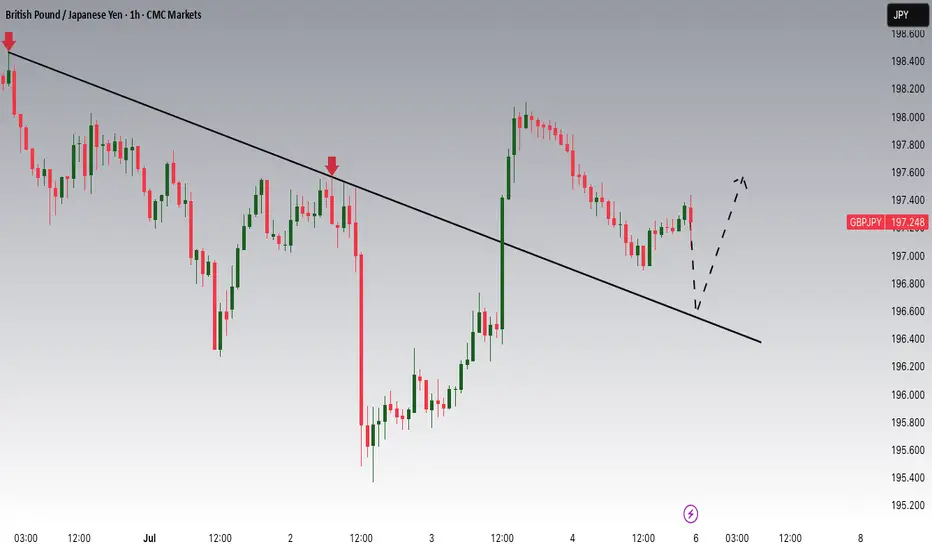
GBPJPY is in the Down Trend From Resistance LevelHello Traders
In This Chart GBPJPY HOURLY Forex Forecast By FOREX PLANET
today GBPJPY analysis 👆
🟢This Chart includes_ (GBPJPY market update)
🟢What is The Next Opportunity on GBPJPY Market
🟢how to Enter to the Valid Entry With Assurance Profit
This CHART is For Trader's that Want to Improve Their Technical Analysis Skills and Their Trading By Understanding How To Analyze The Market Using Multiple Timeframes and Understanding The Bigger Picture on the Charts
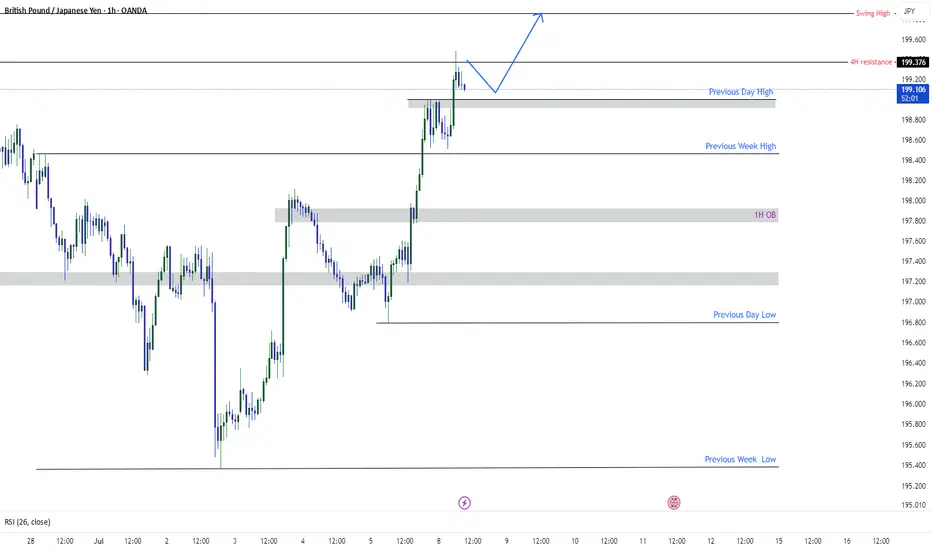
GBPJPY Targeting SwingGBPJPY has currently broken previous day high and wants to target the swing high which is 199.857 after retracing form previous 4H resistance GJ wants to travel to swing high. Chart is showing everything clearly. do not make things complex. Simplify as much as you can.
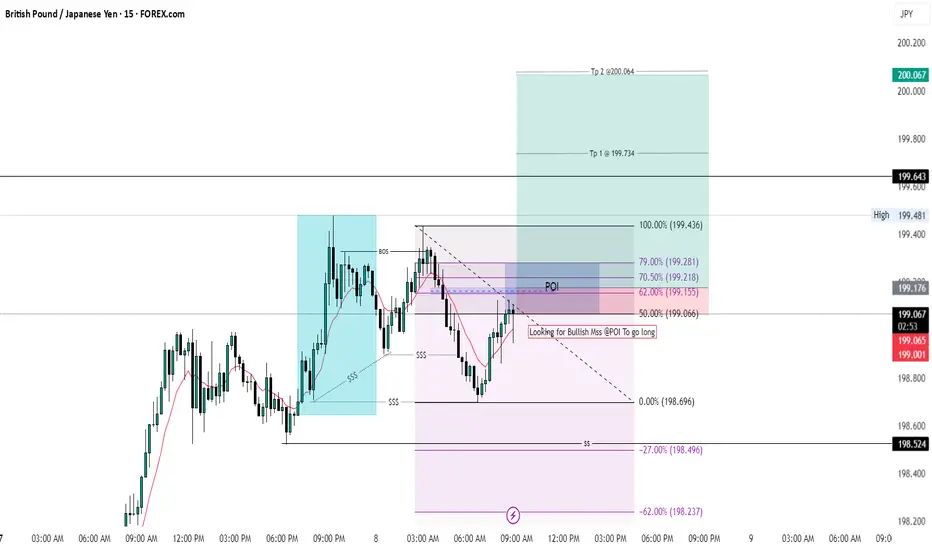
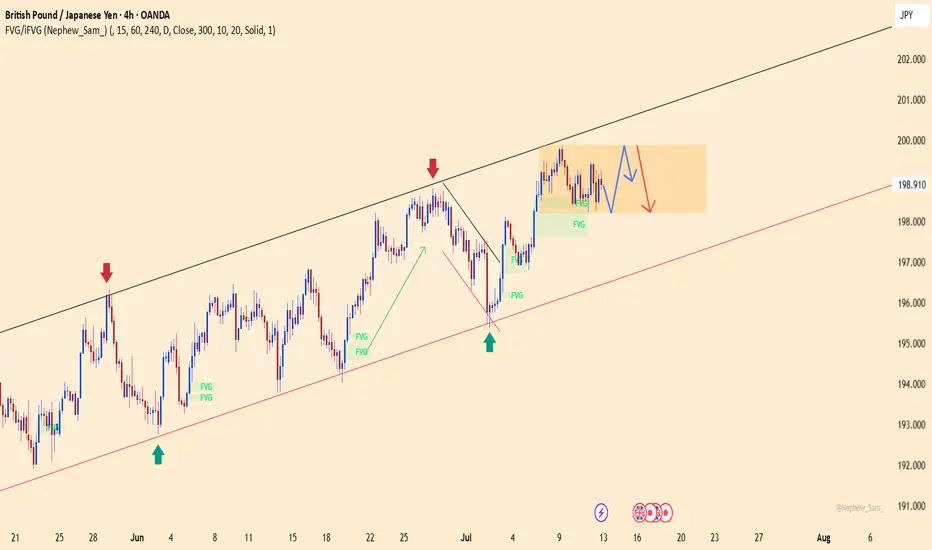
GJ BuysI'm waiting for that small FVG to be used as an iFVG — once that happens, I'll take my first entry on the retest.
Another entry will come from MSS on the lower time frame; if a swing low forms, that will also confirm another entry.
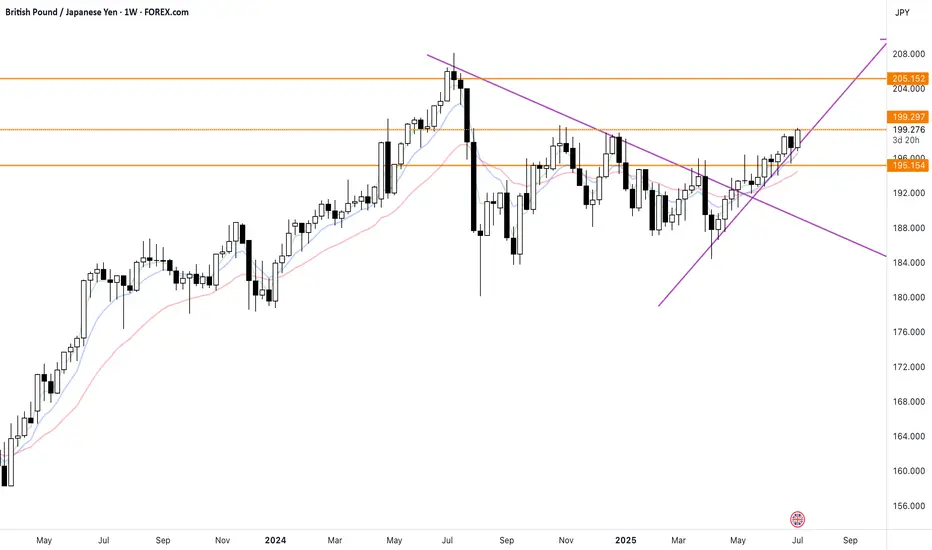
gbpjpy long outlookif anyone see any different lmk what you see. whati am seeing based off weekly chart is price breaking ristance asreas and moving on up to another ristsance zone. what do you guys think
?
Another Home Run Trade? Risky & Conservative ApproachesFollowing up a MASSIVE win on the OANDA:EURJPY we may now have a similar trading opportunity setting up on the OANDA:GBPJPY
The premise is the same for this one as we're looking at a potential violation of structure followed by a Bullish continuation setup.
In this video, we'll look at where we think price can extend to, what needs to happen before we can make that prediction, and both a risky and conservative technique to get involved in the move.
Please let me know how you would approach this setup!
Akil

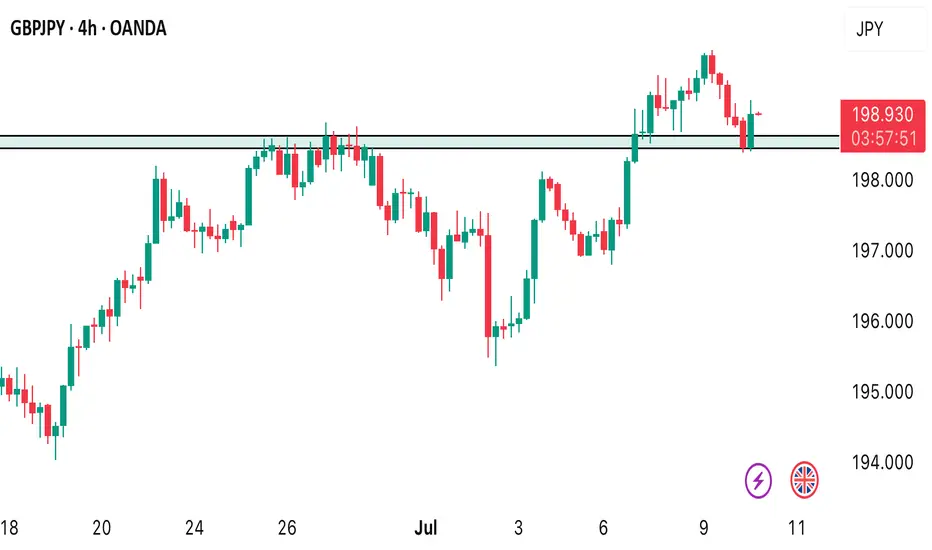
GBPJPY: floating at the top – is a drop being loaded?GBPJPY is hovering around 198.91 after an impressive rally, but now it's trapped between two key zones: 199.85 – a resistance level that keeps rejecting price, and 198.20 – a fragile support below. The price action reveals a tense sideways pattern, like a spring coiling up before release.
What’s concerning is that buyers have attempted to break above the high multiple times and failed – and each failure comes with weaker rebounds. With the Bank of England shifting toward a “pause” stance and the yen gaining mild support from rising risk-off sentiment, the market is starting to lean toward a correction.
If price breaks below 198.20, it could mark the beginning of a deeper slide back toward the lower boundary of the channel. Don’t be fooled by the silence – sometimes, calm is the precursor to a sharp fall.
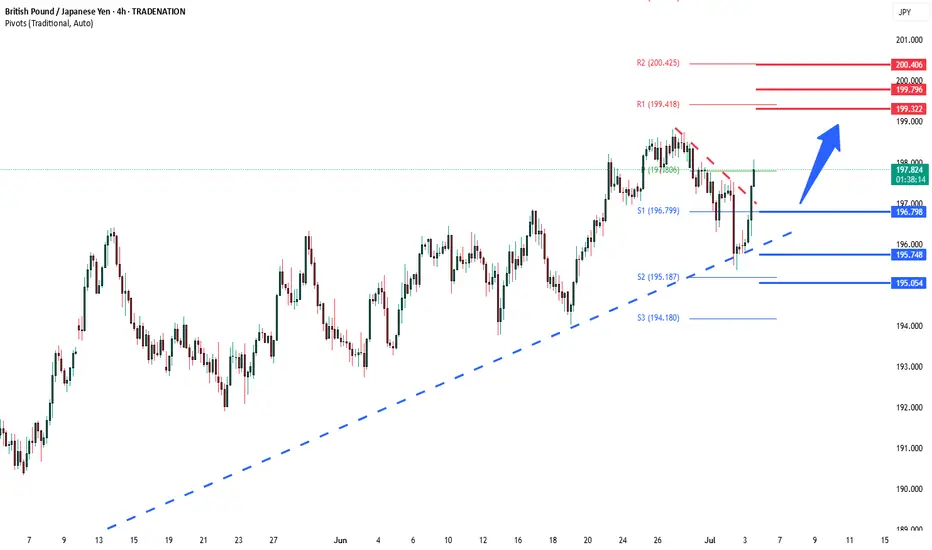
GBPJPY uptrend continuation breakoutKey Support: 196.75
This level marks the prior consolidation zone and serves as a critical pivot. A corrective pullback toward 196.75 followed by a bullish reversal would validate the uptrend, with upside targets at:
199.20 – Initial resistance and short-term target
199.70 – Minor resistance zone
200.40 – Longer-term breakout objective
However, a daily close below 196.75 would invalidate the bullish scenario, potentially triggering a deeper retracement toward:
195.80 – Near-term support
194.80 – Key downside level in a bearish reversal
Conclusion:
As long as 196.75 holds, the bias remains bullish, favoring continuation toward the 199–200 zone. A confirmed break below this support would shift momentum, opening the door for a broader corrective decline.
This communication is for informational purposes only and should not be viewed as any form of recommendation as to a particular course of action or as investment advice. It is not intended as an offer or solicitation for the purchase or sale of any financial instrument or as an official confirmation of any transaction. Opinions, estimates and assumptions expressed herein are made as of the date of this communication and are subject to change without notice. This communication has been prepared based upon information, including market prices, data and other information, believed to be reliable; however, Trade Nation does not warrant its completeness or accuracy. All market prices and market data contained in or attached to this communication are indicative and subject to change without notice.
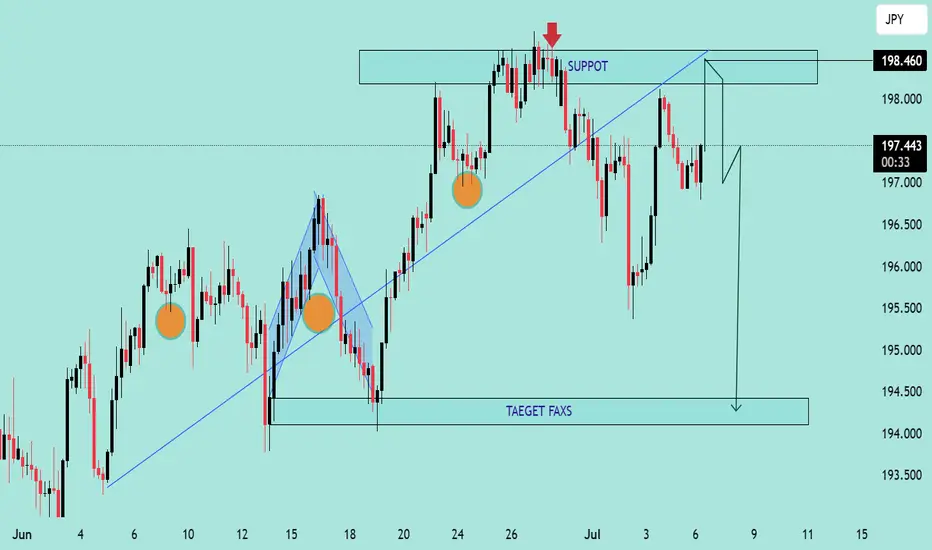
GBP/JPY Rejection from Resistance Zone GBP/JPY Rejection from Resistance Zone 🧱📌 | Bearish Setup In Play 🔻💹
📌 Technical Analysis Overview:
The chart illustrates a clear rejection from the resistance zone around 198.460, where previous price action formed a double-top pattern (🔴 red arrow). This suggests a strong supply area with selling pressure building.
🔍 Key Observations:
📏 Trendline Break:
The upward trendline (blue) has been decisively broken.
This break signals a loss of bullish momentum.
🧱 Resistance Zone @ 198.000–198.460:
Price tested this zone multiple times but failed to break above.
Acts now as a strong resistance zone.
🟠 Support Turned Resistance:
Former support has now turned into resistance (highlighted in blue text: "SUPPOT").
📉 Bearish Projection:
The projected path indicates a possible retest of the resistance zone before a sell-off continuation.
Target area: around 194.500, marked as “TAEGET FAXS” (typo: should be “TARGET ZONE”).
🔄 Possible Scenarios:
✅ Bearish Continuation:
If price rejects again near 198.000, expect a bearish move toward 194.500.
⚠️ Invalidation:
A strong breakout above 198.460 would invalidate the bearish thesis and may resume bullish momentum.
🔚 Conclusion:
The pair is currently under pressure with a confirmed break in trend structure. As long as price remains below 198.460, the bias remains bearish with a target toward the 194.500 zone. 📉👀
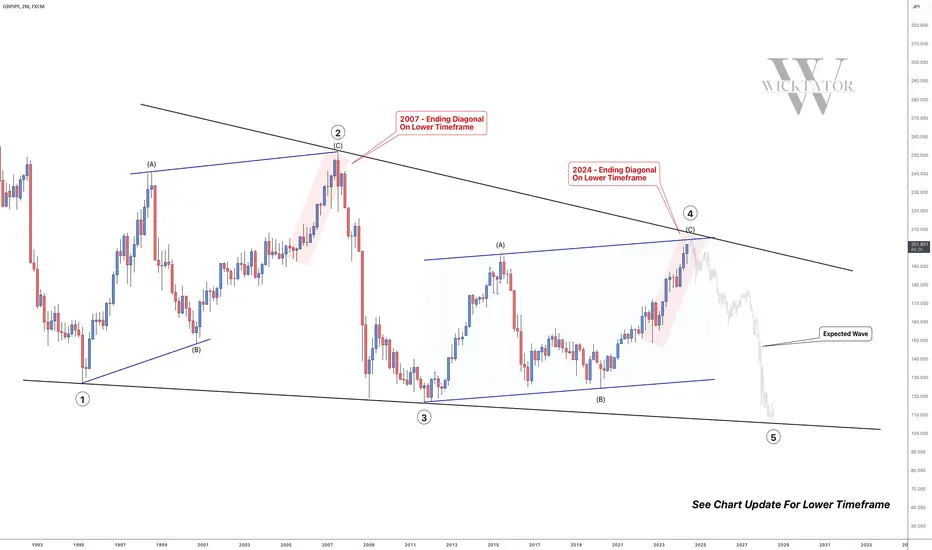
GBPJPY - Multi Year SHORTS Coming! (Over 10,000pips)Here we have the 2 month chart of GBPJPY. We can see that we're in a massive ending diagonal made up of 5 waves.
We are currently on wave 4 and have almost completed. At the moment we are working within the parameters of a channel however we must be aware that we may exceed the channel. The channel is just there for us to use as a guideline.
In 2007, we have a really nice ending diagonal (expanding) before we made that ridiculous +13k pip drop.
See below for the 2D GBPJPY chart from 2007:
We can see that the lower timeframe diagonal broke down beautifully.
We are anticipating something similar this time round!
See below for the 2D GBPJPY chart of the current diagonal:
We've got an almost identical price action as 2007. We just got to wait a little and watch for the break of the red trendline and enter and hold.
See below for the 2week chart of GBPJPY:
Trade Idea:
- Watch for a break of the ending diagonal
- Alternatively, you can wait for a pullback after the ending diagonal breaks
- stop loss above highs once entry trendline breaks
- Swing Target: 100 (10,000pips)
What do you guys think?
Goodluck and as always, trade safe!
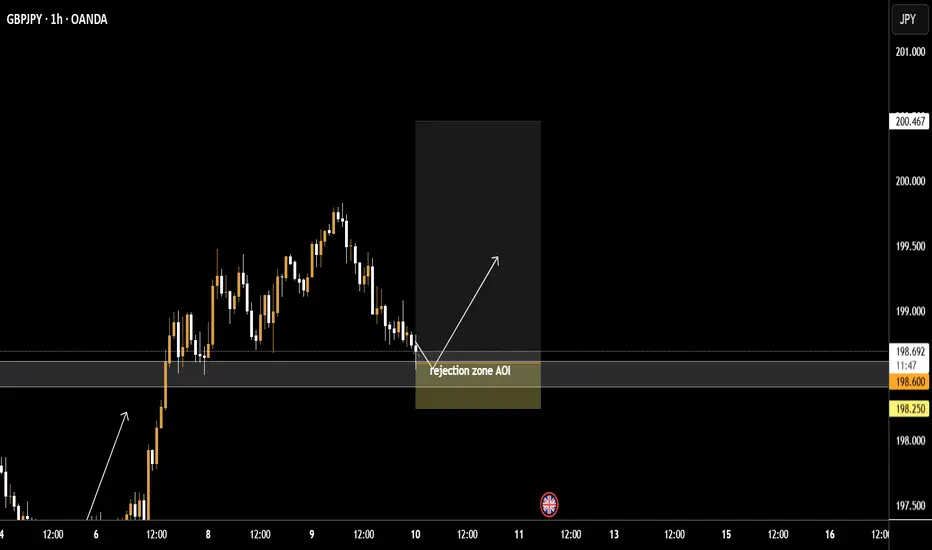
IDEA TRADE GBPJPY LONG POSITION Hi Traders
Pair: GBPJPY
📈 Position: LONG (BUY)
✅ Entry: 198.600
🔺 SL: 198.250 (-35 pips )
🎯 Take Profits:
• TP 1: 198.950
• TP 2: 199.300
• TP 3: 199.650 Trailing SL)
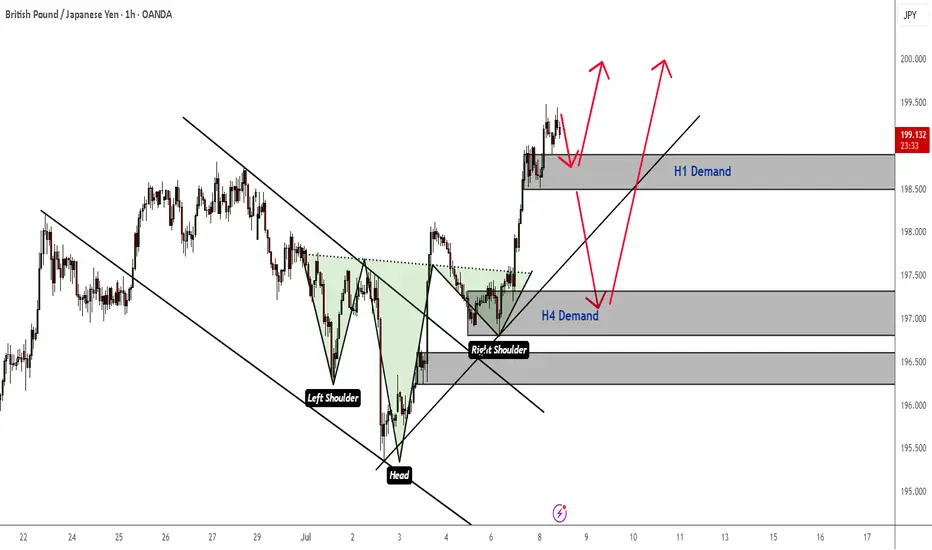
GBPJPY High Probability of a Bearish CorrectionThe trend is no doubt bullish here. But in the event that the current H1 demand is violated, there is a high probability of a retest or pullback to an H4 demand zone before the bullish trend resumes.