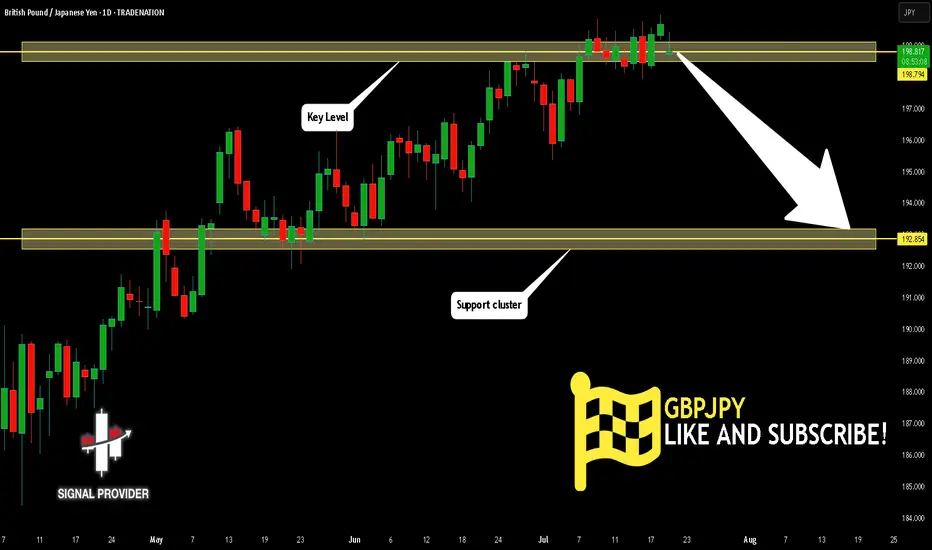
GBPJPY Is Bearish! Short!
Take a look at our analysis for GBPJPY.
Time Frame: 1D
Current Trend: Bearish
Sentiment: Overbought (based on 7-period RSI)
Forecast: Bearish
The price is testing a key resistance 198.794.
Taking into consideration the current market trend & overbought RSI, chances will be high to see a bearish movement to the downside at least to 192.854 level.
P.S
The term oversold refers to a condition where an asset has traded lower in price and has the potential for a price bounce.
Overbought refers to market scenarios where the instrument is traded considerably higher than its fair value. Overvaluation is caused by market sentiments when there is positive news.
Disclosure: I am part of Trade Nation's Influencer program and receive a monthly fee for using their TradingView charts in my analysis.
Like and subscribe and comment my ideas if you enjoy them!
GBPJPY trade ideas
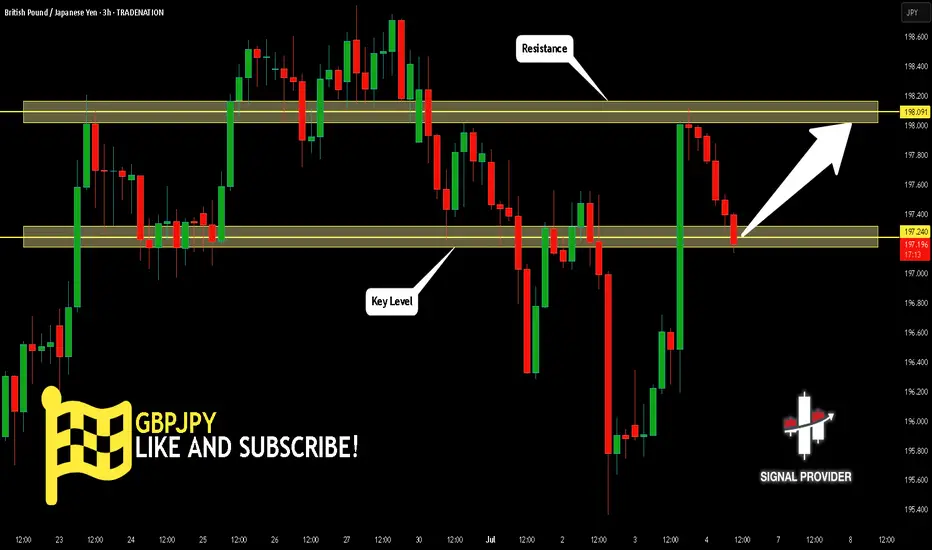
GBPJPY Will Go Up! Buy!
Please, check our technical outlook for GBPJPY.
Time Frame: 3h
Current Trend: Bullish
Sentiment: Oversold (based on 7-period RSI)
Forecast: Bullish
The market is approaching a key horizontal level 197.240.
Considering the today's price action, probabilities will be high to see a movement to 198.091.
P.S
Please, note that an oversold/overbought condition can last for a long time, and therefore being oversold/overbought doesn't mean a price rally will come soon, or at all.
Disclosure: I am part of Trade Nation's Influencer program and receive a monthly fee for using their TradingView charts in my analysis.
Like and subscribe and comment my ideas if you enjoy them!
GBP/JPY: A Key Short Setup Forms as Momentum FadesHello traders,
Taking a look at GBP/JPY on the 4-hour timeframe. After a significant run, the price action has stalled, and we're seeing clear signs of fading momentum. This is creating a well-defined consolidation zone, which may present a key opportunity for a short position.
The Technical Picture 📊
1️⃣ Price Consolidation: GBP/JPY is currently trading sideways within a tight range, highlighted on the chart. This period of indecision and balance between buyers and sellers often precedes a significant directional move. The structure suggests a phase of distribution may be underway.
2️⃣ Fading Momentum: The Relative Strength Index (RSI) confirms this loss of momentum. A sustained reading below the 50 midline would signal that sellers are beginning to gain control and that the path of least resistance is shifting to the downside.
The Strategy 🧠
The core idea is to anticipate a bearish breakdown from the identified consolidation zone. A clean break and hold below this range would serve as confirmation that sellers have taken over, providing an opportunity to enter a short position targeting a continuation of the larger bearish move.
Trade Parameters 📉
👉 Entry: 198.895
⛔️ Stop Loss: 201.405
🎯 Take Profit: 192.872
Risk/Reward Ratio: approx. 2.4
This is my personal analysis and perspective, not financial advice. Always conduct your own research and manage your risk accordingly.
Good luck, and trade safe.

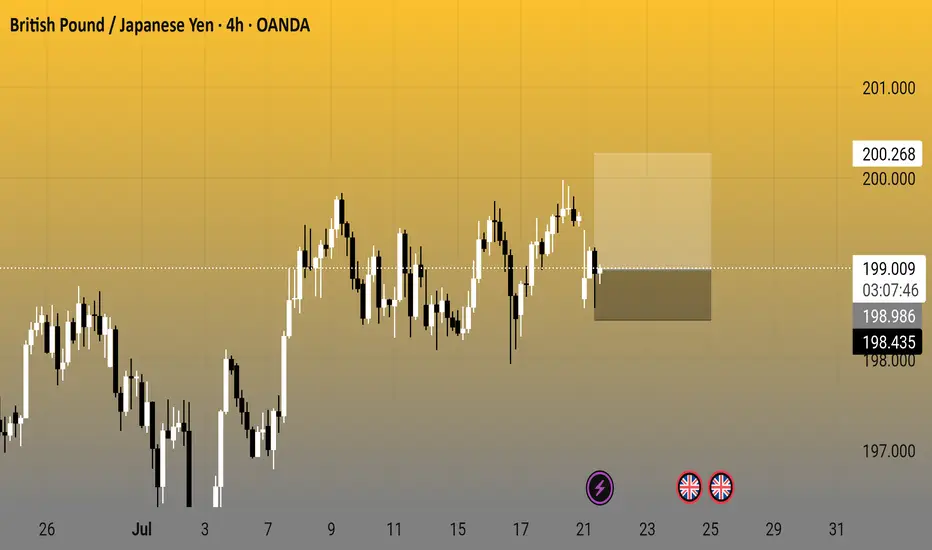
British Pound / Japanese Yen - 4h (OANDA)4-hour candlestick chart from OANDA shows the GBP/JPY currency pair's price movement, currently at 199.038 with a decrease of 0.542 (-0.27%). The chart highlights a recent consolidation phase around the 199-200 range, with key levels marked at 201.000, 200.268, 199.038, 198.986, and 198.435. The data reflects trading activity as of 03:08:55.
GDPJPYUsing ICT concepts combined with the BTMM strategy, GBPJPY is currently showing a high-probability bullish signal.
Market Structure: Price has cleared liquidity from recent lows, indicating a potential smart money accumulation phase.
BTMM Timing: The pair is aligning with a Market Maker cycle, showing signs of a Phase 1 accumulation and potential move into Phase 2 (markup).
ICT Confluences:
Liquidity grab beneath the previous session low.
Price has returned to a fair value gap/imbalance zone.
Order block support is holding strongly.
If the bullish momentum sustains, we could see price push towards projected key levels (next liquidity pool above).
However, if price fails to hold this accumulation zone and breaks below the current structural low, we may see a collapse to deeper discount levels as indicated.
Bias: Bullish
Entry Zone: Around the discount order block
Targets: Next liquidity levels above
Invalidation: Break below the recent accumulation low

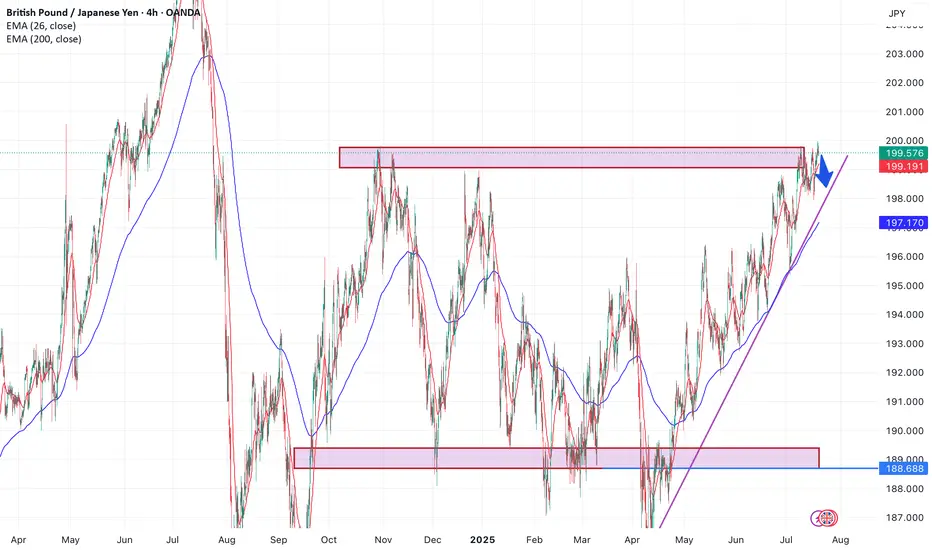
GBPJPY - Trading The Range!Hello TradingView Family / Fellow Traders. This is Richard, also known as theSignalyst.
📈GBPJPY has been hovering within a big range.
This week, GBPJPY is retesting the upper bound of the range and $200 round number.
As long as the resistance holds, we will be looking for shorts on lower timeframes, targeting the lower bound of the range.
📚 Always follow your trading plan regarding entry, risk management, and trade management.
Good luck!
All Strategies Are Good; If Managed Properly!
~Rich
Disclosure: I am part of Trade Nation's Influencer program and receive a monthly fee for using their TradingView charts in my analysis.

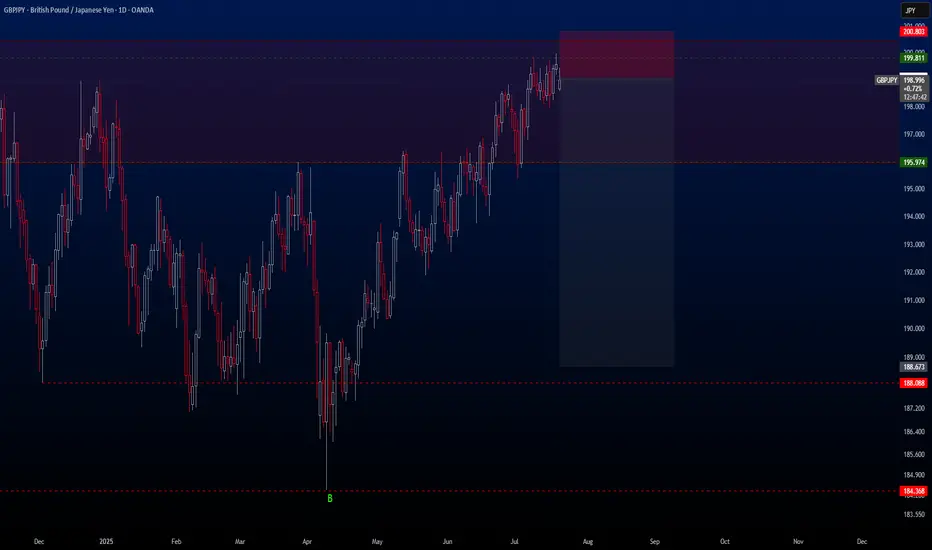
GBPJPYHello traders,
The holidays are over and we’re back to trading again! 🙂
Our first trade is on the **GBPJPY** pair. This setup is quite ideal for those thinking long-term. I’ve already activated this trade on my side.
🔍 **Trade Details**
✔️ **Timeframe**: D/W
✔️ **Risk-to-Reward Ratio**: 1:6
✔️ **Trade Direction**: Sell
✔️ **Entry Price**: 199.073
✔️ **Take Profit**: 188.673
✔️ **Stop Loss**: 200.803
🔔 **Disclaimer**: This is not financial advice. I’m simply sharing a trade I’ve taken based on my personal trading system, strictly for educational and illustrative purposes.
📌 Interested in a systematic, data-driven trading approach?
💡 Follow the page and turn on notifications to stay updated on future trade setups and advanced market insights.
GJ-Mon-21/07/25 TDA-Wide range GJ, weekend gap at open!Analysis done directly on the chart!
We have big bank holidays and minor bank holidays.
Surely minor bank holidays impact less the price
Premise:
A simple idea plan (like Tradingview public posts) won't describe everything.
No one can predict how market will move, it's always good to react to how it moves.
It gives an idea of how price might move, but no one come from FUTURE.
So I always encourage people to openly and actively discuss in real time.
I don't give signals blindly, people should learn
and understand the skill.
Following blindly signals you won't know how to
manage the trade, where precisely put sl and tp,
lot size and replicate the move over time.
That's why you need active real time discussions.
Trading is not get rich quick scheme!
Active in London session!
Not financial advice, DYOR.
Market Flow Strategy
Mister Y

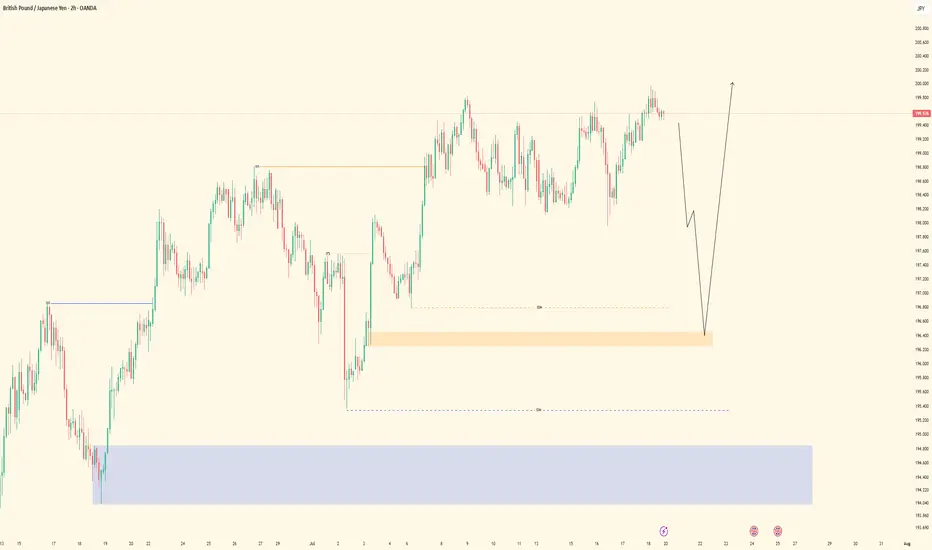
Bull Market, Bear Move: Temporary Shift or Trend Change?Hello Traders,
Welcome to the new trading week.
The daily timeframe remains in a strong bullish trend; however, recent price action shows a break in alignment on the 4-hour chart. After sweeping a weak daily higher high, the 4-hour structure has shifted bearish, indicating a potential retracement or deeper correction. This internal shift suggests that price may now be heading toward the last weak low as liquidity and structural targets align. Caution is advised until the 4-hour and daily biases realign.

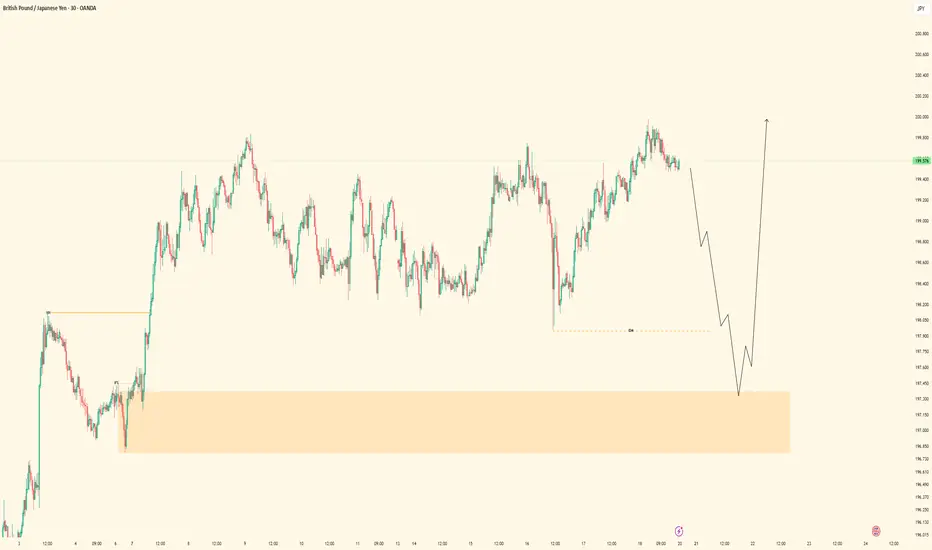
GBPJPY 15-Minute Analysis with Supply and Demand Zones1. Market Context
The price recently experienced a strong upward move followed by a rejection at the Higher Time Frame (HTF) Supply Zone near the 200.051 level.
Key levels have been identified including an HTF Supply Zone (resistance area) and HTF Demand Zone (support area).
2. Price Structure and Key Levels
The chart marks a weak high (x-weak high) near the supply zone which indicates possible exhaustion of upward momentum.
A break of structure (x-bos) was followed by a retracement to the supply zone.
The HTF Demand Zone around 198.070 marks a strong support area from which price might potentially rebound.
3. Trading Plan and Execution
Entry: Consider a short (sell) position near the HTF Supply Zone (around 199.8 to 200.05) after confirmation of bearish rejection or reversal patterns.
Target: Set the take profit near the HTF Demand Zone (around 198.07), which represents a strong support level.
Stop Loss: Place a stop loss just above the HTF Supply Zone to protect against unexpected breakouts.
Trade Management: Expect a possible retest or small pullback after the initial move from the supply zone before continuing the downward trend.
4. Outlook and Strategy
The primary expectation is a downward movement from the supply zone to the demand zone.
Watch for price action cues such as bearish engulfing candles or strong rejection wicks at the supply zone to confirm entry.
If price breaks above the HTF Supply Zone strongly, reconsider the bearish bias for possible trend shifts.

GBPJPY DECLINE SOONER OR LATEROn the Daily we see a clear uiptrend. However, Price is converging creating a rising wedge pattern. Conservatively we wait for price to break the last low that was formed before entering a sell but aggressively we want to enter our sell trade where Market open leaves a gp to filll @199.74 wit ha 95 pips stop loss and a 240 pips TP. should our bullish trendline be broken then we wait for retest to sell price down to 195.186
On the buy side we want to see a breakout and close above our last high for trend continuation.
A retest of that breakout is an ideal entry point for our buy trade @ 199.402 with 110 pips stop loss and 2RR

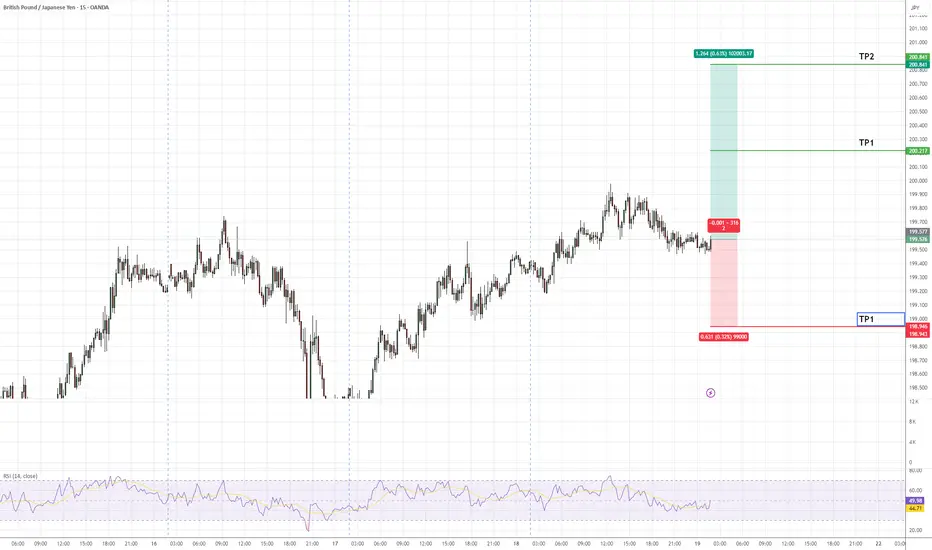
Potential Bullish Trade in GBPJPYGBPJPY continues to exhibit strong bullish momentum, with price action aligning with the prevailing uptrend. The pair is projected to advance towards the identified target zones (TP1 and TP2) as marked on the chart. A stop-loss level (SL) has been defined to manage downside risk effectively.
Traders are advised to monitor key support and resistance levels for potential confirmations as the setup develops.
GBPJPY- UPDATED ANALYSIS GBPJPY Bias: Bullish HTF Overview (4H): Price remains in strong bullish structure, with higher highs continuing to break. No signs of deep pullbacks toward major SSLs, confirming strength in the current leg. LTF Confirmation (30M): Clean refined structure now visible. Market gave a textbook pullback into a fresh demand zone (30M OB) after sweeping minor liquidity. No need to expect a deeper move unless invalidated. Entry Zone: Watching for price reaction from the refined 30M OB. If price respects this level, I’ll drop to 5M for LH break → 1M for entry precision. Targets: Eyes on recent high as first TP, followed by extended targets if momentum continues. Mindset Note: Sometimes the best move is simply refining levels and letting the setup come to you. No rush, just alignment.
GBP/JPY: Possible short position in the coming daysGBP/JPY has reached a key psychological level at 200, where we often see institutional manipulation—false breakouts or stop hunts are common at such milestones. With major UK events and the BoJ rate decision set for July 30, a deep correction could be engineered here before the next bullish leg resumes.

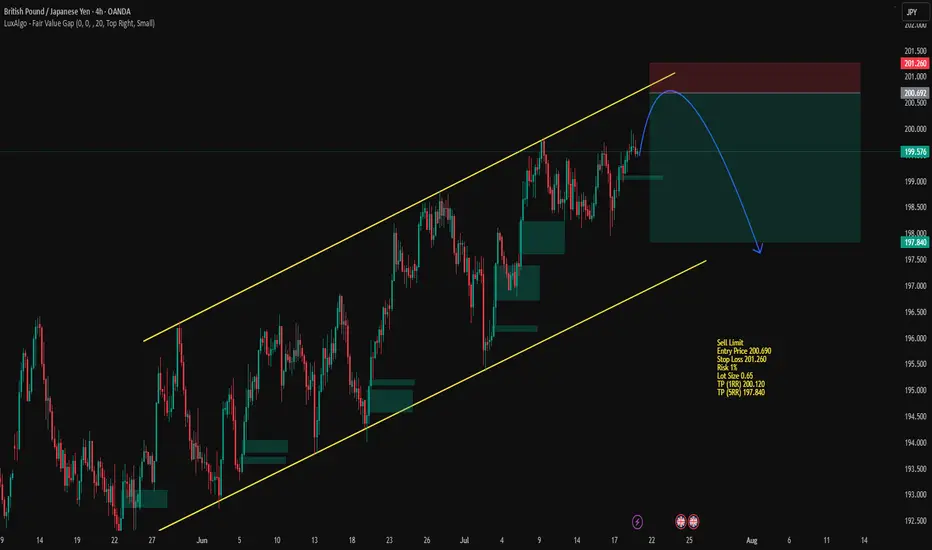
GBPJPY in Trend ReversalSell Limit
Entry Price 200.690
Stop Loss 201.260
Risk 1%
Lot Size 0.65
TP (1RR) 200.120
TP (5RR) 197.840
GBPJPY - Bullish Continuation Setup• Pair: GBPJPY
• Bias: Bullish (Buy)
• HTF Overview (4H):
• Strong bullish momentum with clear breaks to the upside.
• No signs of price reaching deeper 4H SSL — continuation more likely.
• MTF Refinement (30M):
• Watching for price to mitigate lower 30M OB zone.
• Expecting bullish continuation from that area.
• Entry Zone:
• Wait for LTF confirmation inside 30M OB.
• Switch to trader mode after valid CHoCH / intent confirmation.
• Targets:
• Structure highs / clean extension into the next liquidity pool.
• Mindset Note:
• Be patient, trust bullish structure. Let price come to you.
Bless Trading!
GBPJPY TRADE SETUPWait for retest the entry level and bearish momentum candle then take a trade for Sell othewise skip this setup

Sell Gbpjpy Strong selling
Weekly strong resistance arrived
Respected it many times
Now we expecting to respect it one more time
Weekly and daily overbought pair

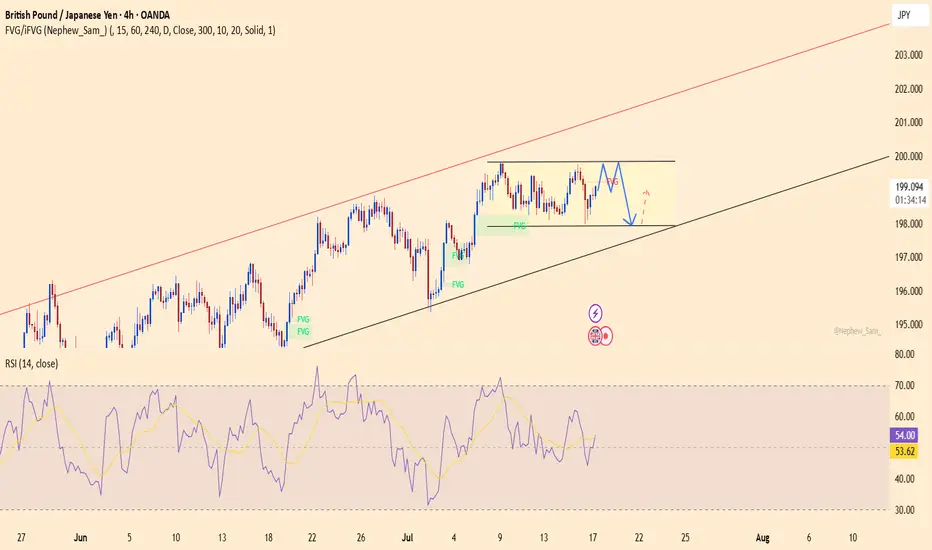
Sell gbpjpyIn the current chart, we are observing a range-bound trading pattern, with the price nearing the upper boundary, which is also a significant psychological level (200) . In the other hand a double top formation has emerged in this area, indicating strong resistance, as the price has previously touched this level multiple times.
As we approach this critical juncture, it is anticipated that the price may decrease and move toward the lower boundary of the range. Notably, there is a purple trend line representing an upward trend, which plays a crucial role in this analysis. As the price descends, it is expected to intersect with this purple line, making it an important area to set the first take-profit (TP) target.
If the price manages to break below the purple trend line, this could indicate a more pronounced bearish trend, providing opportunities to establish additional take-profit levels based on subsequent support or resistance zones. Traders should remain vigilant and adaptable, monitoring price action closely to optimize their trading strategies.
GBPJPY POTENTIAL SHORT OPPORTUNITY ???Yes the gbpjpy is in a very strong uptrend. However it might meet some resistance soonwhich will slow down the bulls. Lets see how this plays out

GBPJPYStrong daily resistance breakout, consolidated for almost 2 weeks and formed a bullish flag on the H4. Lets see what price does this week.

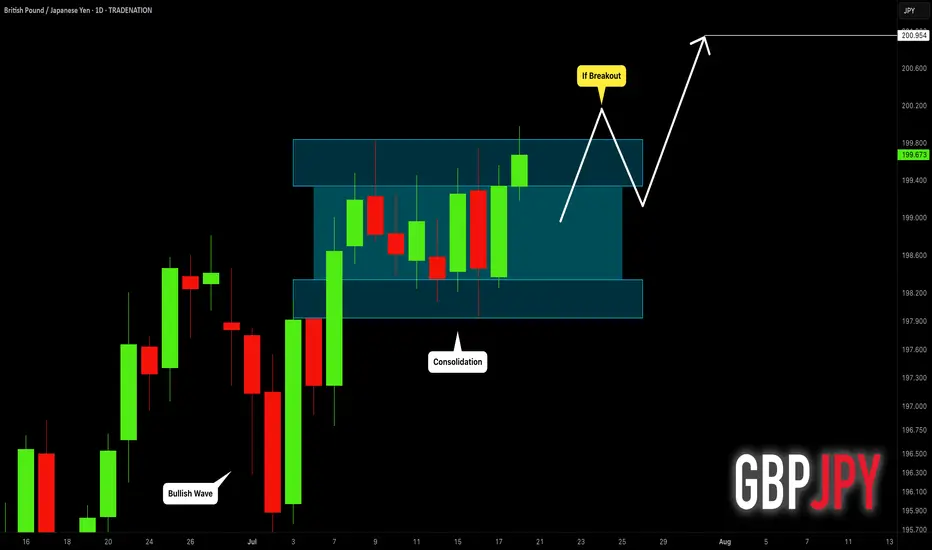
GBPJPY set for breakoutGBPJPY is currently trading in a sideways pattern within an ascending channel. The support zone around 197.900 has been respected multiple times, while price repeatedly fails to break above the 199.800 resistance – signaling that built-up pressure may soon erupt.
Recent data shows that UK inflation remains high, and the Bank of England may maintain its hawkish stance, supporting the GBP. Meanwhile, global risk-off sentiment continues to weaken the JPY.
If price breaks through the current resistance, it would confirm the continuation of the uptrend, with a target toward the upper boundary of the red channel. However, if rejection persists, buying from support remains a valid strategy.
GBPJPY: Get Ready to Buy 🇬🇧🇯🇵
GBPJPY is consolidating within a narrow horizontal range
on a daily time frame.
I am waiting for its bullish breakout and a daily candle close above
199.85 to confirm the next bullish wave.
A rise will be expected to 201 level then.
❤️Please, support my work with like, thank you!❤️
I am part of Trade Nation's Influencer program and receive a monthly fee for using their TradingView charts in my analysis.