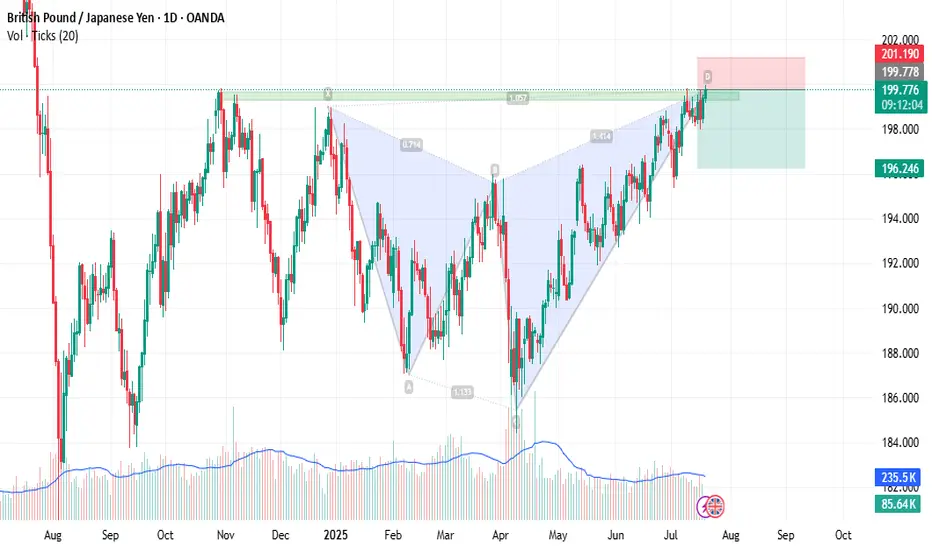
GBPJPY Large Reversal Pattern [Elliott Wave]Executive Summary:
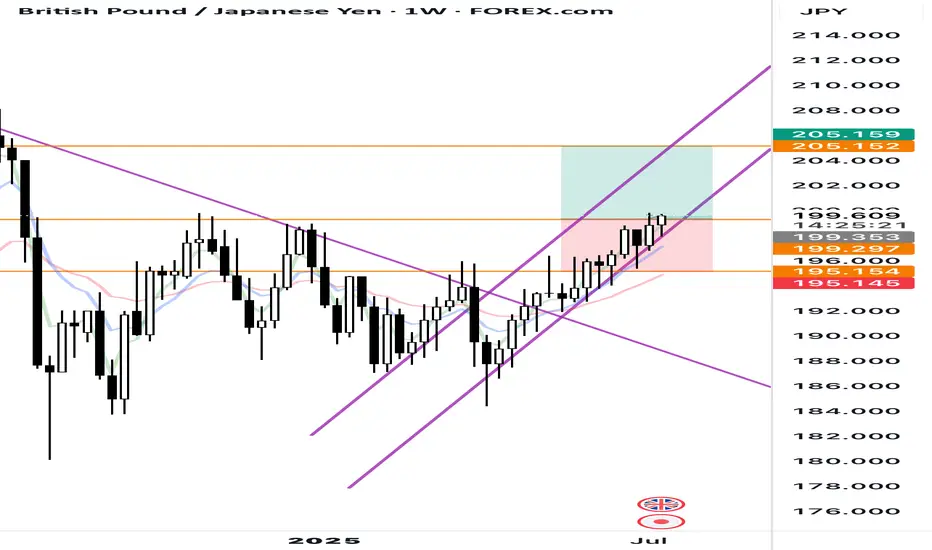
GBPJPY shaping a diagonal pattern.
Large bearish reversal could push down to 184.
Above 202.40 voids the pattern as labeled.
I typically don't conduct Elliott wave analysis on cross pairs simply because they are the children of the two main currencies involved. GBPJPY is the child of GBPUSD and USDJPY.
With that said, I still scroll through charts looking for compelling patterns and GBPJPY caught my attention.
First, it's knocking on the door of 200...a nice round number.
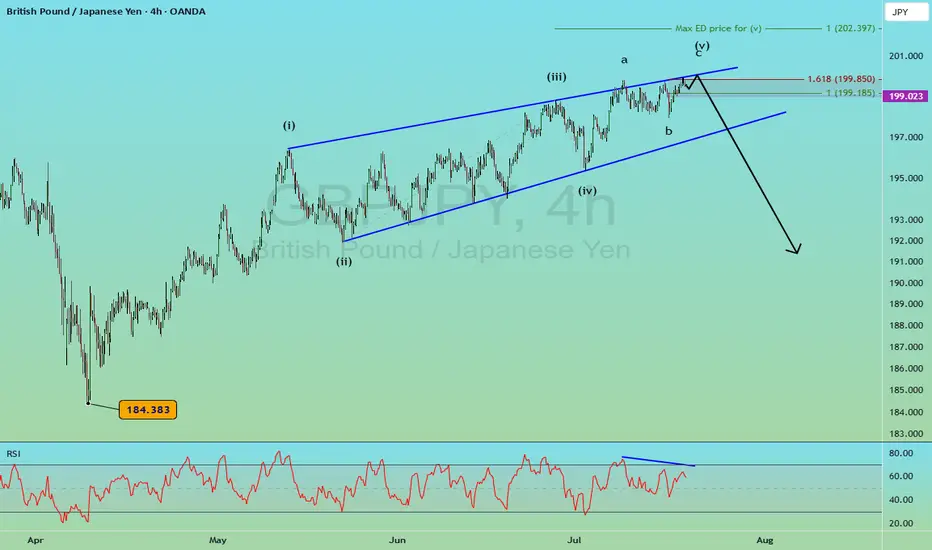
Secondly, the rally from 184 in April to now appears to be a very mature Elliott wave ending diagonal pattern .
Diagonals shape in 5 waves. Remember, wave 3 cannot be the shortest of waves 1,3,5. Since wave 3 is shorter than wave 1, that means wave 5 cannot be longer than wave 3.
So we simply measure out wave 3 and apply it to the end of wave 4, and, voila, we have a maximum target for wave 5 at 202.40 .
That maximum target doesn't mean GBPJPY has to go that high, but this market is ripe for a large bearish turn. If GBPJPY does push above 202.40, then my wave labeling is incorrect.
Ending diagonals tend to be fully retraced which implies a decline back to 184 ... 1500 pips from today's price.
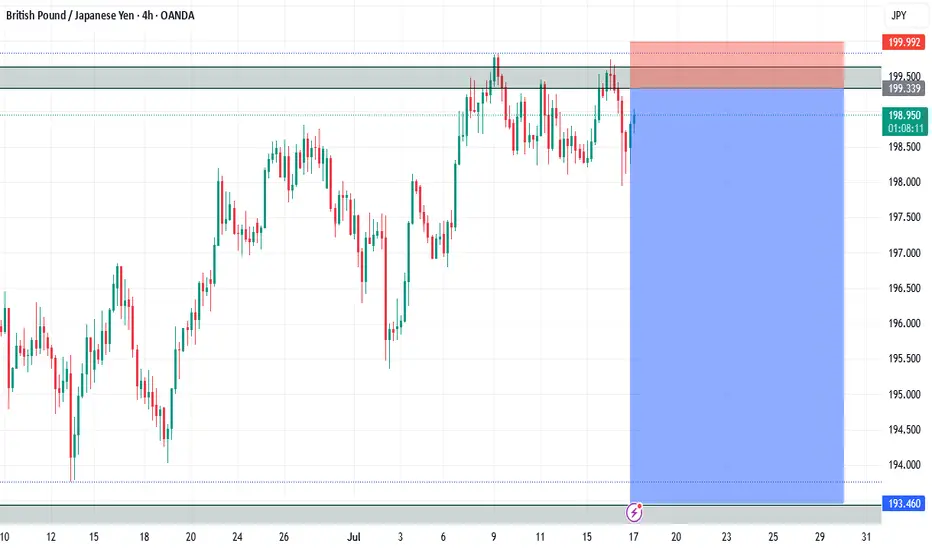
GBJPY may dance around in the 199 handle for a day or two.
A break below 199 could be an early warning signal of the bearish reversal. A break below the blue support trend line helps confirm the pattern.
If this bearish reversal takes hold, then GBPUSD or USDJPY likely experiences a large decline too.
GBPJPY trade ideas
GBP/JPYNear the 200 psychological and very important level for institution TP Level i expect a very deep retracement here
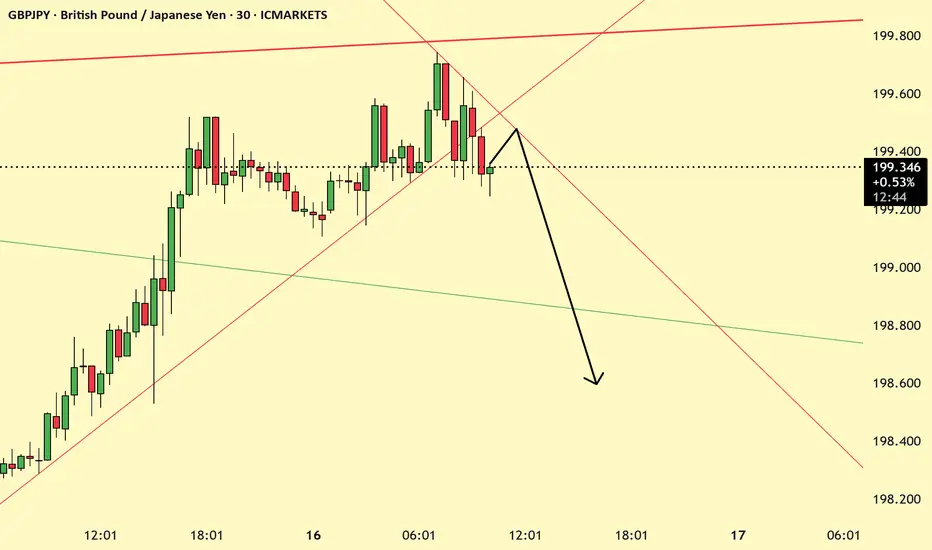
GBPJPYGBP/JPY is undergoing a trend reversal.
What matters is that, based on price action and fractal concepts, the bullish trend has ended.
Practice proper risk management and protect your profits.
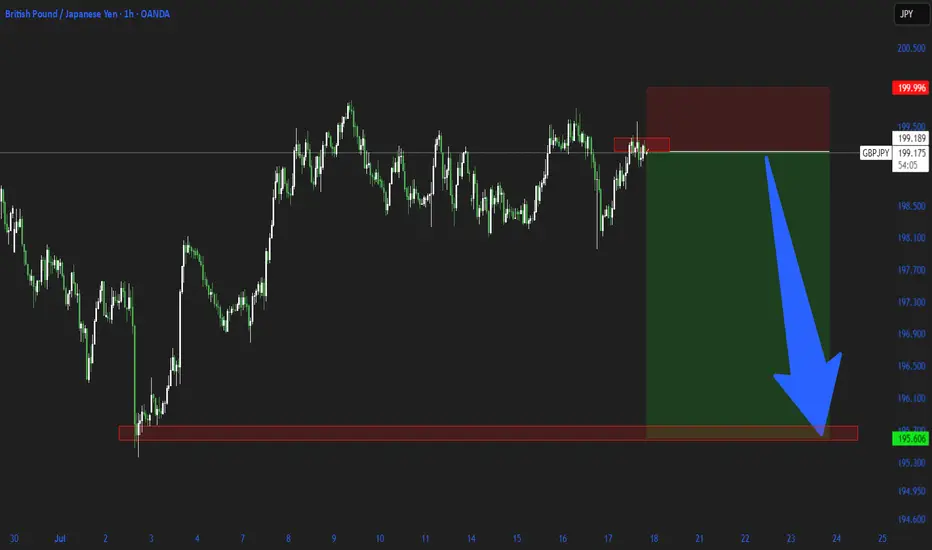
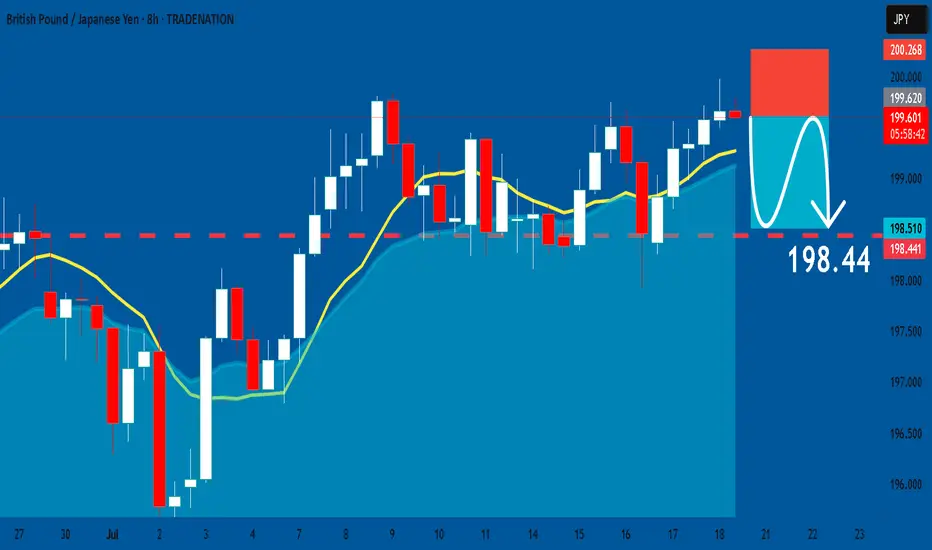
GBPJPY: Short Trading Opportunity
GBPJPY
- Classic bearish formation
- Our team expects pullback
SUGGESTED TRADE:
Swing Trade
Short GBPJPY
Entry - 199.63
Sl - 200.26
Tp - 198.44
Our Risk - 1%
Start protection of your profits from lower levels
Disclosure: I am part of Trade Nation's Influencer program and receive a monthly fee for using their TradingView charts in my analysis.
❤️ Please, support our work with like & comment! ❤️
GBPJPY short at current market priceH4 candle closed in doji pattern, hint for buyer started losing the strength.
i'm short at current market price.
target to take profit at 198.60
calculate your own risk & reward
Good luck
GBPJPY - 1D SetupThe Japanese yen may get stronger for a while due to the weakening of the British Economy, which may lead to a pullback of the GBPJPY currency, and this seems to be a good trading opportunity in sells with a strict stop-loss. OANDA:GBPJPY
Note- This is my own view and not a financial advice as trading comes with high risk.
GBPJPY long outlook Looks like we just broke resistance area now heading up to next resistance area level.
I have set some support and resistance lines to project my outlook .
What do you it’s think?
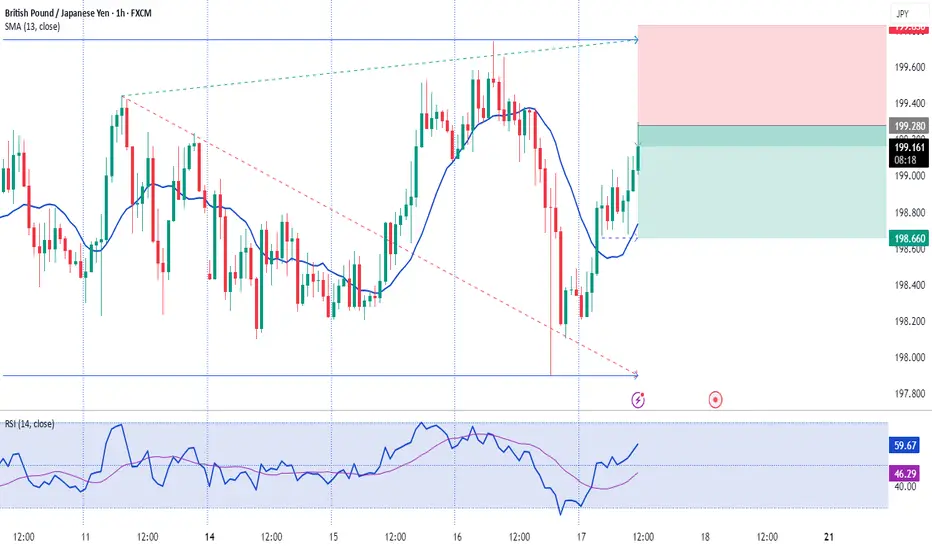
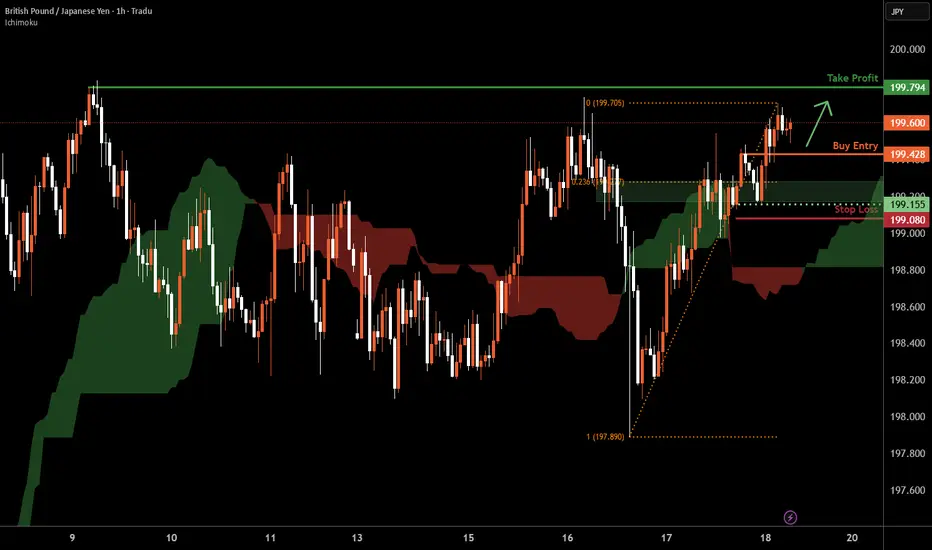
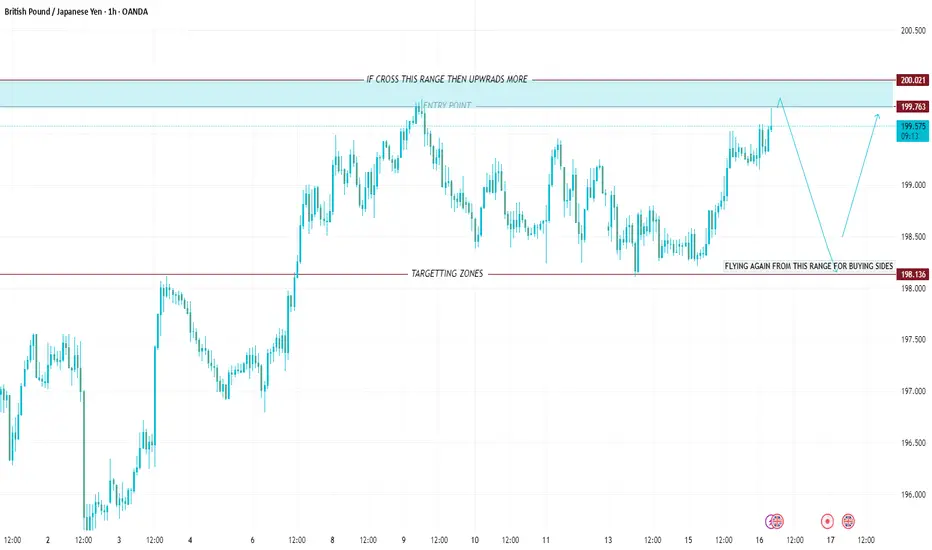
GBP/JPY H1 | Bullish uptrend to extend higher?GBP/JPY is falling towards a pullback support and could potentially bounce off this level to climb higher.
Buy entry is at 199.42 which is a pullback support.
Stop loss is at 199.08 which is a level that lies underneath a swing-low support and the 23.6% Fibonacci retracement.
Take profit is at 199.79 which is a swing-high resistance.
High Risk Investment Warning
Trading Forex/CFDs on margin carries a high level of risk and may not be suitable for all investors. Leverage can work against you.
Stratos Markets Limited (tradu.com ):
CFDs are complex instruments and come with a high risk of losing money rapidly due to leverage. 66% of retail investor accounts lose money when trading CFDs with this provider. You should consider whether you understand how CFDs work and whether you can afford to take the high risk of losing your money.
Stratos Europe Ltd (tradu.com ):
CFDs are complex instruments and come with a high risk of losing money rapidly due to leverage. 66% of retail investor accounts lose money when trading CFDs with this provider. You should consider whether you understand how CFDs work and whether you can afford to take the high risk of losing your money.
Stratos Global LLC (tradu.com ):
Losses can exceed deposits.
Please be advised that the information presented on TradingView is provided to Tradu (‘Company’, ‘we’) by a third-party provider (‘TFA Global Pte Ltd’). Please be reminded that you are solely responsible for the trading decisions on your account. There is a very high degree of risk involved in trading. Any information and/or content is intended entirely for research, educational and informational purposes only and does not constitute investment or consultation advice or investment strategy. The information is not tailored to the investment needs of any specific person and therefore does not involve a consideration of any of the investment objectives, financial situation or needs of any viewer that may receive it. Kindly also note that past performance is not a reliable indicator of future results. Actual results may differ materially from those anticipated in forward-looking or past performance statements. We assume no liability as to the accuracy or completeness of any of the information and/or content provided herein and the Company cannot be held responsible for any omission, mistake nor for any loss or damage including without limitation to any loss of profit which may arise from reliance on any information supplied by TFA Global Pte Ltd.
The speaker(s) is neither an employee, agent nor representative of Tradu and is therefore acting independently. The opinions given are their own, constitute general market commentary, and do not constitute the opinion or advice of Tradu or any form of personal or investment advice. Tradu neither endorses nor guarantees offerings of third-party speakers, nor is Tradu responsible for the content, veracity or opinions of third-party speakers, presenters or participants.
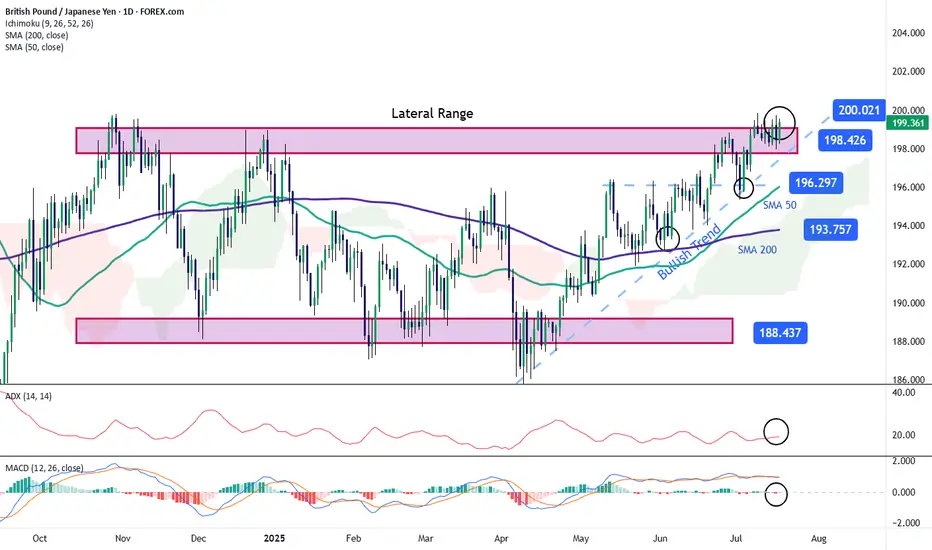
GBP/JPY: Pound Attempts to Break Out of a Broad Sideways RangeThe GBP/JPY pair has gained over 0.5% today in favor of the British pound, as the Japanese yen continues to weaken steadily. The recent escalation in the trade war, where potential 25% tariffs may begin to affect Japan in the short term, has contributed to the yen’s steady decline. For now, this remains one of the main catalysts behind the price movement, which is trending lower in the near term. As uncertainty surrounding the yen persists, buying pressure on GBP/JPY could become more significant.
Broad Sideways Range at Risk
Recent short-term bullish movements are beginning to test the upper boundary at 198.42, a key level within the broad sideways range that has dominated the chart in recent months. For now, the price could face a period of persistent neutrality as it tries to push through this upper barrier, which remains the most relevant resistance zone. If buying pressure holds steady over the coming sessions, the range could come under threat, potentially giving way to a more dominant and consistent bullish trend in the short term.
ADX
The ADX line is currently oscillating close to the 20 level, which typically indicates low average volatility over the past 14 sessions. This could be signaling a period of price consolidation, especially as the pair approaches current resistance zones.
MACD
The MACD histogram remains close to the zero line, suggesting a lack of clear direction in the short-term momentum of the moving averages. As long as this persists, it will likely reinforce the current neutral sentiment around resistance levels.
Key Levels:
200.00 – Tentative resistance zone, corresponding to the next psychological level to watch in the short term. Sustained price action above this level could confirm a breakout of the broad channel, paving the way for a dominant bullish trend.
198.42 – Nearby barrier, marking the upper boundary of the broad range. Sustained moves above this level could further reinforce the prevailing bullish bias.
196.297 – Key support level, marking the recent low. If selling pressure brings the price back to this area, the market could resume the broad sideways range seen in previous sessions.
Written by Julian Pineda, CFA – Market Analyst
GBPJPY ENTRY CHARTOn this Pair, we are still BEARISH, as its strength shifted yesterday, JPY is gaining STRENGTH, also we have a DAILY BEARISH CLOSE, we have a CHOCH on the HOURLY, ewith a LTF CONFIRMATION, with other confluences on this pair, you can add to your watch-list,if this matches with your idea, and don't forget to apply a good risk on this idea, and dont forget the rules of moving B.E after +1r
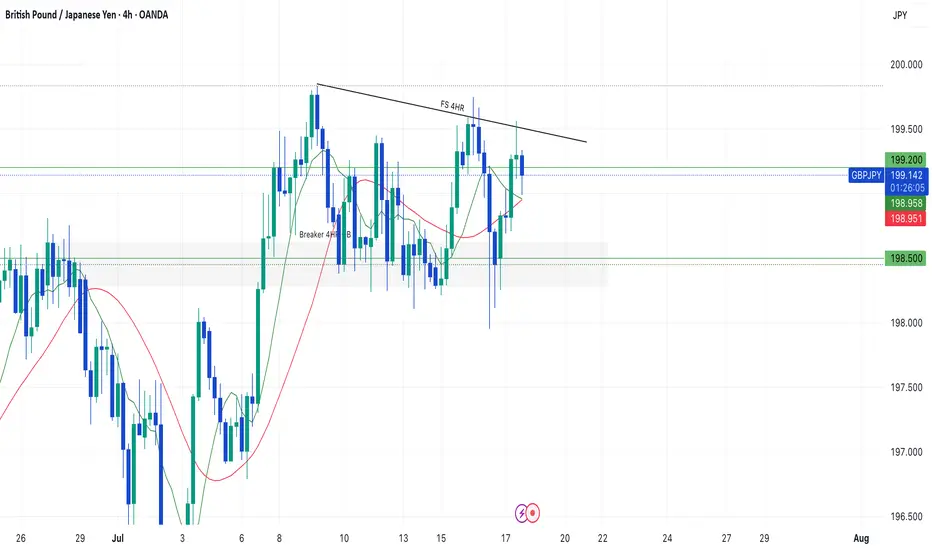
Waiting for the bigger move with GBPJPYHi Traders!
Right now, GJ is failing to swing higher at a major resistance at 199.200. Looking at the 4HR, yesterday July 16th, price wicked down to 198.000 retesting a previous 4HR CHOCH, then pulling back up to continue consolidation in between 198.000 and 199.200. However, on the 4HR price didn't close below 198.000 with continuation, which would make me believe that if the new 4HR CHOCH is valid, eventually price will break through 199.200. This will require patience if I want a bigger move. A more conservative approach to this trade, for me, would be entering on the break with a retest/bounces off 199.200.
SL below a new HL, TP1: 201.000, Overall TP: 202.000.
In addition, the only way I would sell is if price broke down past 198.500/198.200, and kept rejecting. Then, I could see a downside. But, imo price action just it's giving that confirmation right now.
*DISCLAIMER: I am not a financial advisor. The ideas and trades I take on my page are for educational and entertainment purposes only. I'm just showing you guys how I trade. Remember, trading of any kind involves risk. Your investments are solely your responsibility and not mine.*
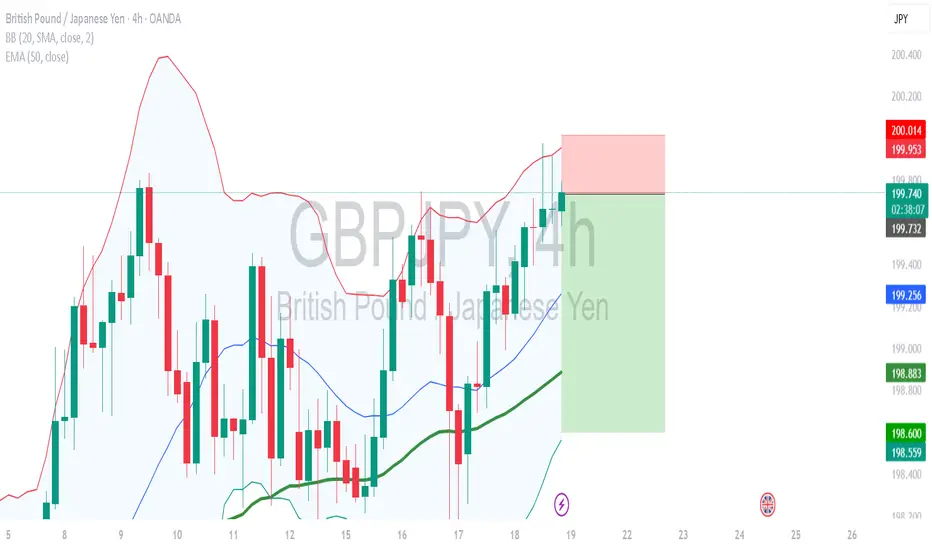
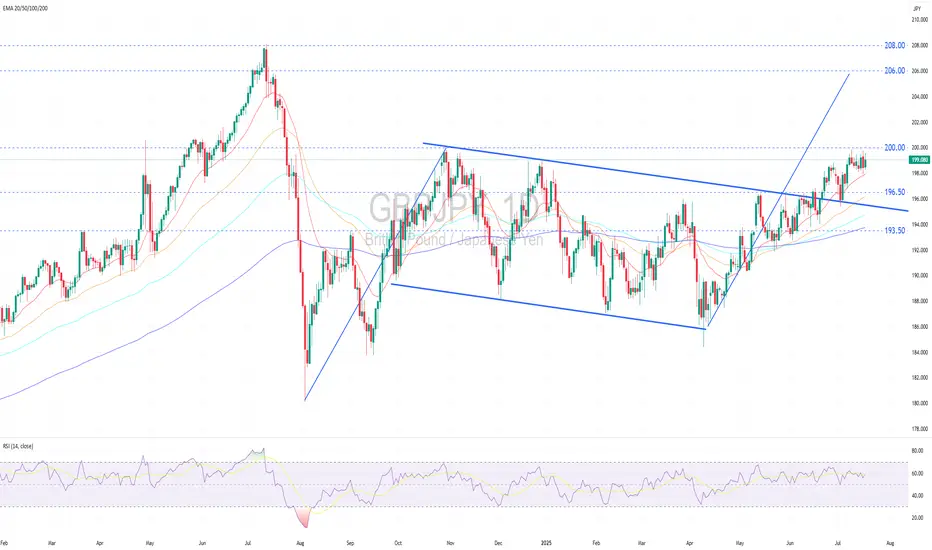
GBPJPY Remains in a Solid Uptrend.GBPJPY remains in a solid uptrend.
Technical Outlook:
GBPJPY remains in a firm uptrend, forming a series of higher highs and higher lows while holding above widening bullish EMAs, signaling strong bullish momentum.
Price is currently consolidating sideways near the recent peak, following a successful retest of the broken descending trendline, a classic bullish continuation setup.
No clear reversal signals have emerged, and the range-bound action suggests accumulation ahead of a potential upward breakout (above 200.00).
A decisive breakout above the psychological resistance at 200.00 would confirm a trend-following breakout, opening upside targets at 206.00 (flagpole projection) and potentially 208.00 (2024 high).
Near-term pullbacks may find support at 196.50 , the prior breakout zone, before resuming the uptrend.
Fundamental Outlook:
The pound is supported by higher-than-expected inflation data for June, with the UK’s Consumer Price Index (CPI) coming in at 3.6%, nearly twice the BoE target. This has led markets to expect that the BoE might delay or pause interest rate cuts at its upcoming meeting in August.
Moreover, the UK Prime Minister’s strong commitment to fiscal discipline has played a pivotal role in reinforcing investor confidence, thereby lending further support to the pound.
In contrast, the BoJ continues to adopt a cautious stance, keeping its policy rate at a relatively low at 0.50%. This conservative approach reflects the central bank’s intent to monitor the economic impacts of US tariff increases before any further action.
The BoJ’s low-rate policy sustains yen carry trades, driving capital outflows into higher-yielding US assets, mostly US treasury bonds, and intensifying downward pressure on the yen.
Analysis by: Krisada Yoonaisil, Financial Markets Strategist at Exness
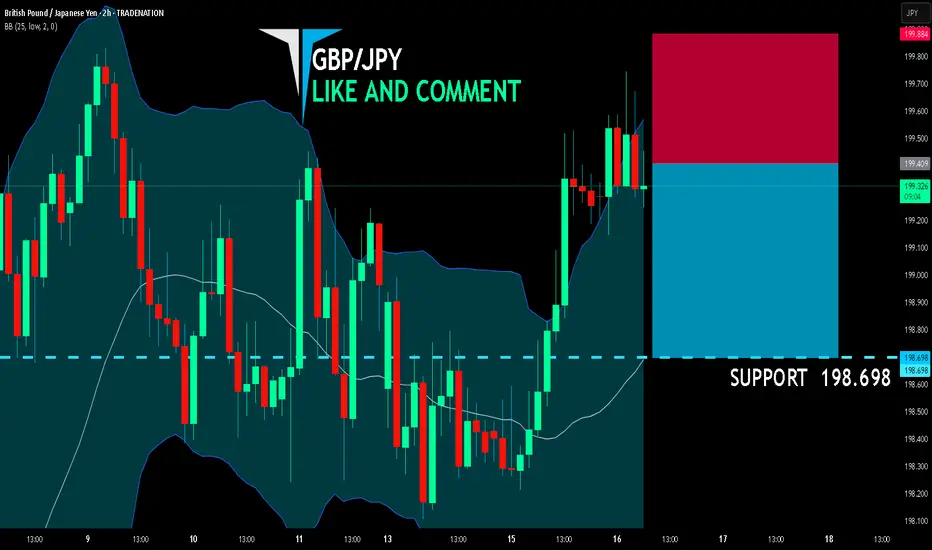
GBP/JPY BEARISH BIAS RIGHT NOW| SHORT
GBP/JPY SIGNAL
Trade Direction: short
Entry Level: 199.409
Target Level: 198.698
Stop Loss: 199.884
RISK PROFILE
Risk level: medium
Suggested risk: 1%
Timeframe: 2h
Disclosure: I am part of Trade Nation's Influencer program and receive a monthly fee for using their TradingView charts in my analysis.
✅LIKE AND COMMENT MY IDEAS✅
17.07.25 Morning ForecastPairs on Watch -
OANDA:US30USD
CAPITALCOM:DE40
FX:GBPJPY
A short overview of the instruments I am looking at for today, multi-timeframe analysis down to what I will be looking at for an entry. Enjoy!

GBPJPYGBP/JPY is currently trading at 199.535, providing a potential short opportunity from elevated levels.
2. The ideal sell zone lies between 199.500 – 199.700, where price shows signs of rejection.
3. A downside move could test the first support (previous resistance flipped) at 199.000.
4. Further weakness may lead to a drop toward 198.500, the next key demand zone.
5. A break below 198.000 would act as a strong confirmation of bearish momentum.
6. Place a stop-loss above 200.300, as a move above this level would invalidate the sell setup.
7. Price action shows signs of exhaustion after recent bullish runs, hinting at a potential reversal.
8. Selling pressure near the psychological 200.00 level adds to bearish bias.
9. Monitor lower timeframes for bearish engulfing candles or breakdown patterns below 199.00.
10. Below 200.300, the trade favors the bears, aiming for targets down to 198.000 or lower.
GBPJPY Broke trend line is likely to go downGBPJPY was trending up but recently has broken the trendline support and price is likely to go down after a retest.
GBPJPY SELLThe break of the support level on the H4 is complete. Looking at the retest of the broken support for the continuation of the fall

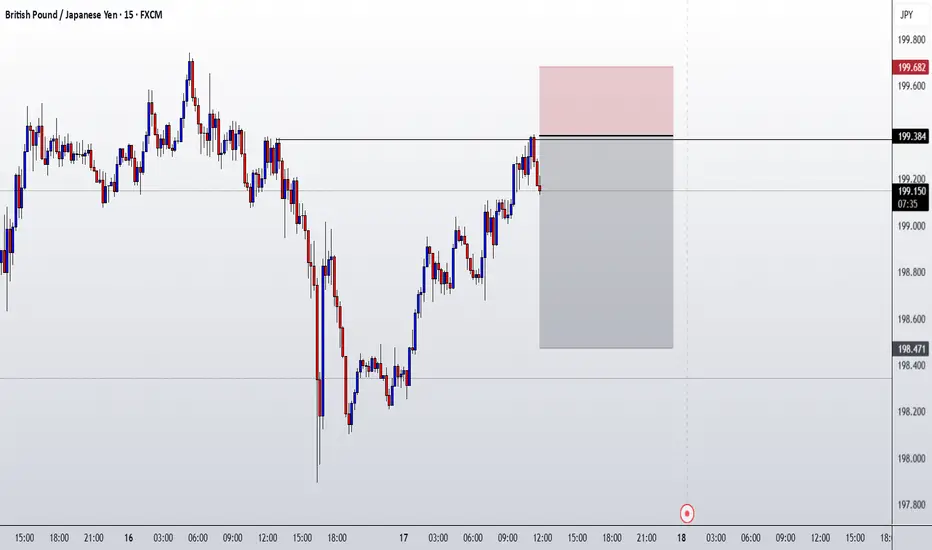
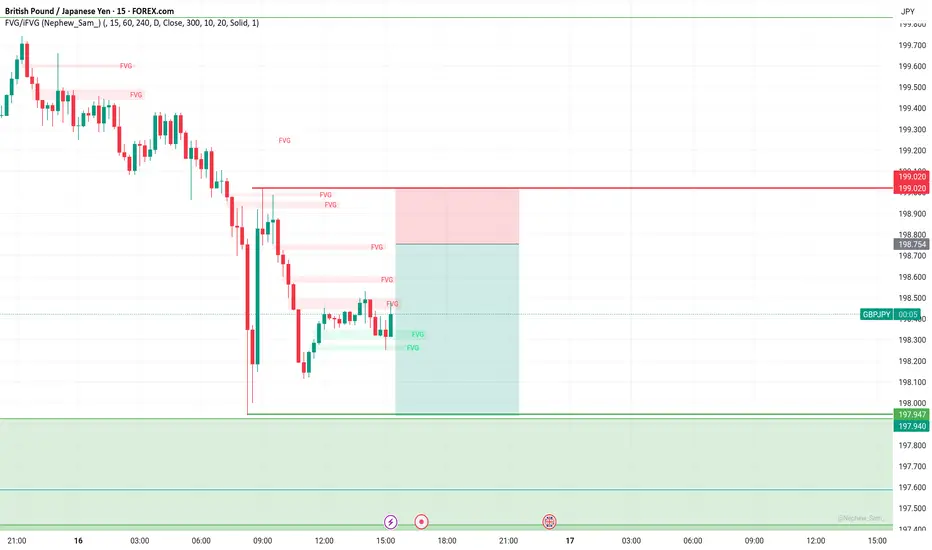
GBP/JPY Quick trade on the 15 minTrending down into a order block. Medium Risk as HTF are in the middle of the range just above the order block
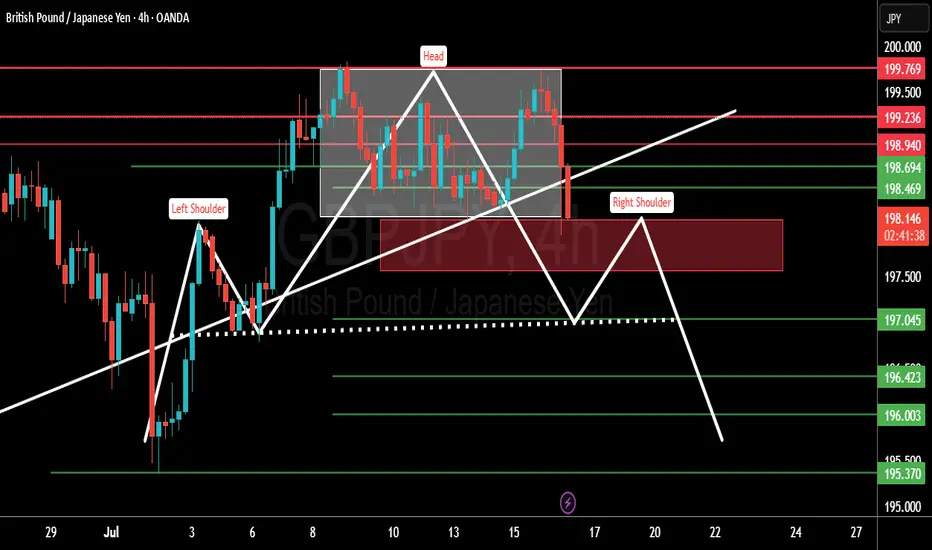
GBPJPY SELLH&S pattern forming fibs also gives a clear sign of sell long tell with the market reversing.
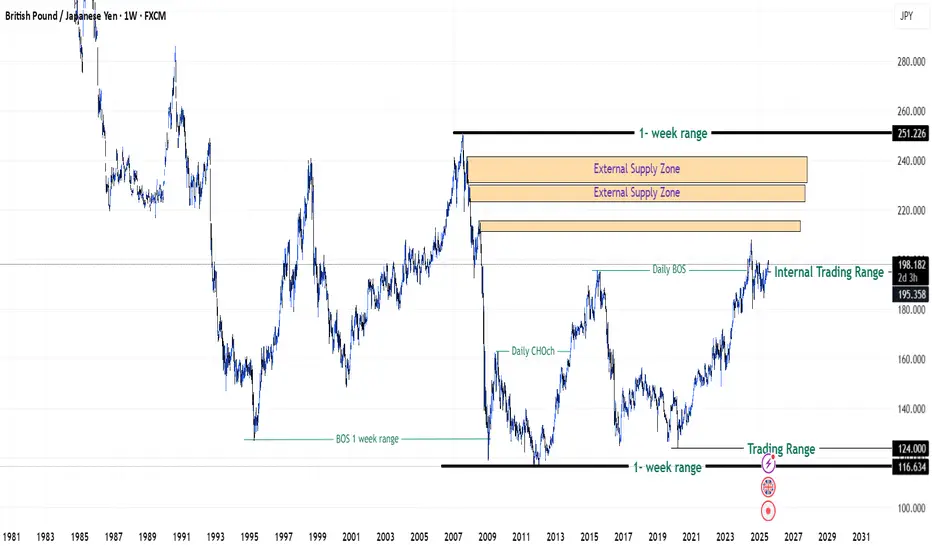
GBPJPY in Premium Zones of 2008 Financial Crisis - {17/07/2025}Educational Analysis says that GBPJPY (FX pair) may give trend Trading opportunities from this range, according to my technical analysis.
Broker - FXCM
So, my analysis is based on a top-down approach from weekly to trend range to internal trend range.
So my analysis comprises of two structures: 1) Break of structure on weekly range and 2) Trading Range to fill the remaining fair value gap
Will Jpy start to lose value like it is doing since 2019 or it will do free fall same like 2008 crisis.
Let's see what this FX pair brings to the table for us in the future.
Please check the comment section to see how this turned out.
DISCLAIMER:-
This is not an entry signal. THIS IS FOR EDUCATIONAL PURPOSES ONLY.
I HAVE NO CONCERNS WITH YOUR PROFIT OR LOSS,
Happy Trading.
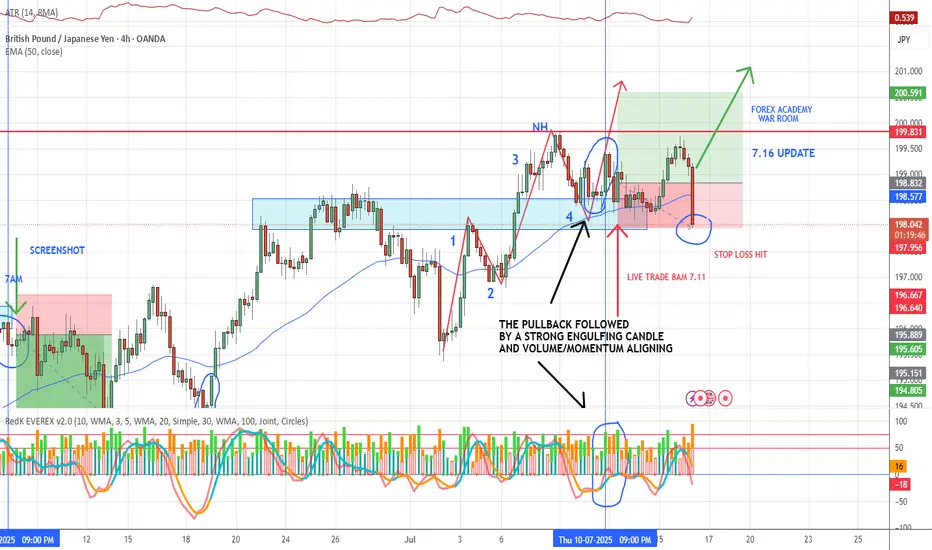
7.16 GBP/JPY LOSSSome days you go through things like this, when the markets make big moves it is great if you are on the right side and sucks if you are not. We have a limit to our exposure in the markets and ALWAYS follow our bankroll management plan. Price hit our stop on this one — no hesitation, no regrets. The setup met all the VMS criteria, but the market had other plans. This happens, and it’s built into the process. No revenge trades. No chasing. Just alignment and discipline. That’s how we grow.