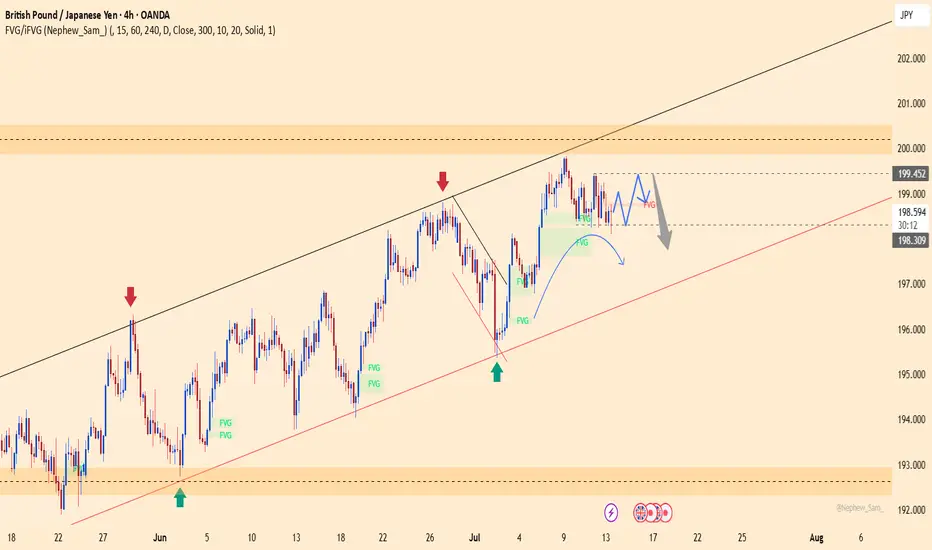
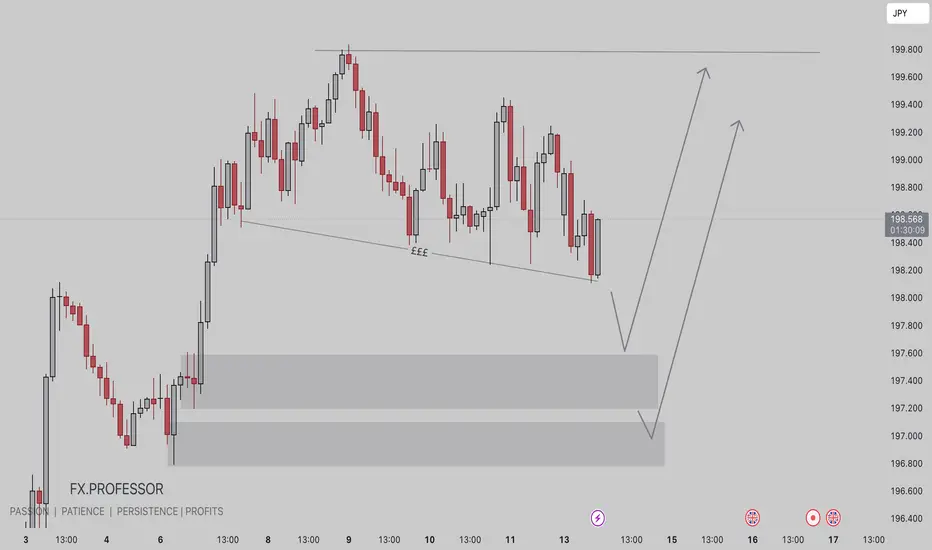
GBPJPY CONTINUATIONTechnically:
Printing bullish flag
Retrace from 0.382 fib level.
Retest the resistance which became support.
Scenario 1 is based on support became resistance
Scenario 2 based on bullish flag breakout of pole
GBPJPY trade ideas
Long gbpjpyYou can buy Gbpjpy now or play it safe and wait until price comes to entry level which is the current today's high by using buystops
GBPJPY (SHORT)
GBPJPY broker the trendline and went to resistance level.
Jpy has been weak for 6months (1st half of year) now it will gain strength and jpy pairs to sell.
WHY: It summer holidays so tourist are traveling to Japan strengthening it currency Value.
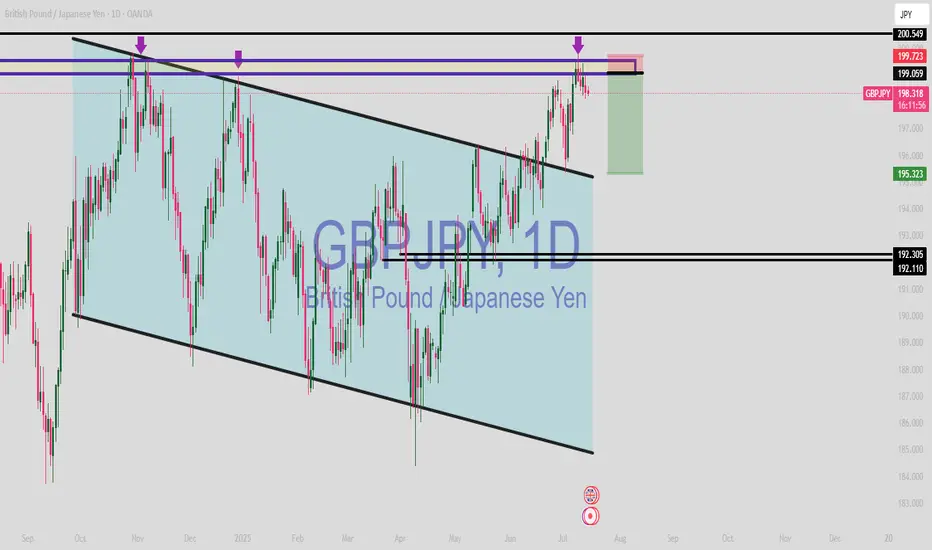
GBPJPY: Downside Pressure Increasing - Sell Opportunity!GBPJPY is showing clear signs of weakness, currently trading around 198.620. If it breaks and holds below 198.300, the bearish trend will be confirmed, with the next potential target at 192.000.
Upcoming key economic news from the UK (inflation, retail sales) and Japan (BOJ policy) will be decisive. Prioritize selling strategies, monitor news closely, and manage risk tightly.
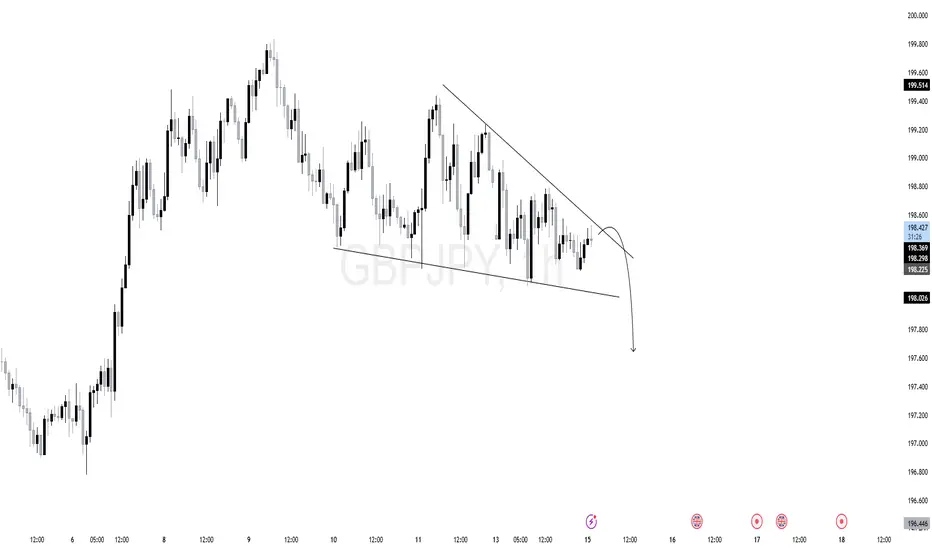
$GJ (GBPJPY) 1HPrice is currently forming a descending triangle pattern, with clear lower highs and a horizontal support zone.
Trendline resistance is actively being respected.
Liquidity is likely building below the horizontal support zone.
A false breakout or sweep above the trendline followed by rejection could trigger institutional distribution.
As long as the descending trendline holds, and no bullish BOS occurs, the structure remains bearish. Look for price to accumulate short positions before expansion.
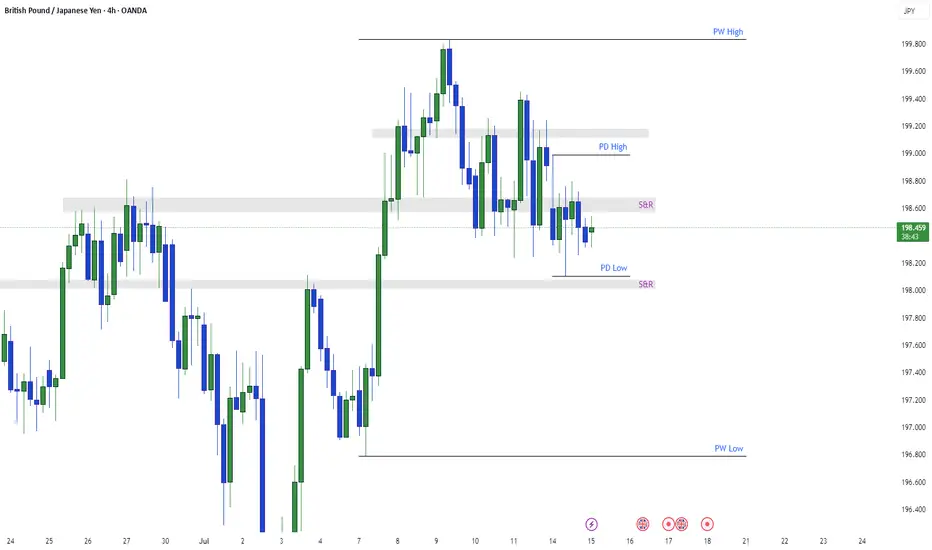
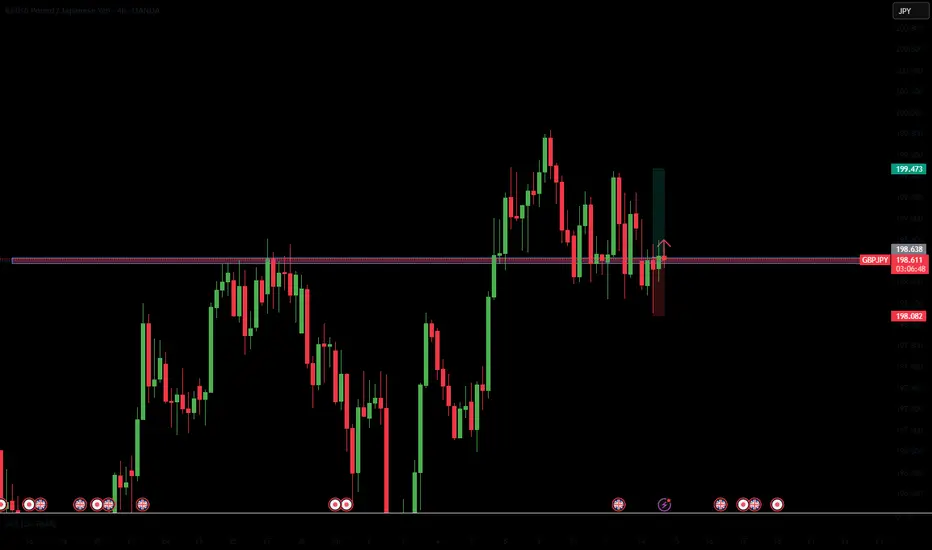
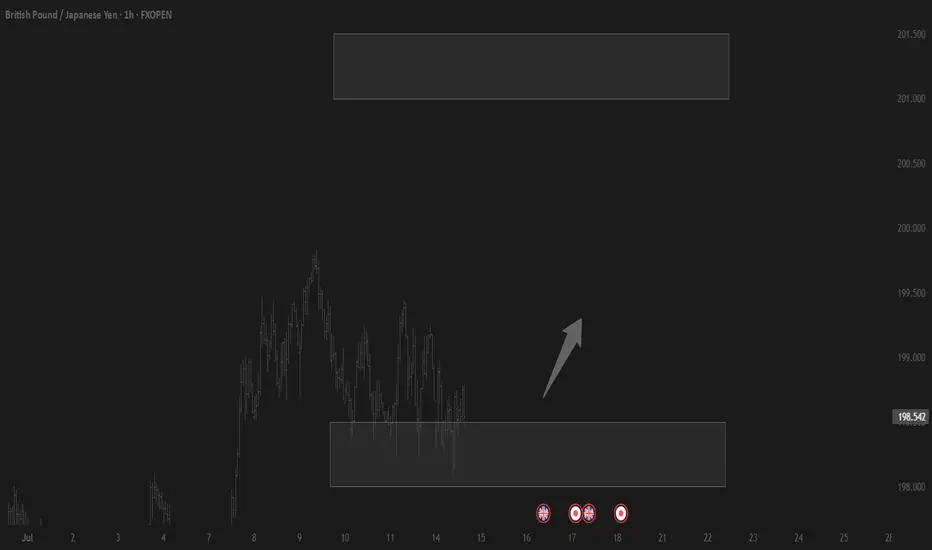
GBPJPY AccumulatingGBPJPY is building liquidity. We can see it around these zones. So trading between the zones will be wonderful. We can not say anything about the direction of GBPJPY right now because it is oscillating between the zones. The clear picture can be trade zones for scalping. No any potential move seen here.
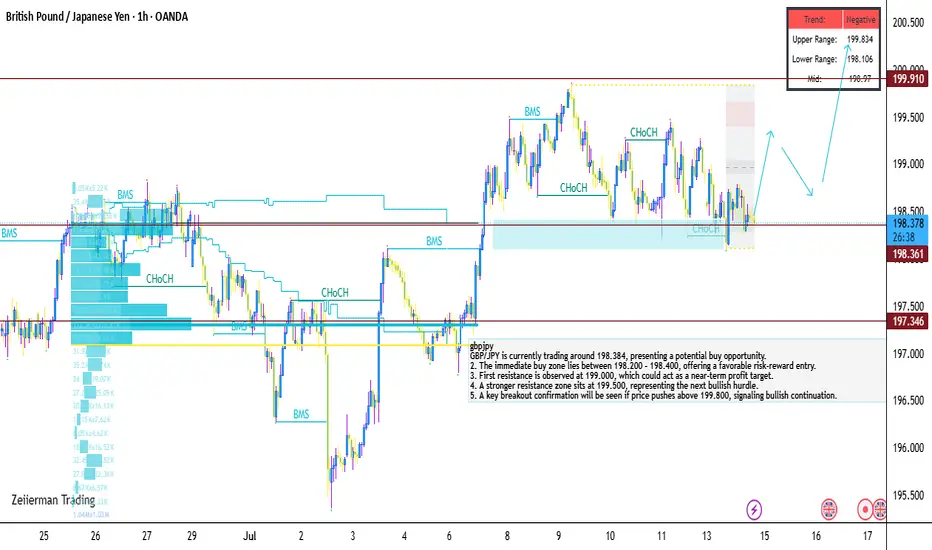
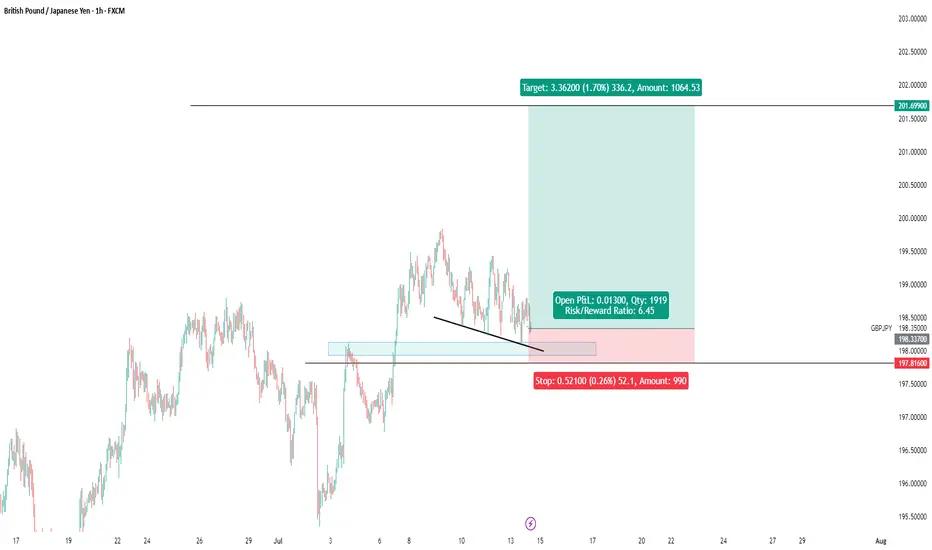
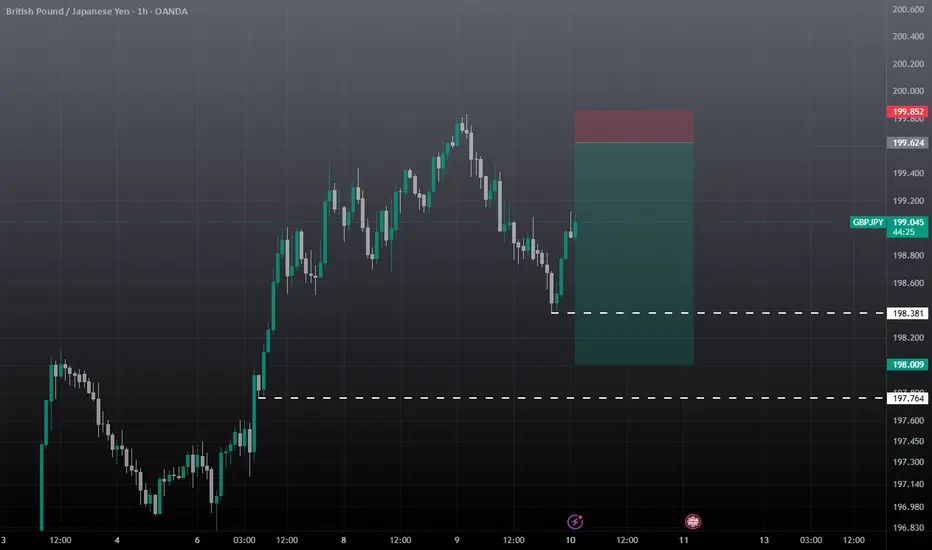
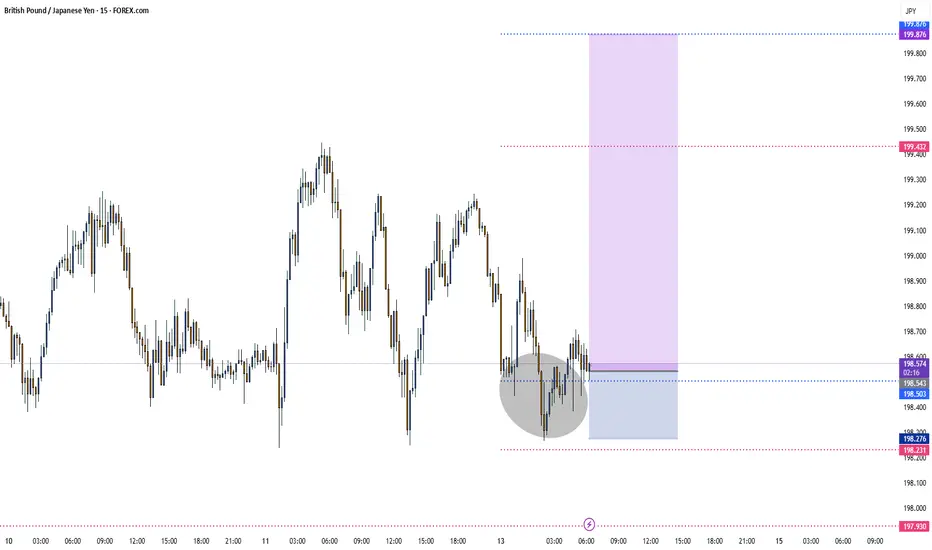
GBP/JPY is currently trading around 198.384, presenting a potentGBP/JPY is currently trading around 198.384, presenting a potential buy opportunity.
2. The immediate buy zone lies between 198.200 – 198.400, offering a favorable risk-reward entry.
3. First resistance is observed at 199.000, which could act as a near-term profit target.
4. A stronger resistance zone sits at 199.500, representing the next bullish hurdle.
5. A key breakout confirmation will be seen if price pushes above 199.800, signaling bullish continuation.
Place your stop-loss below 197.500, as a break below this level would invalidate the bullish setup.
7. The current setup suggests buyers are stepping in near 198.300, respecting the recent support base.
8. Momentum may build up toward 199.00+ if GBP remains strong or JPY weakens further.
9. Price consolidation above 198.50 would strengthen bullish conviction ahead of the breakout zone.
10. Overall, GBP/JPY remains bullish above 197.500, with upside potential toward 199.800 in the short term.
GBPJPY SELLView live British Pound / Japanese Yen chart to track latest price changes. Trade ideas, forecasts and market news are at your disposal as well.
eurnzd sell signal. Don't forget about stop-loss.
Write in the comments all your questions and instruments analysis of which you want to see.
Friends, push the like button, write a comment, and share with your mates - that would be the best THANK YOU.
P.S. I personally will open entry if the price will show it according to my strategy.
Always make your analysis before a trade
gbpjpy long Hi, I am a bit late but the probabilities are long because the daily trend is bullish and also in a good zone to buy on the level on the image ,of course you need to enter only after your entry pattern has been formed
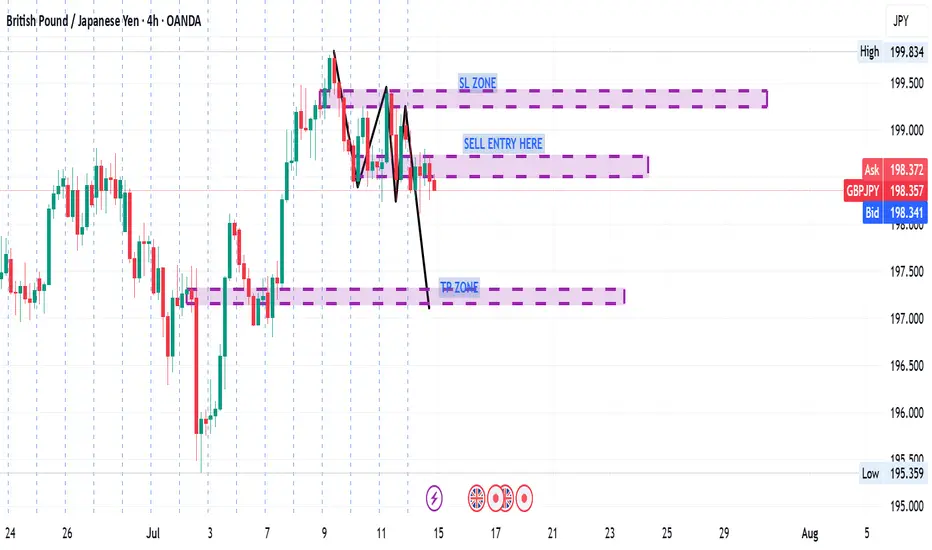
GBPJPY Swing Trade Setup, Sell, Short SetupA Good RR setup, wait for the entry, when price reaches the poi, look for any weakness ltf and then take trade, we are taking trade on 1hr, so for entry look for 5m tf. I will update the trade status where to take or not!
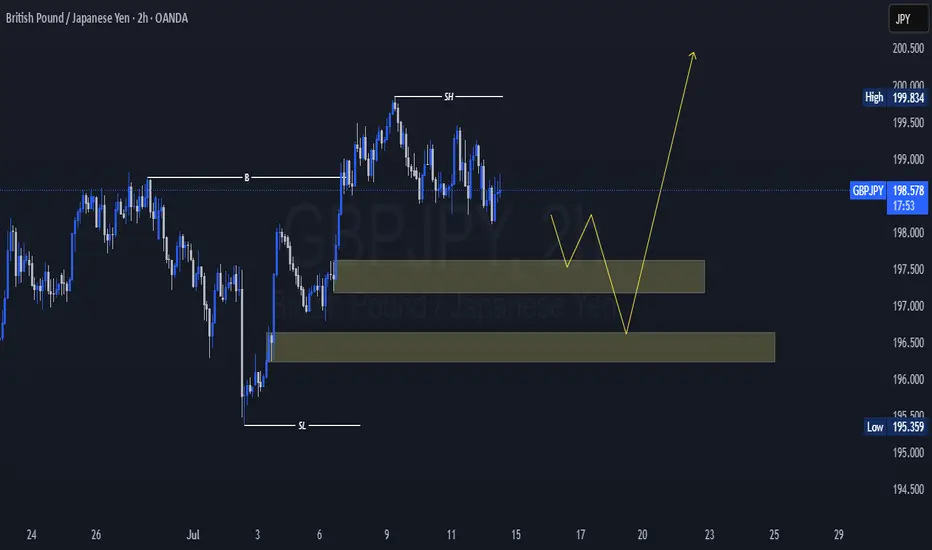
Trading balanceTrading balance The price of the asset has rebounded from the balance zone. With the prospect of growth into the resistance zone.
GBPJPY long Idea In HTF we can clearly see that GJ is in an uptrend, so after having done the last expansion, I am waiting for the retracement to the 50% Fibo zone where by coincidence there is an OB, the price will probably reject in that zone and later "attracted" by the OB which has a FVG in the 70.5% Fibo zone (which I call the "Gold Zone"), the price can retract to that zone and then continue with its uptrend.
GBPJPY SellThis currency pair is in a clear downtrend. The best idea is to sell at the moment of hitting the downtrend line.

7.14 GBP/JPY 4H LIVE TRADE UPDATENow that the swing low has been tested and broken we should see this market heading higher

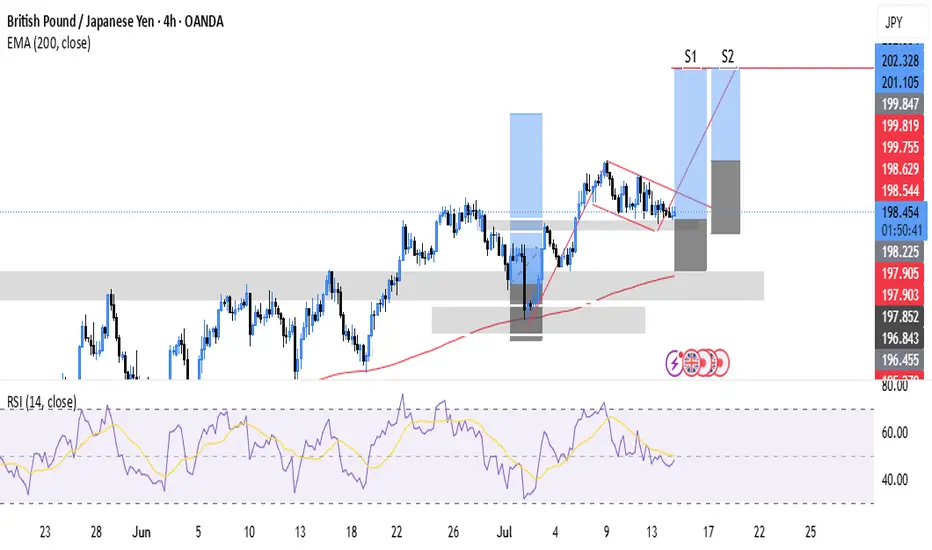
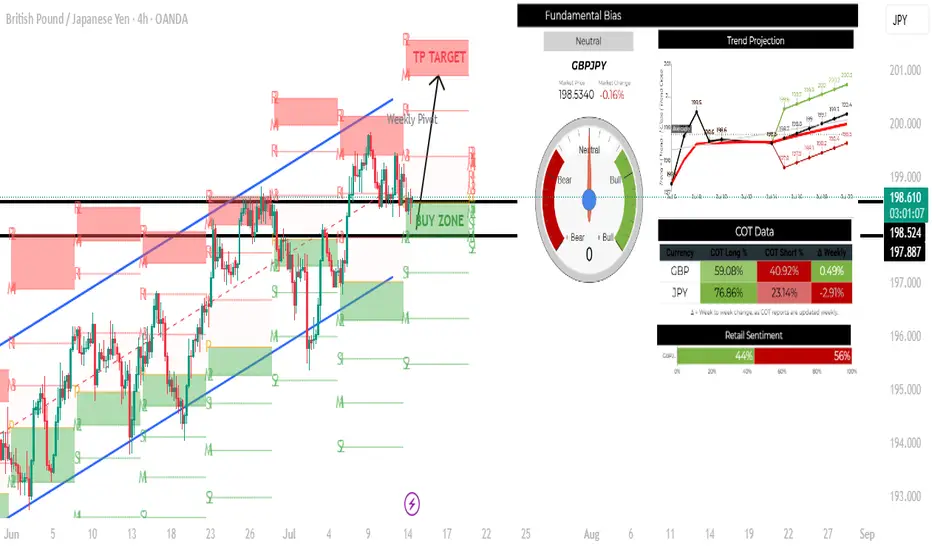
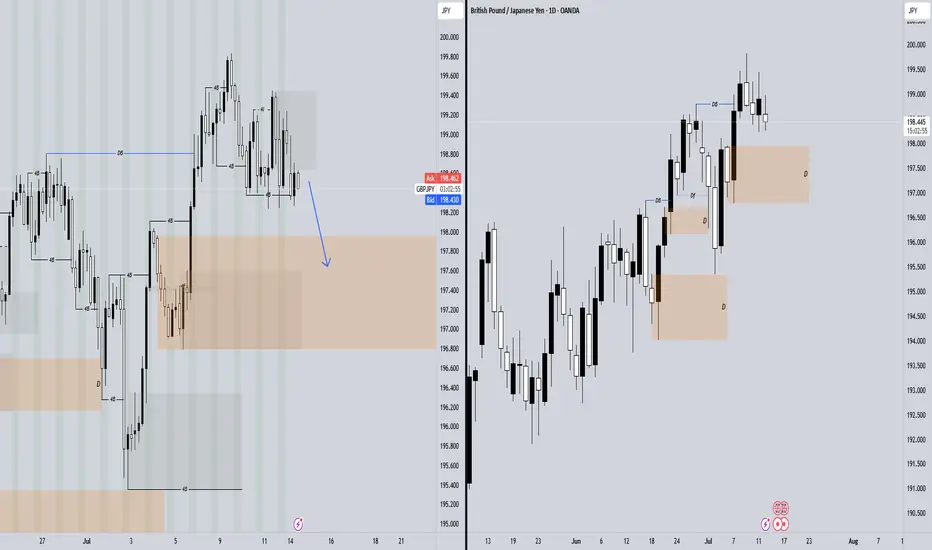
GBPJPY H4 LONG SETUP: 14-18 JULY 2025TECHNICAL ANALYSIS
This pair is bullish and its in a beautiful upward channel creating higher highs and higher lows. Price is currently in the weekly buy zone which is also the current support area. Bulls will be looking to go long here and hope to take price all the way to the projected take profit target.
FUNDAMENTAL ANALYSIS
The currency pair GBPJPY has a score of 2, indicating that the base currency is stronger than the quote currency. However, the pair shows neutrality with the trend projection being to the upside. COT shows institutional positioning is long both pairs, the market and price, however, is bullish.
BUYTrend Line Break
Previous Day Volume
Rejection Point
Untapped Order Point
Asian Session
High Structure Swing

GBPJPY BUY IDEAWe have 2 POI levels we are watching closely on this pair and we plan to react accordingly bases on priceaction on these levels.
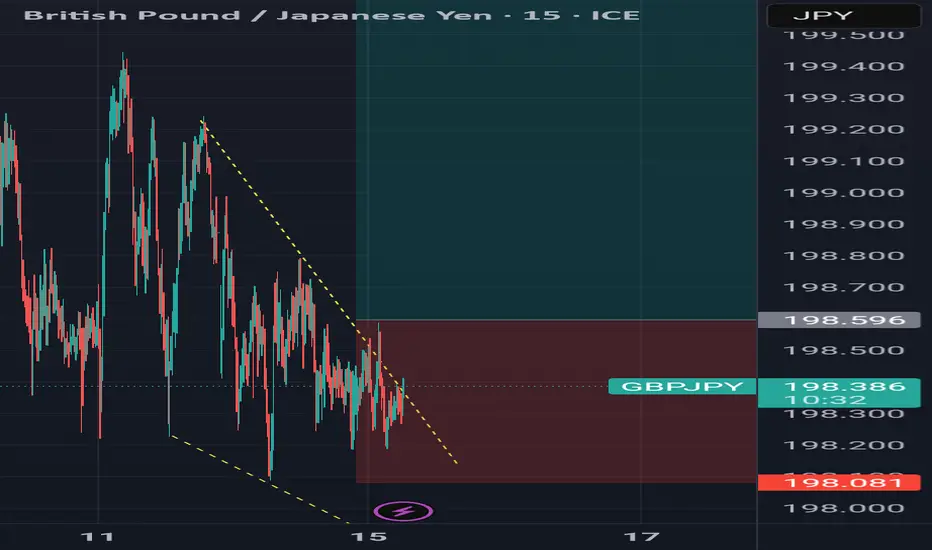
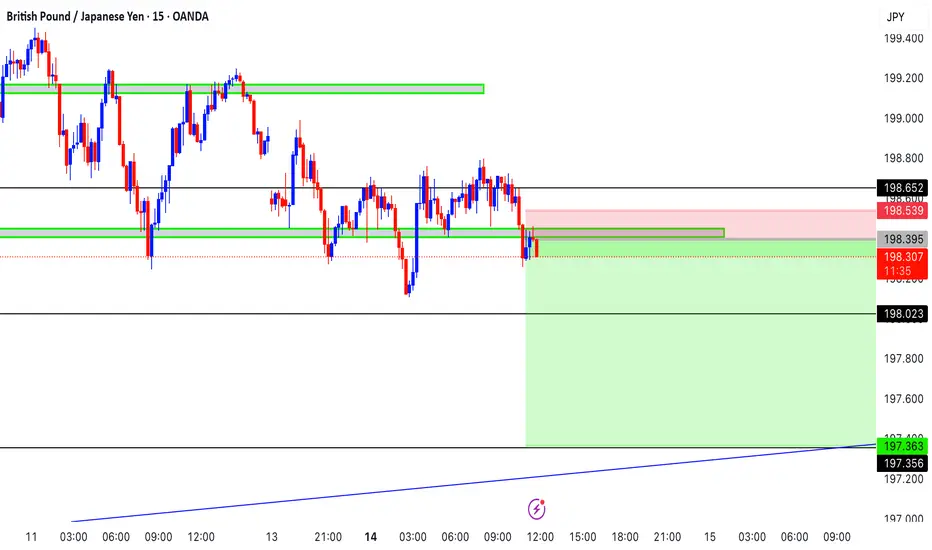
#GPBJPY bearish in 15Mwe have a downtrend line \
sell position @198.45
with clear stop @ 198.75
first target is 198.30
and next target is 197.40
we make the trilling stop after first part close
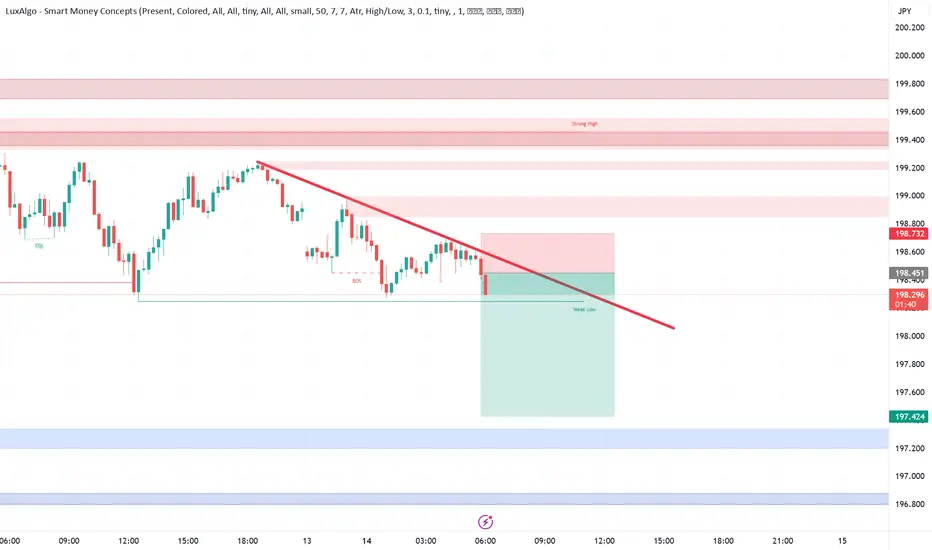
GJ Counter Pullback Likely to Daily DemandHello Traders,
On GJ, price remains in a daily counter-trend pullback phase. This has just been confirmed by a 4-hour break and close below the weak swing low (LL). To stay aligned with the overall bullish trend, I’m expecting a deeper pullback into the daily demand zone before price resumes its upward movement.
BUYTrend Line Break
Previous Day Volume
Rejection Point
Untapped Order Point
London Session
High Structure Swing
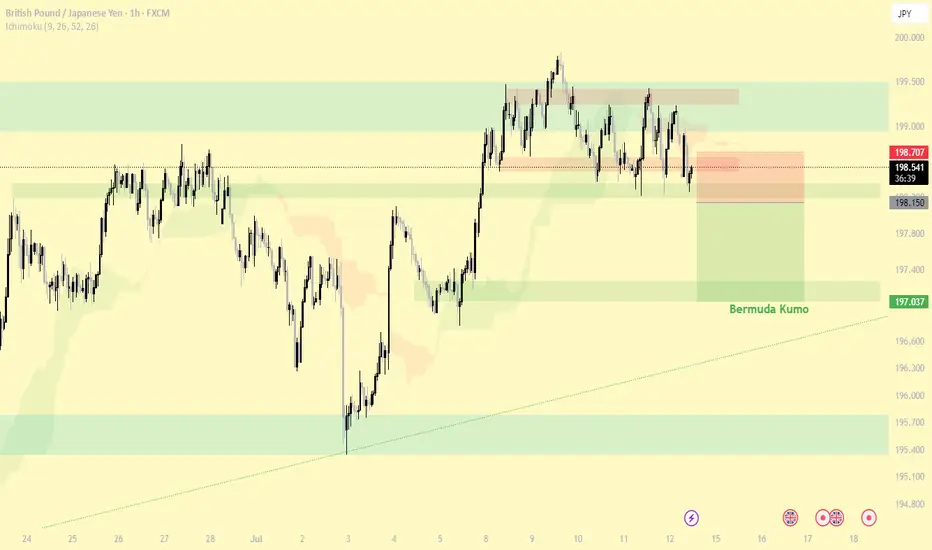
#GBP/JPY Monday 14 Jul 2025Reasons for entering the trade:
1- Breaking the last low of the high and the range area
2- Breaking the 4H support
3- Bermuda Kumo (4H)
Entry: 198.150
TP: 197.037
SL: 198.218