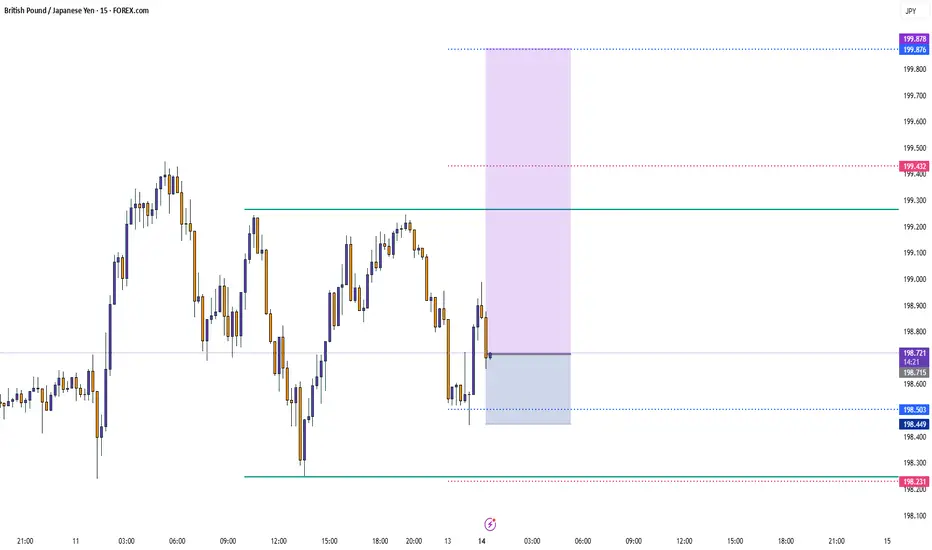
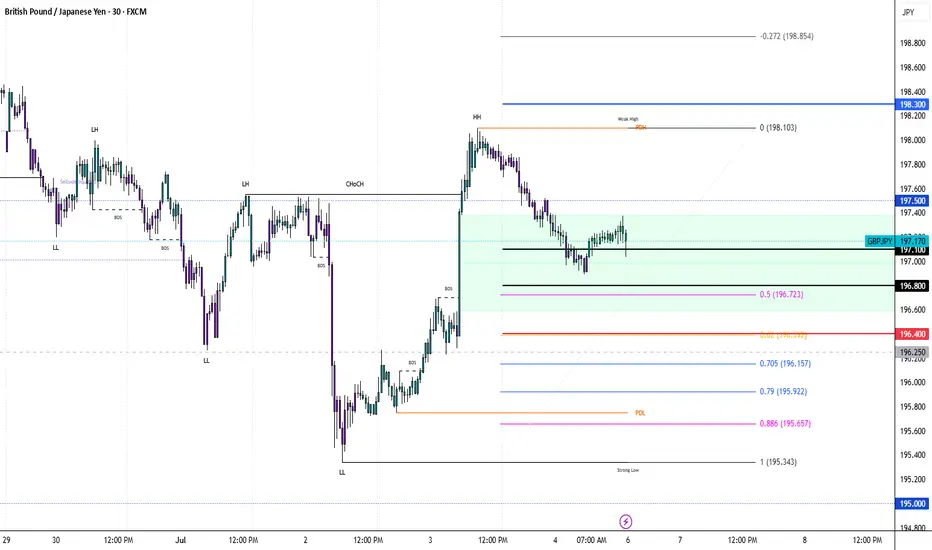
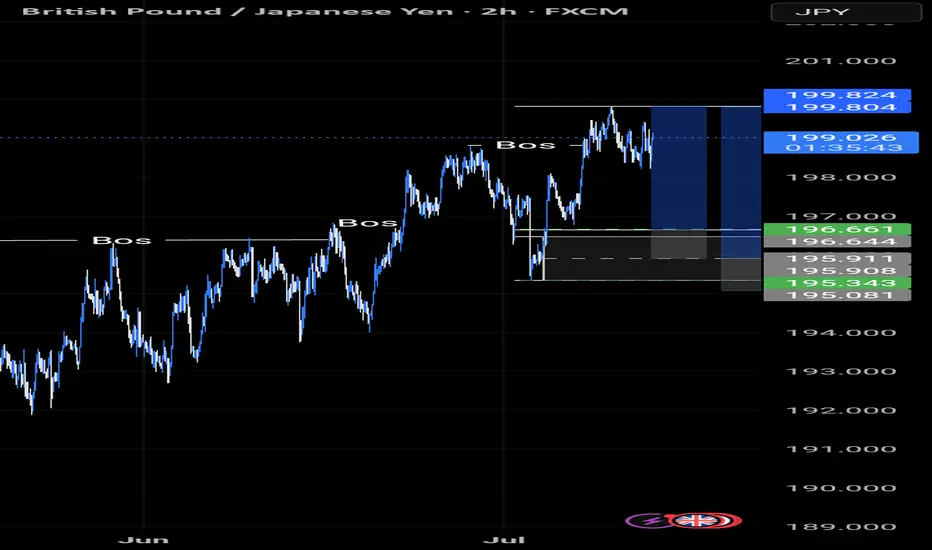
GBPJPY - Bullish BiasHTF Overview (4H): Price broke bullish structure with clean directional intent. Order flow remains aligned to the upside with no immediate signs of weakness.
MTF Refinement (30M): Zoomed into 30M for deeper structure clarity. Observing price actively reaching for sell-side liquidity (SSL) below a key low — a classic inducement setup forming.
Execution Plan: Waiting for a liquidity sweep below the SSL. Once swept, I’ll monitor the nearby 30M OB for mitigation. LTF confirmations (1M/5M CHoCH or BOS) will be needed before committing to a long entry.
Mindset: Patience over prediction — let liquidity do its job, then ride with smart money.
Bless Trading!
GBPJPY trade ideas
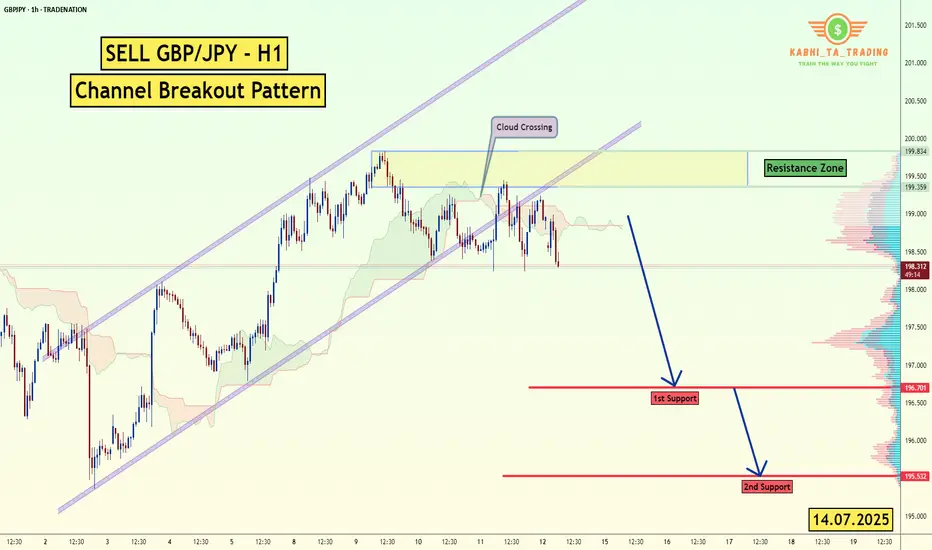
GBP/JPY -H1- Channel Breakout (14.07.2025)The GBP/JPY Pair on the H1 timeframe presents a Potential Selling Opportunity due to a recent Formation of a Channel Breakout Pattern. This suggests a shift in momentum towards the downside in the coming hours.
Possible Short Trade:
Entry: Consider Entering A Short Position around Trendline Of The Pattern.
Target Levels:
1st Support – 196.70
2nd Support – 195.53
🎁 Please hit the like button and
🎁 Leave a comment to support for My Post !
Your likes and comments are incredibly motivating and will encourage me to share more analysis with you.
Best Regards, KABHI_TA_TRADING
Thank you.
Disclosure: I am part of Trade Nation's Influencer program and receive a monthly fee for using their TradingView charts in my analysis.
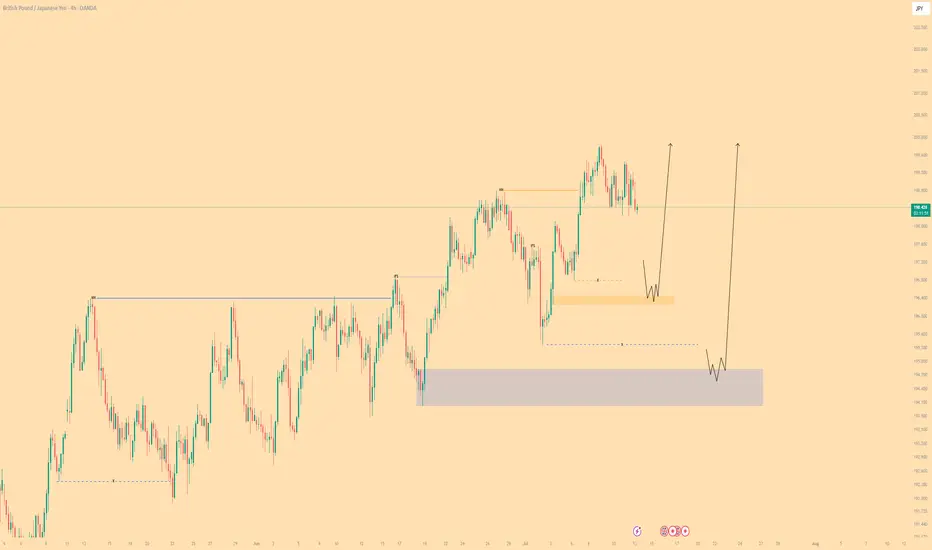
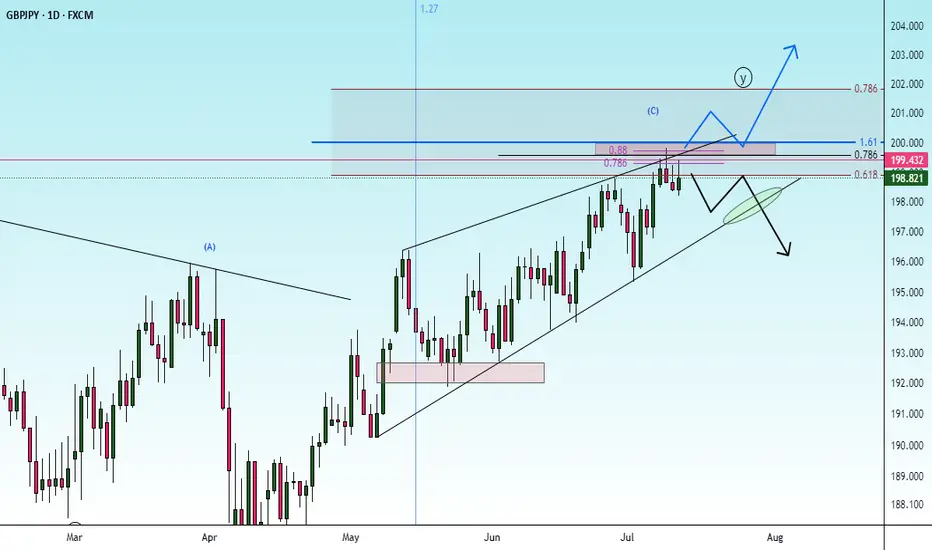
GBPJPY is still in retracementWe can see from the graph GBPJPY is oscillating between the two S&R levels. For today we expect GJ to touch the demand zone and then go higher. Therefore we can expect GBPJPY in go further down and hit the demand zone because it is still retracing. The possibilities for the GJ are shown.
BUYTrend Line Break
Previous Day Volume
Rejection Point
Untapped Order Point
Asian Session
High Structure Swing
Why election risk means yen volatility could rise this weekThe Japanese yen remains vulnerable ahead of Japan’s Upper House election on July 20.
Polls suggest the ruling LDP-Komeito coalition may lose its Upper House majority. Such an outcome would further weaken Prime Minister Shigeru Ishiba’s position, with his government already operating as a minority in the Lower House.
Adding to the pressure, the U.S. is set to impose 25% tariffs on Japanese goods from August 1—part of a broader protectionist push.
check the trendConsidering the price behavior in the current resistance area, possible scenarios have been identified.
If the price breaks through the resistance area, the continuation of the upward trend will be likely. Otherwise, a downward trend is possible with the support trend line broken.
GBP/JPY) Bearish Analysis Read The captionSMC trading point update
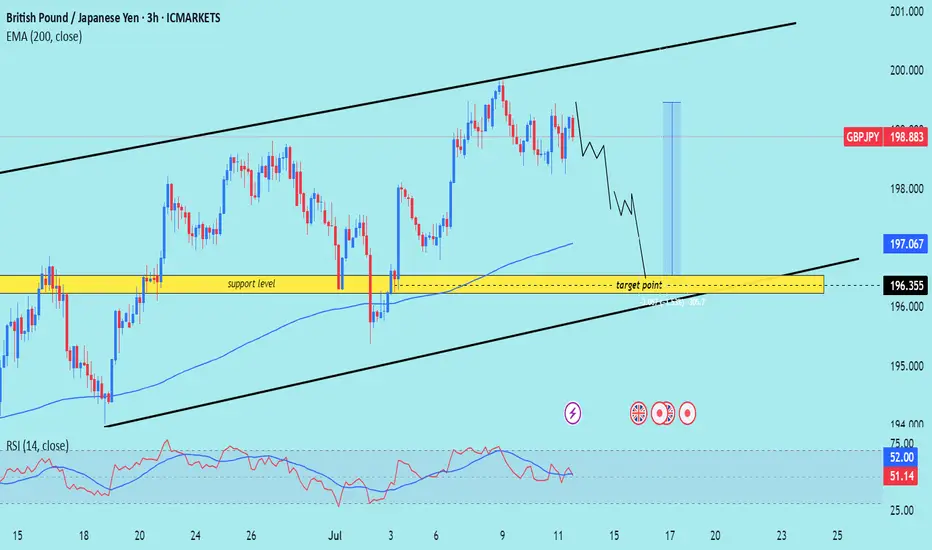
Technical analysis of GBP/JPY on the 3-hour timeframe, suggesting a potential short-term pullback within a larger ascending channel.
---
Analysis Summary
Pair: GBP/JPY
Timeframe: 3H
Current Price: 198.883
Bias: Bearish move toward channel support
---
Key Technical Insights
1. Ascending Channel Formation:
Price is moving within an upward-sloping channel.
Current structure suggests price is heading toward the lower trendline support.
2. Support Level & Target Zone:
The yellow zone around 196.355 is a major support area and target point, coinciding with both structural support and the bottom of the channel.
3. EMA (200 Close):
Price is still above the 200 EMA (197.067), so overall trend remains bullish — but current move is a correction.
4. RSI (14):
RSI is neutral near 51.14, allowing room for further downward movement before becoming oversold.
---
Target Point
Target: 196.355 (support zone and bottom of channel)
---
Trade Idea
Direction Entry Stop-Loss Target
Sell 198.80–199.00 Above 199.70 196.35
SMC trading point
---
Summary
GBP/JPY is likely to retrace toward support at 196.35 before possibly bouncing within the larger bullish structure. This offers a short-term selling opportunity, with potential buy setups near the lower trendline later.
Please support boost 🚀 this analysis)
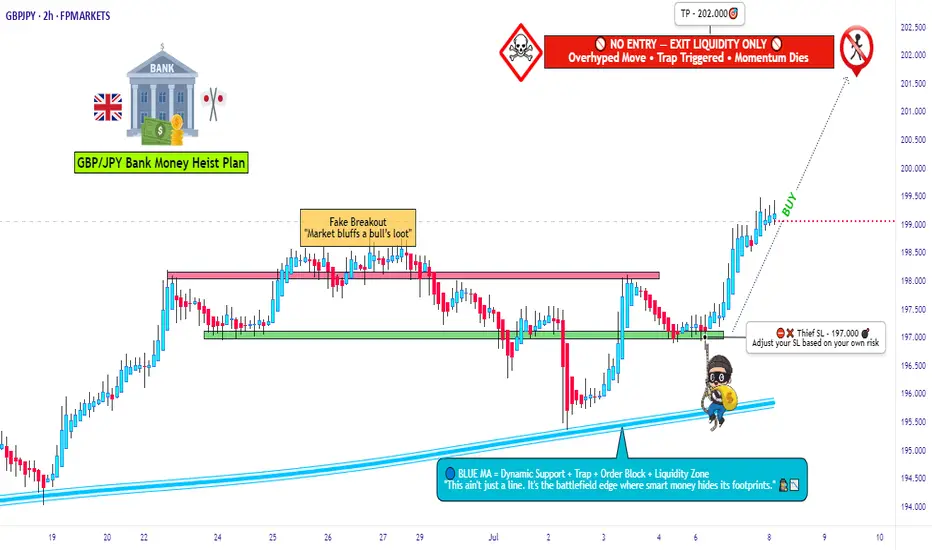
STEAL THIS TRADE! GBP/JPY Long Setup(Thief Trader’s Secret Plan)💰 Thief Trader’s GBP/JPY Heist Alert – Stealthy Long Setup Loading!
🌍 Greetings, Profit Raiders!
Hola, Konnichiwa, Ni Hao, Privyet, Hallo, Bonjour!
📢 Attention Market Bandits & Chart Pirates—the GBP/JPY Beast is ripe for plunder! Time to execute the next Thief Trader Masterplan.
🎯 Entry Zone – Loot the Dip!
Current price = Open vault. Fire longs now or snipe pullbacks (15M/30M charts recent swing low level).
Pro Thief Move: Stack buy limits near swing lows/highs. Chart alerts = your secret weapon. 🔫
🛑 Stop Loss – Guard the Treasure!
Swing Thieves: Hide SL below 2H swing low of candle wick @ (~197.000).
Day Raiders: Adjust SL to your risk size & order count. No free rides!
🎯 Profit Target – Escape with the Cash!
Take the 202.000 bag or exit early if momentum fades.
🔪 Scalpers vs. Swingers – Choose Your Weapon!
Scalpers (Quick Strikes): Longs only. No distractions.
Swing Traders (Patient Hunters): Trail stops & lock in gains.
🌪️ Market Pulse – Bullish Winds Blowing!
Price battling MA Resistance? No panic. Bulls still rule thanks to:
Fundamentals + Macro Trends
COT Data + Sentiment Shift
Quant Scores & Intermarket Alignments
(Check Linnkss for the full heist blueprint.)
⚠️ News Trap Warning!
Upcoming high-impact events? Freeze trades or tighten stops. Trailing SL = your escape route.
🚨 Join the Thief Trading Crew!
Like 👍 or Boost 🚀 this idea to fuel our next raid.
Thief Trader Tactics = Daily Market Domination. Your support keeps the heists alive! 💰❤️
🤑 Stay Locked In – The Next Big Score is Coming…
Timing is everything. Watch the charts. Strike hard. Exit smarter.
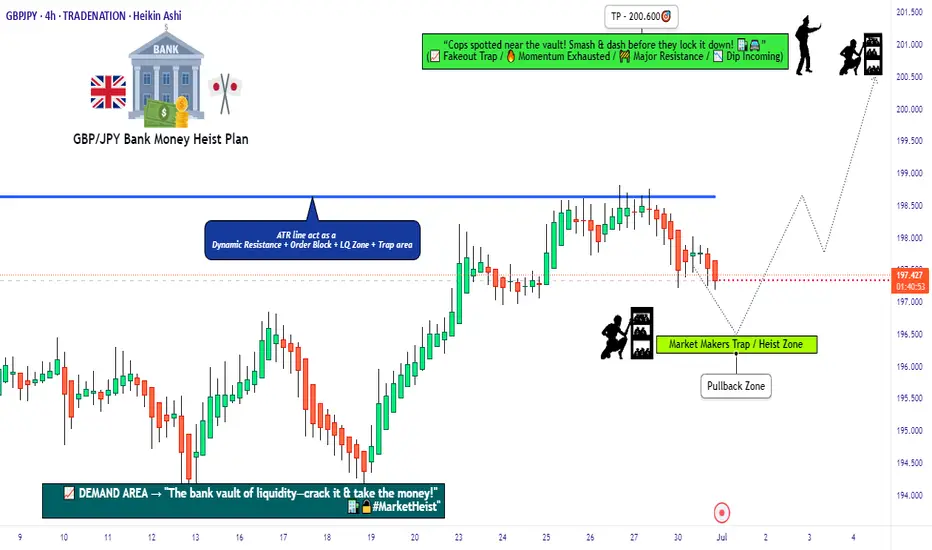
"GBP/JPY: High-Risk Pips Grab – Escape Before Cops! 🏴☠️ GBP/JPY "Dragon Heist" – Bulletproof Bullish Raid (High-Risk, High-Reward) 🚨
🔥 Attention Market Pirates & Profit Raiders! 🔥
(Day/Swing Trade Plan – Long Entry Focused)
🔑 Entry Zone (Vault Cracked!):
"The Dragon’s loot is unguarded! Bullish pullback = prime stealing opportunity."
Buy Limit Orders: Layer entries near 15M/30M swing lows (wick/body). DCA-friendly!
Thief Pro Tip: Scalpers ride long-only waves. Swing traders? Stack slowly, escape rich.
🎯 Target (Escape Routes):
200.600 (or bail early if cops (resistance) swarm!)
🚨 Red Zone = High-Risk Take-Profit (Overbought? Reversal? Police (bears) lurk here!)
⛔ Stop Loss (Emergency Exit):
4H Swing Low/High (Wick-based) – Adjust for risk/lot size!
No martyr trades! SL = your heist survival kit.
📢 Breaking News (Fundamental Edge):
Dragon’s bullish fuel? Macro data, COT reports, sentiment—CHEK THE LIiNKk 👉🔗 (Don’t skip homework!)
💣 Trading Alerts:
News = Landmines! Avoid new trades during releases.
Trailing SL = Your Getaway Car (Lock profits, dodge volatility.)
💥 Boost This Heist!
Smash 👍, hit 🔔, and fund our next raid! Every boost = more stolen pips for the crew.
Stay tuned—another heist drops soon! 🤑 #ForexBandits
GBPJPY buy trade hit take profit Congrats to BALE_FX vips membrs
We hit take profit Wednesday last week ...
GBPJPY buy trade profit hit Congratulations to those of us that took this trade we just hit take profit now
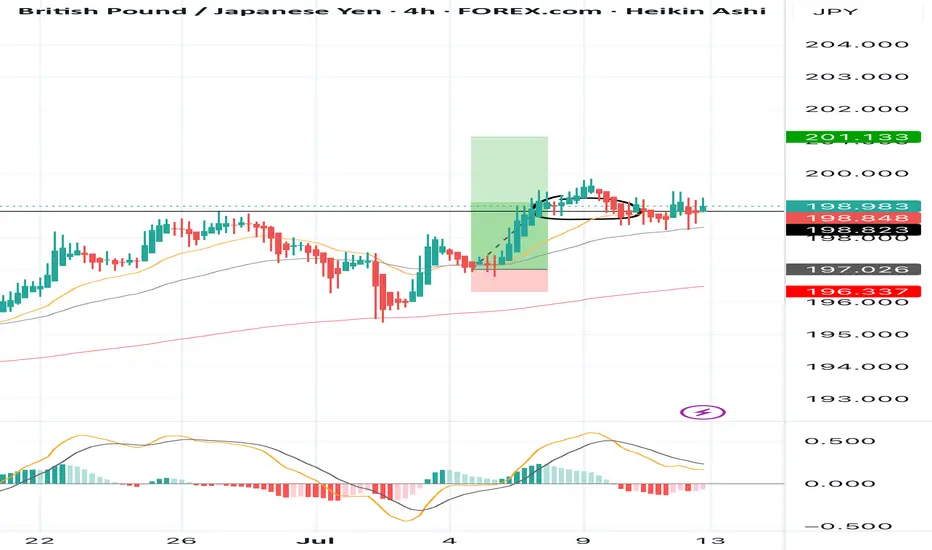
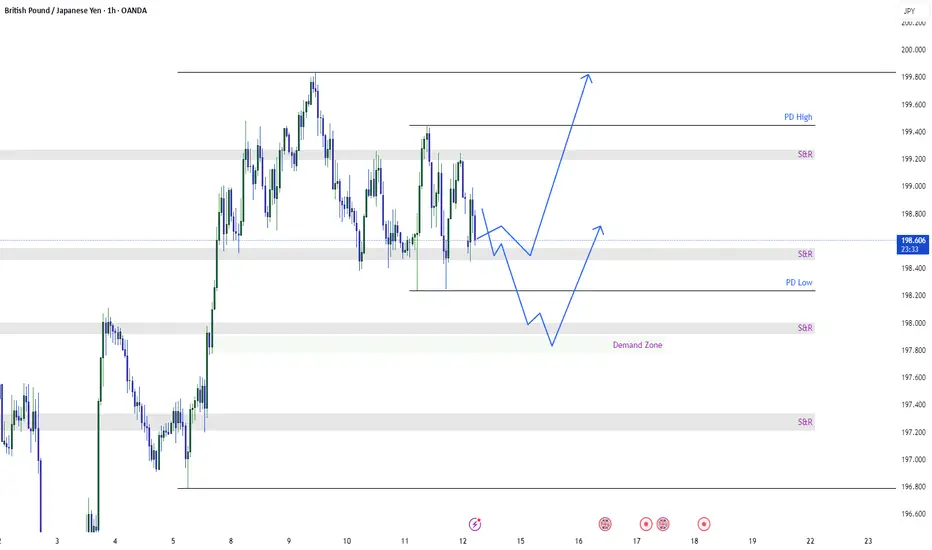
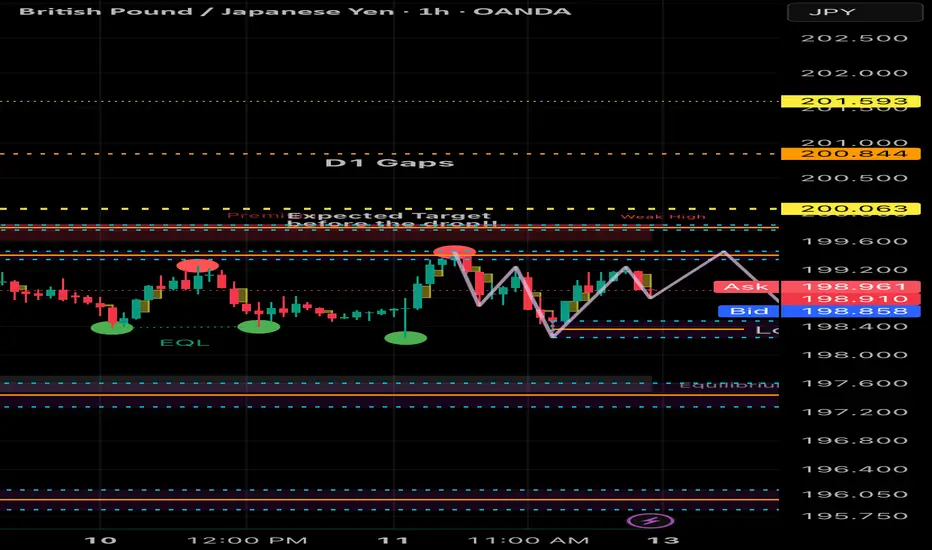
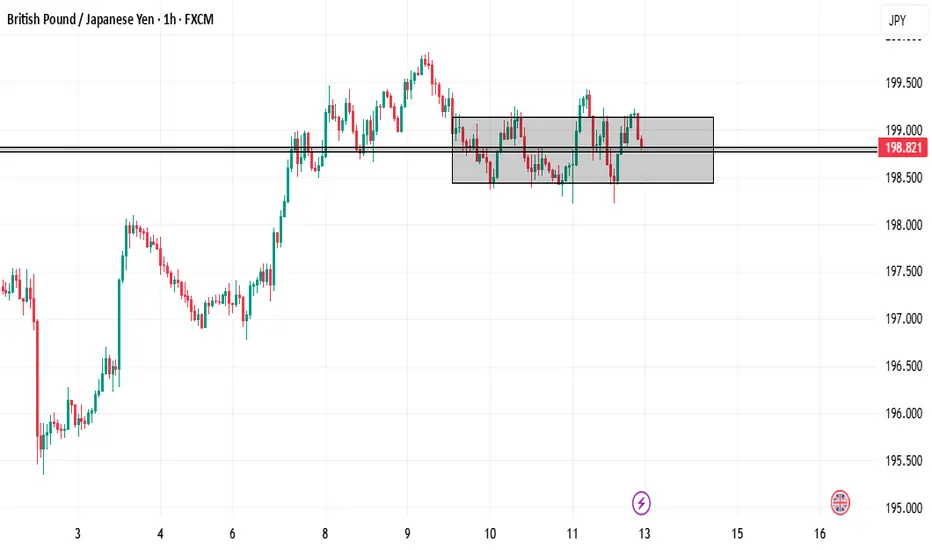
GBPJPY: floating at the top – is a drop being loaded?GBPJPY is hovering around 198.91 after an impressive rally, but now it's trapped between two key zones: 199.85 – a resistance level that keeps rejecting price, and 198.20 – a fragile support below. The price action reveals a tense sideways pattern, like a spring coiling up before release.
What’s concerning is that buyers have attempted to break above the high multiple times and failed – and each failure comes with weaker rebounds. With the Bank of England shifting toward a “pause” stance and the yen gaining mild support from rising risk-off sentiment, the market is starting to lean toward a correction.
If price breaks below 198.20, it could mark the beginning of a deeper slide back toward the lower boundary of the channel. Don’t be fooled by the silence – sometimes, calm is the precursor to a sharp fall.
GBP/JPY - Potential TargetsDear Friends in Trading,
How I see it,
PIVOT @ 195.650
Psychological Resistance @ 200.000
1) Daily bull trend intact at this time
2) Resistance has the potential to force a correction
3) As long as price remains above PIVOT, bullish potential
remains high.
Keynote:
Monitor price action at your daily trend closely in case of a correction.
I sincerely hope my point of view offers a valued insight.
Thank you for taking the time to study my analysis.

I expect liquidity grab up a bit GJ can make some liquidity grab up to 199.4ish region and reject for a move down to 197.3 region based on 1HR chart..
But overall trend is still bullish .
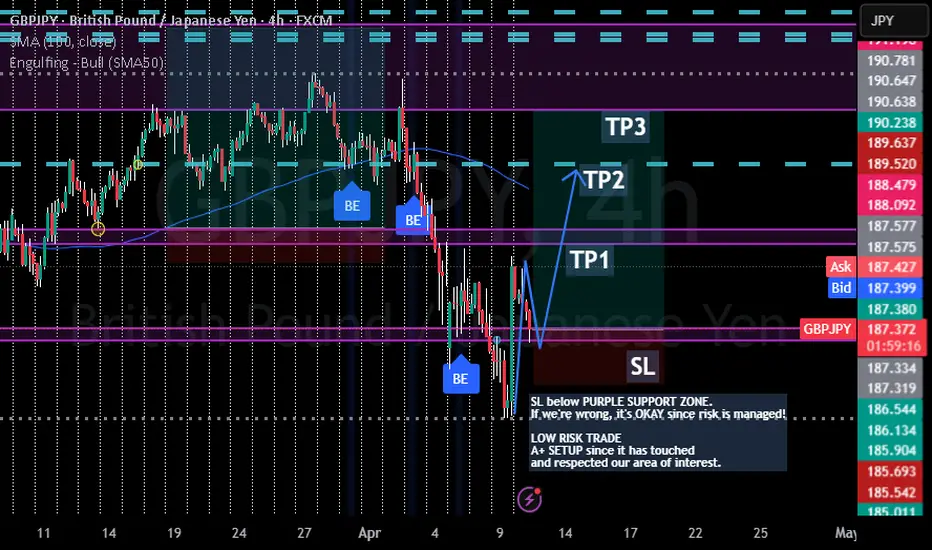
GBP/JPY Low Risk BUYS - SWINGLOW RISK TRADE
If you prefer not to swing you can scalp buys on the pullbacks throughout the week ahead.
GBP/JPY - BULLISH ENGULFING CONFIRMED
A+ SETUP since it has touched
and respected our area of interest.
SL - 185.599
TP1 - 190
TP2 - 192.799
TP3 - 194.681
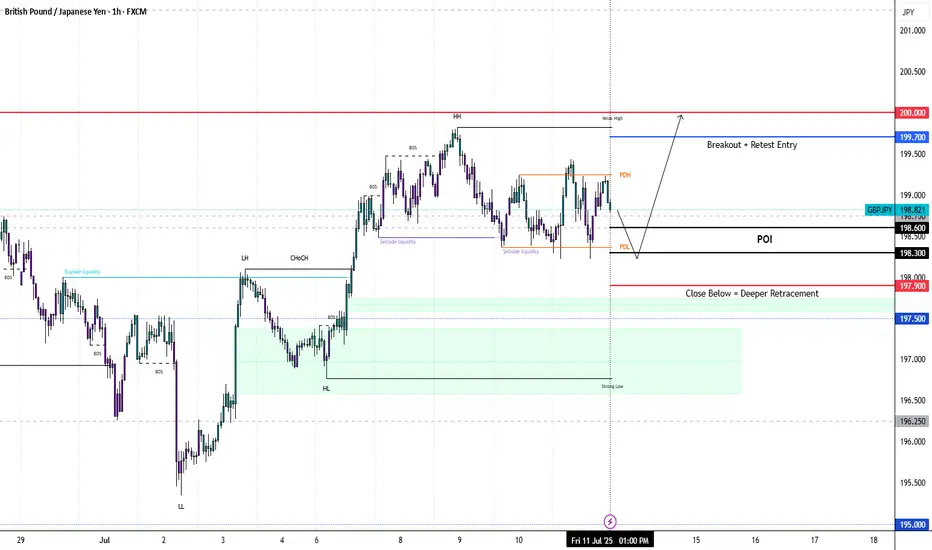
GBPJPY: Bullish Structure Still IntactGJ created a new HH then turned sideways. More consolidation or a deeper pull back could be seen before the next rally.
Last BOS: Break above 199.70 → confirmed bullish strength
H4 Demand Zone (Pullback): 198.30–198.60
Liquidity Above: Clean pools at 200.30 – 200.70
H1 Key Zone: 198.60–198.90 (H1 OB + unfilled FVG) → currently being tested.
Momentum Trigger: BOS above 199.30 to confirm buyers stepping back in.
M15 Micro-Structure: Slightly bearish (short-term), sweeping liquidity under 198.80.
What to Watch: M15 bullish BOS above 199.10–199.30 for intraday buy confirmation.
🟢Entry Zone 198.30 – 198.60
SL 197.90
TP1 199.70
TP2 200.30
TP3 201.00
❌ Bullish Invalidation
H1 close below 197.90 → bullish bias neutralized, expect deeper retrace into 197.20 – 197.50.
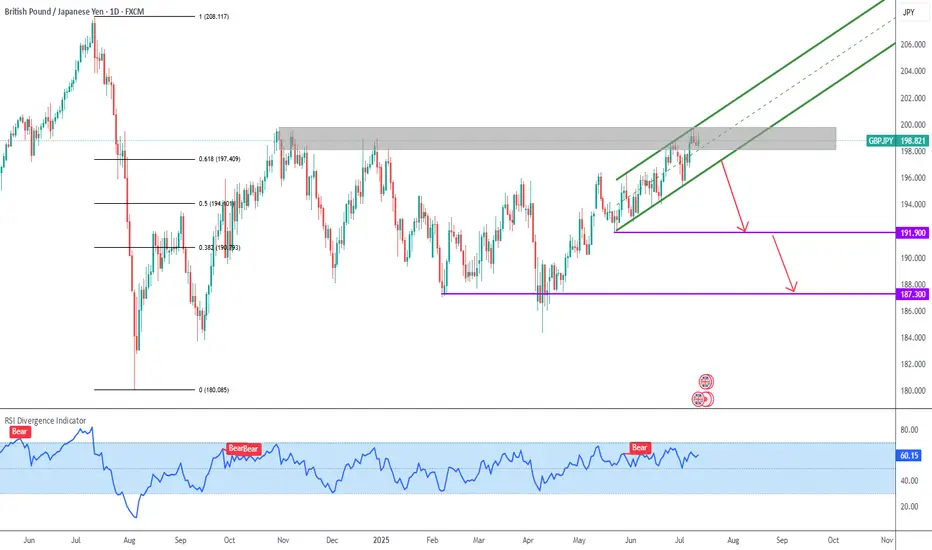
GBPJPY Ascending Channel
The grind to the upside is losing strength, and I´m waiting for a break of the green ascending channel to the downside.
Initial targets are the base of the ascending channel (at 191.900) and close to the recent pivot low (at 187.300)
GBPJPY SELL IDEA- Weekly chart - Price reached an ATH on the weekly and closed below the major resistance with upward wick rejections - Signal for a downtrend for the new week
- Daily chart - The Last two daily closes (Thurs & Fri) were an inverse bearish pin bar and a weak bullish candle with upward wick rejections
- H4 Chart - Consolidating at the major resistance, but last highs were LHs and LLs
- H1 Chart - Consolidating at the major resistance, but last highs were LHs and LLs
Entry for sells would be break out of the consolidation on H4 and retest on lower Tfs - H1, M30 and M15
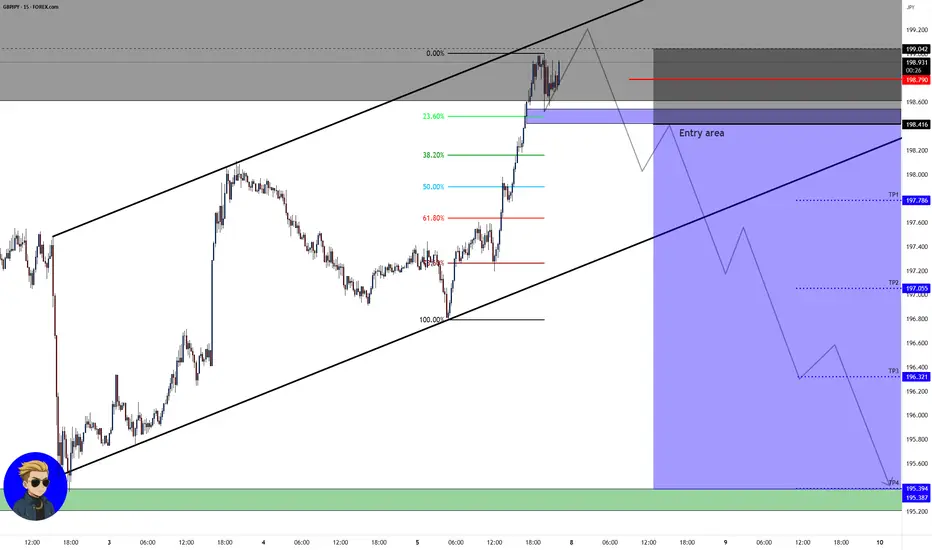
GBP/JPY💰Symbol: { GBP/JPY }
🟩Price: { 198.416 }
🟥Stop: { 199.042 }
1️⃣profit: { 197.786 }
2️⃣profit: { 197.055 }
3️⃣profit: { 196.321 }
4️⃣profit: { 195.394 }
📊Check your chart before entering.
🚨Check before use to make sure there is no important news.🚨
GBPJPY: Still BullishPrice has pulled back and is currently reacting to H1 OB at 197.00–197.20
* FVG Support: Between 196.80–197.10
* Watch for: Bullish BOS above 197.50 to confirm buyers stepping back in
* Confirmation Needed: M15 bullish BOS above 197.50–197.60 for buy entry
🟢Entry: 196.80 – 197.10
Stop Loss: 196.4
TP1: 198
TP2: 198.6
TP3: 200
Breakout Option: If price pushes above 198.30 (M15 BOS + retest), you can enter.
❌ Bullish Bias Invalidation
H1 close below 196.40 → signals potential deeper retracement
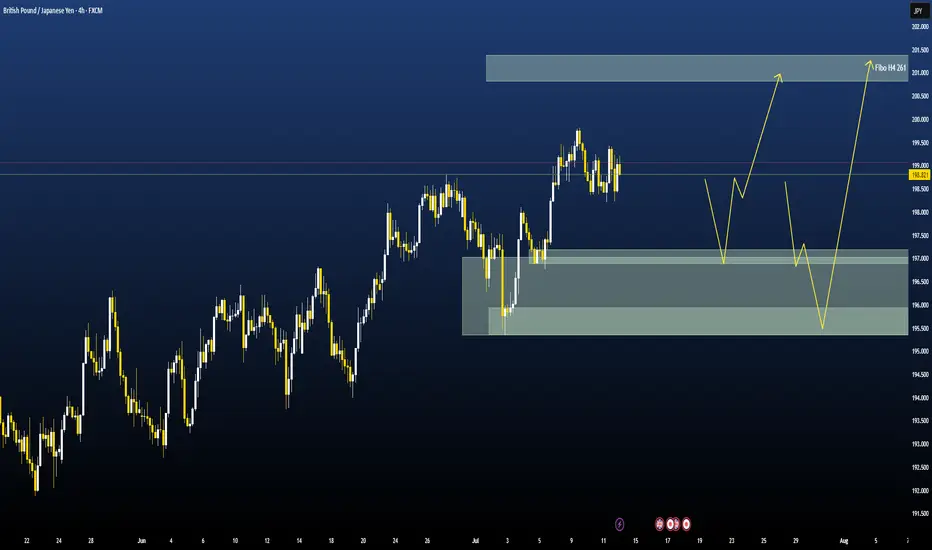
GBPJPY TRADE IDEA We are looking at a potential trade to the upside on GBPJPY.
Like always, we await a pullback to our Fibonacci level for a continuation trade.
Let's see how the market plays out.
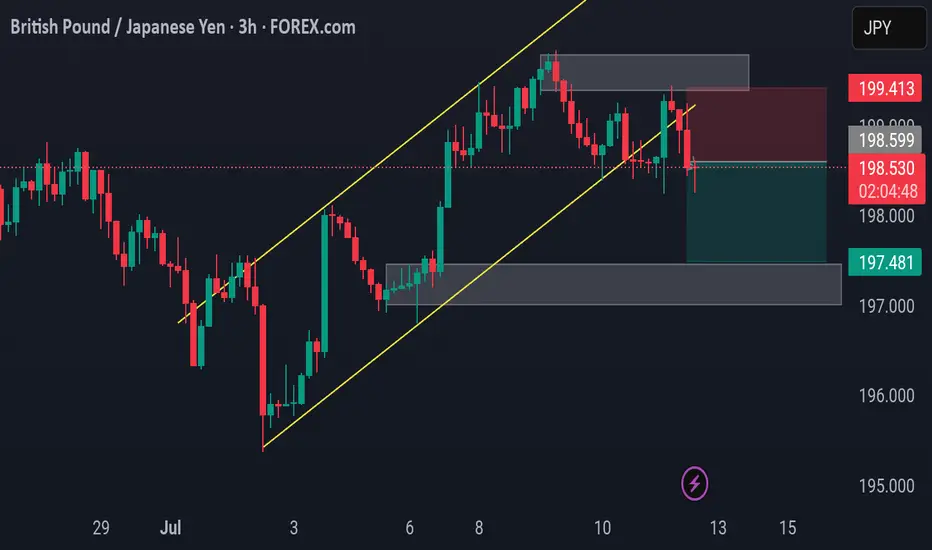
GBP/JPY – Channel Break and Bearish Rejection
🔹 3H Chart by PULSETRADESFX
After a strong bullish trend within a rising channel, GBP/JPY has now broken structure to the downside. Price rejected the resistance zone around 198.599 – 199.413, followed by a sharp bearish candle close beneath the ascending trendline support.
This signals a shift in market sentiment, with sellers taking control and aiming for the next demand level at 197.481.
📌 Trade Breakdown:
Entry: 198.536
Stop Loss: 199.413 (Above supply)
Target: 197.481 (Major demand zone)
A classic break-retest-drop setup is in play here. Unless price reclaims 199.00+ with volume, this short bias remains valid.
---
✅ Key Confluences:
Rising channel break
Supply zone rejection
Bearish momentum confirmation
Risk-to-reward > 1:2 setup
📅 July 11, 2025
📊 Forex.com Feed via TradingView
#GBPJPY #ForexAnalysis #PriceAction #BearishSetup #SupplyZone #TechnicalAnalysis #TradingView #PULSETRADESFX
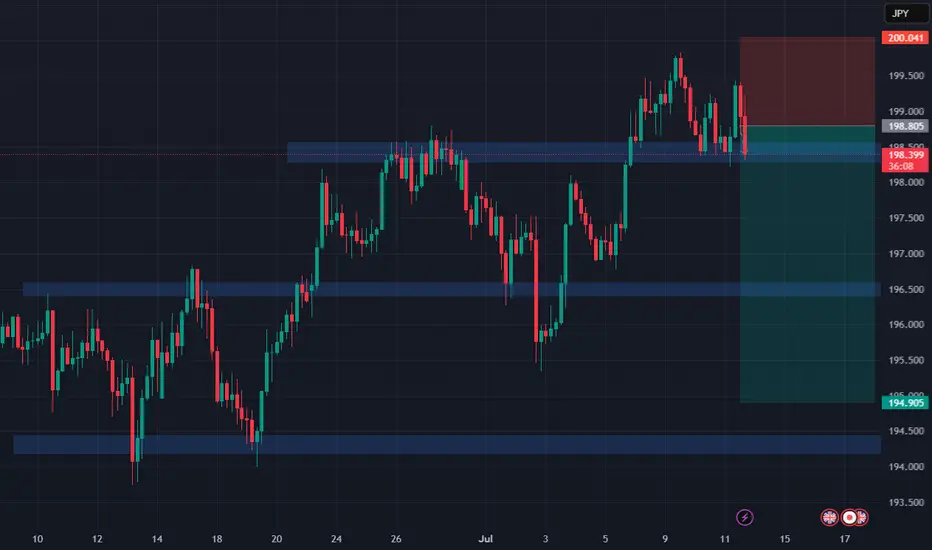
GBPJPY Forecast (4H Chart) SELL!Price rejected the 199.2 resistance and is now retesting the supply zone (~198.6). Lower highs forming, signaling potential downside continuation.
🔮 Forecast: Bearish
📍 Signal: Sell below 198.600
🎯 TP: 194.900
⛔ SL: 200.050