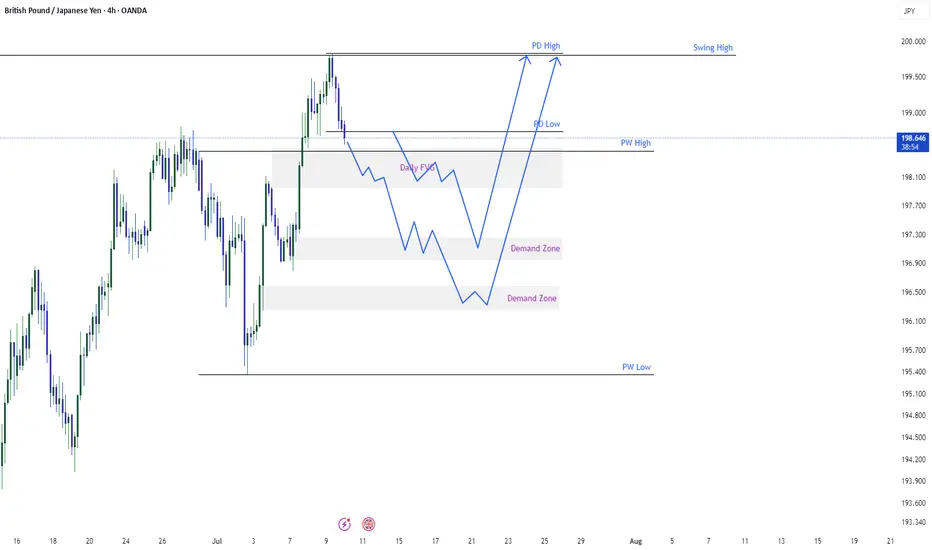
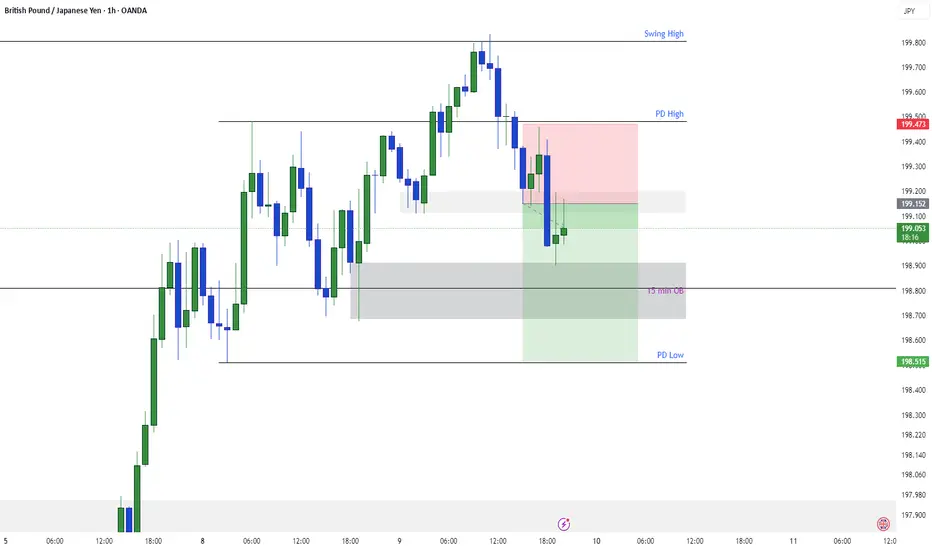
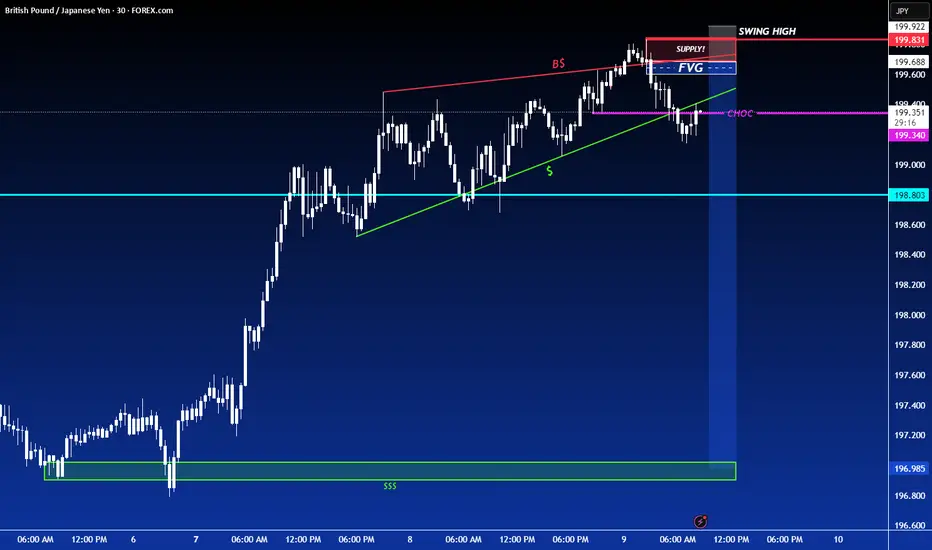
GBPJPY Profit TakingGBPJPY has given strong bullish momentum and hit swing high on previous day currently the traders are taking profit and GBPJPY is giving a pullback. We can see from the picture that there is fair value gap and demand zones. The possible move for GBPJPY will be to hit demand zones and again follow the same bullish momentum.
GBPJPY trade ideas
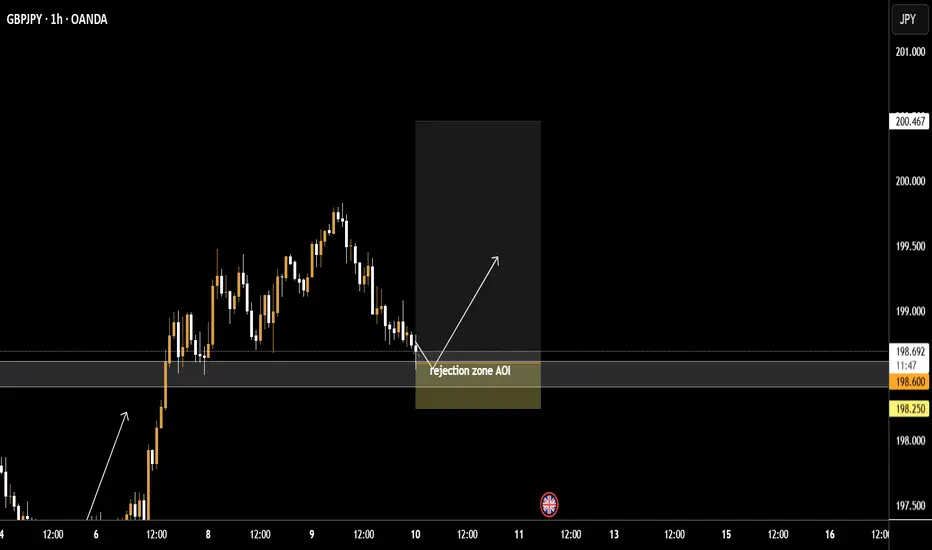
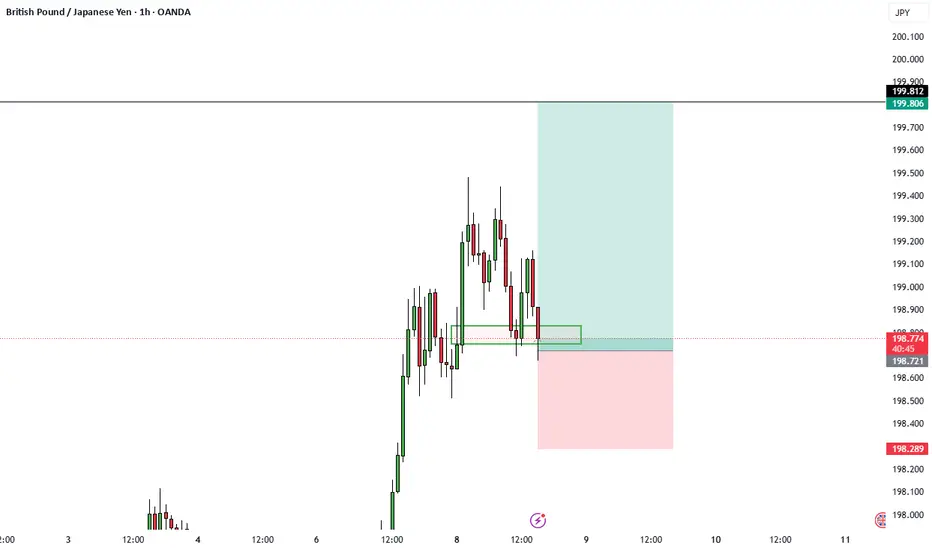
IDEA TRADE GBPJPY LONG POSITION Hi Traders
Pair: GBPJPY
📈 Position: LONG (BUY)
✅ Entry: 198.600
🔺 SL: 198.250 (-35 pips )
🎯 Take Profits:
• TP 1: 198.950
• TP 2: 199.300
• TP 3: 199.650 Trailing SL)
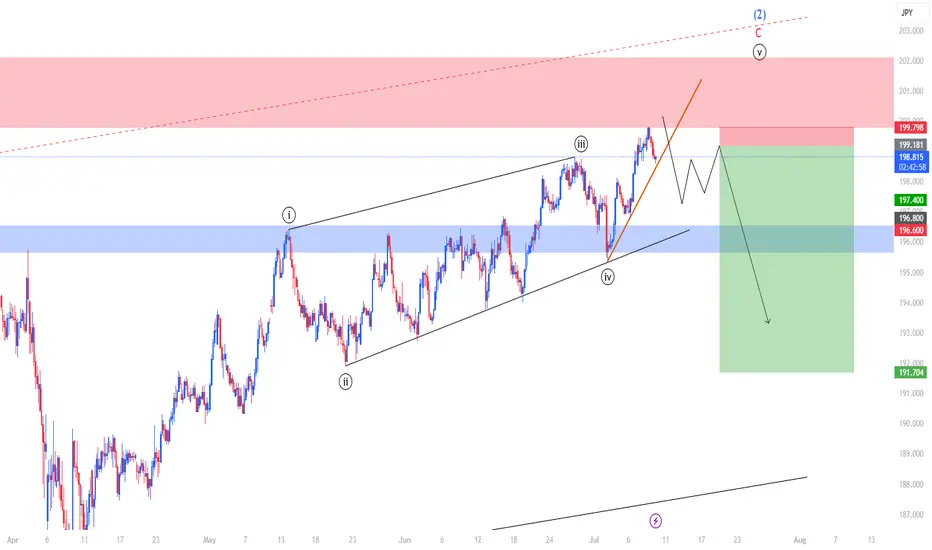
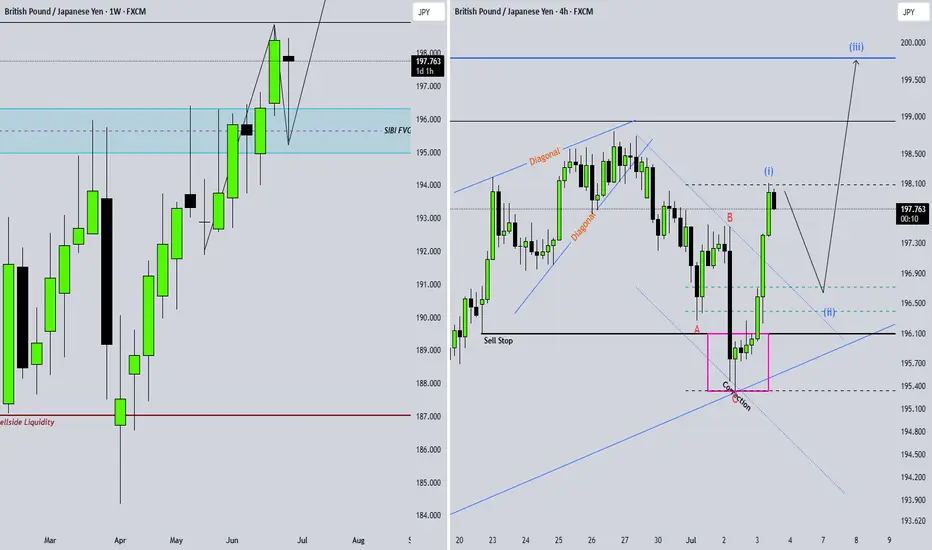
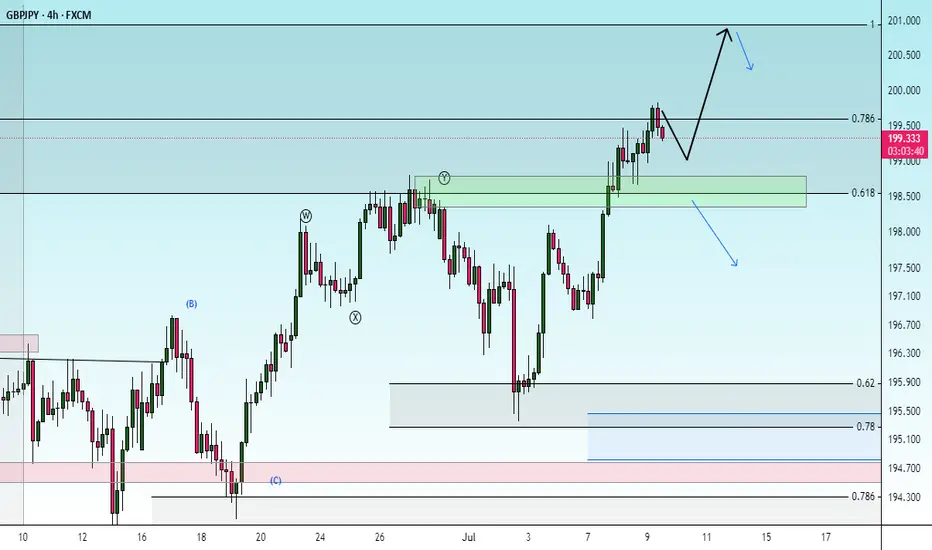
My View On GBP/JPYWhy I think the tops in
Elliott Wave Structure Completed
We’re now at the conclusion of a 5‑wave impulse (i→v) that tops off within wave (1), followed by an A‑B‑C corrective sequence. Wave C peaks right inside a major supply zone — classic exhaustion of bullish momentum.
Resistance & Trendline Rejection
Price hit a red supply/resistance area, tested it, and has already broken back below the short‑term upward trendline. That break is a reliable early signal that the uptrend is losing steam.
Bearish Continuation Pattern Forming
The drawn schematic suggests a sequence of lower highs is setting up—then a break toward the blue support zone near 196.60–197.40. All signs point to a deeper correction or even a fresh downtrend for wave (3).
Technical Confluence at Wave (2)
Wave (2) ends within multiple layers of resistance: a price zone, a wave count, and a rising wedge. Combined, this quadruple confluence is a textbook reversal scenario.
Macro factors support a top:
Central bank divergence is flattening
Yen may rebound on global uncertainty
Sterling faces domestic fragility
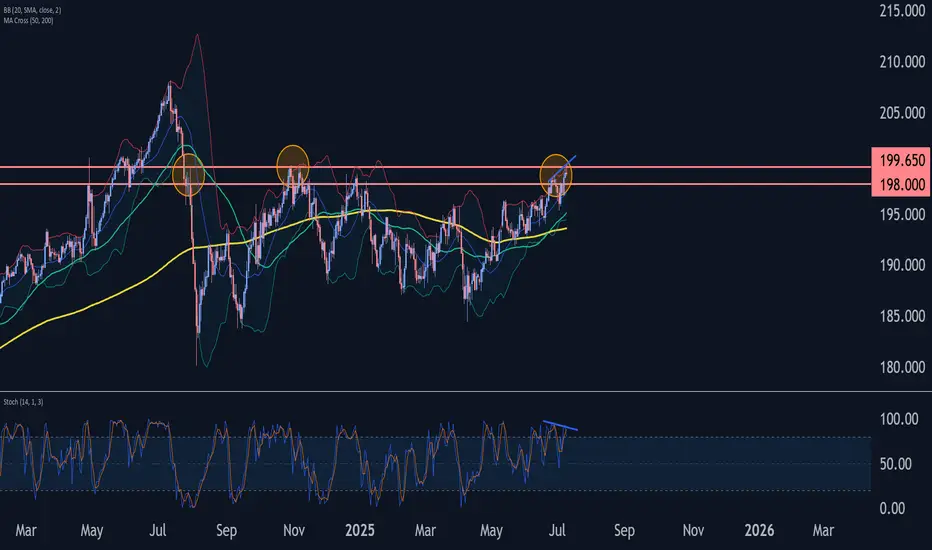
GBPJPY Wave Analysis – 9 July 2025- GBPJPY reversed from long-term resistance level 199.65
- Likely to fall to support level 198.00
GBPJPY currency pair recently reversed from the strong long-term resistance level 199.65 (former strong resistance from October, November and July) standing near the upper daily Bollinger Band.
The downward reversal from the resistance level 199.65 is likely to form the daily Shooting Star reversal pattern.
Given the bearish divergence on the daily Stochastic indicator and the strength of the resistance level 199.65, GBPJPY currency pair can be expected to fall to the next support level 198.00.
Another Home Run Trade? Risky & Conservative ApproachesFollowing up a MASSIVE win on the OANDA:EURJPY we may now have a similar trading opportunity setting up on the OANDA:GBPJPY
The premise is the same for this one as we're looking at a potential violation of structure followed by a Bullish continuation setup.
In this video, we'll look at where we think price can extend to, what needs to happen before we can make that prediction, and both a risky and conservative technique to get involved in the move.
Please let me know how you would approach this setup!
Akil

GBPJPY Shown Good Pullback after hitting Swing HighAs share earlier GJ show good bullish move and hit swing high. After hitting swing has given a good pull back and entered into the trade. The engulfing hourly candle showing strong pullback which will possibly go further down to retest a demand zone and an area.
GBPJPY BullishAfter exiting a correction, the first impulse (Wave 1) appears. I expect a retracement of at least 50% of the Fibonacci.
SHORT ON GBP/JPYGJ currently has broken a strong low of a rising wedge pattern (which is a bearish reversal pattern.
I am waiting for price to hit the supply zone before entering for a sell.
So a sell limit order will need to placed at the supply zone to take advantage of this opportunity.
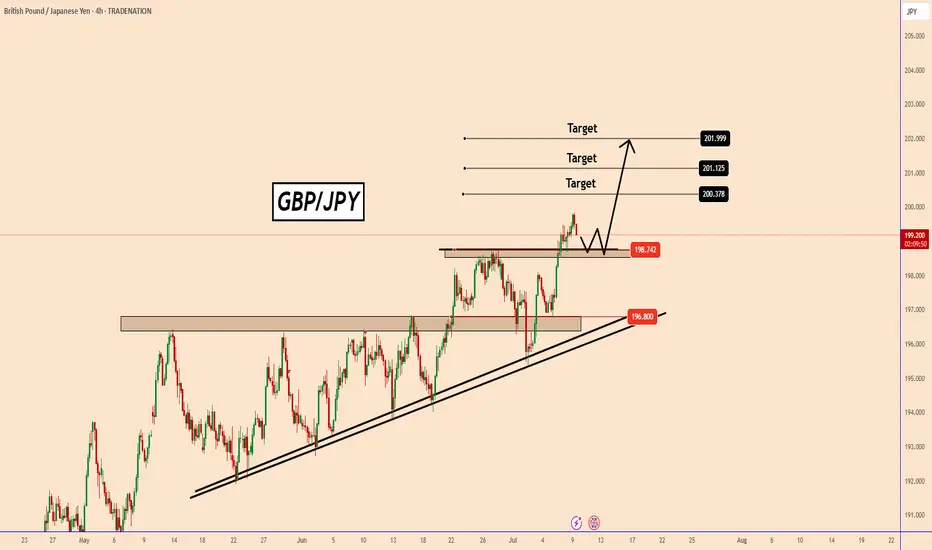
GBPJPY Surges as Trade Tensions Weaken YenGBPJPY Surges as Trade Tensions Weaken Yen
GBPJPY remains firmly in a bullish trend, having broken through two key resistance levels.
The first breakout occurred at 196.80, followed by a decisive move above 198.75 on Monday, signaling accelerating bullish momentum.
On July 7, the White House issued a strong letter to Japan’s Prime Minister, expressing concerns over the trade deficit and announcing a 25% tariff on Japanese goods, effective August 1, 2025.
This development has added pressure on the yen, and the weakness could persist in the near term.
However, the situation is still unfolding. Trump is expected to send additional letters today, which could inject further volatility into the markets.
You may find more details in the chart!
Thank you and Good Luck!
PS: Please support with a like or comment if you find this analysis useful for your trading day
possibility of uptrendAs long as the price is above the green support range, the continuation of the upward trend is likely. Upon reaching the 100% level, a correction trend will probably form.
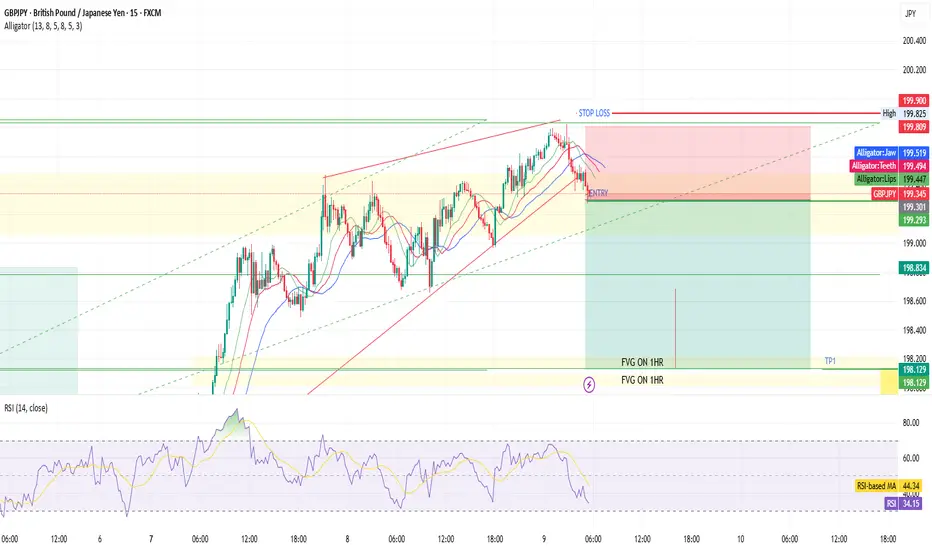
GBP JPY SCALPING TRADEDTF HH to HL , Dtf my bias is from bullish side GJ is at resistance level
My Target on Dtf HH to HL 0.382 Fib level tp
1 HR FVG Gap + Divergence
15 Min Scalping Entry + Cambist Comfirmation
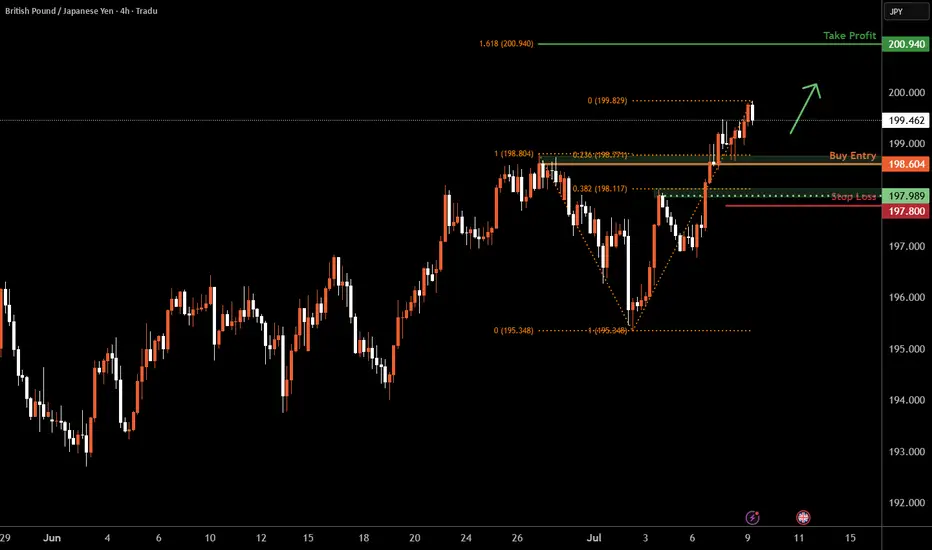
GBP/JPY H4 | Falling toward a pullback supportGBP/JPY is falling towards a pullback support and could potentially bounce off this level to climb higher.
Buy entry is at 198.60 which is a pullback support that aligns with the 23.6% Fibonacci retracement.
Stop loss is at 197.80 which is a level that lies underneath a pullback support and the 38.2% Fibonacci retracement.
Take profit is at 200.94 which is a resistance that aligns with the 161.8% Fibonacci extension.
High Risk Investment Warning
Trading Forex/CFDs on margin carries a high level of risk and may not be suitable for all investors. Leverage can work against you.
Stratos Markets Limited (tradu.com ):
CFDs are complex instruments and come with a high risk of losing money rapidly due to leverage. 63% of retail investor accounts lose money when trading CFDs with this provider. You should consider whether you understand how CFDs work and whether you can afford to take the high risk of losing your money.
Stratos Europe Ltd (tradu.com ):
CFDs are complex instruments and come with a high risk of losing money rapidly due to leverage. 63% of retail investor accounts lose money when trading CFDs with this provider. You should consider whether you understand how CFDs work and whether you can afford to take the high risk of losing your money.
Stratos Global LLC (tradu.com ):
Losses can exceed deposits.
Please be advised that the information presented on TradingView is provided to Tradu (‘Company’, ‘we’) by a third-party provider (‘TFA Global Pte Ltd’). Please be reminded that you are solely responsible for the trading decisions on your account. There is a very high degree of risk involved in trading. Any information and/or content is intended entirely for research, educational and informational purposes only and does not constitute investment or consultation advice or investment strategy. The information is not tailored to the investment needs of any specific person and therefore does not involve a consideration of any of the investment objectives, financial situation or needs of any viewer that may receive it. Kindly also note that past performance is not a reliable indicator of future results. Actual results may differ materially from those anticipated in forward-looking or past performance statements. We assume no liability as to the accuracy or completeness of any of the information and/or content provided herein and the Company cannot be held responsible for any omission, mistake nor for any loss or damage including without limitation to any loss of profit which may arise from reliance on any information supplied by TFA Global Pte Ltd.
The speaker(s) is neither an employee, agent nor representative of Tradu and is therefore acting independently. The opinions given are their own, constitute general market commentary, and do not constitute the opinion or advice of Tradu or any form of personal or investment advice. Tradu neither endorses nor guarantees offerings of third-party speakers, nor is Tradu responsible for the content, veracity or opinions of third-party speakers, presenters or participants.

GBPJPY 1:2.51 R 1HR Trade Idea ICTNice entry giving out a 1:2.51 potential R, bullish on GBP, taking out the daily buyside liquidity.
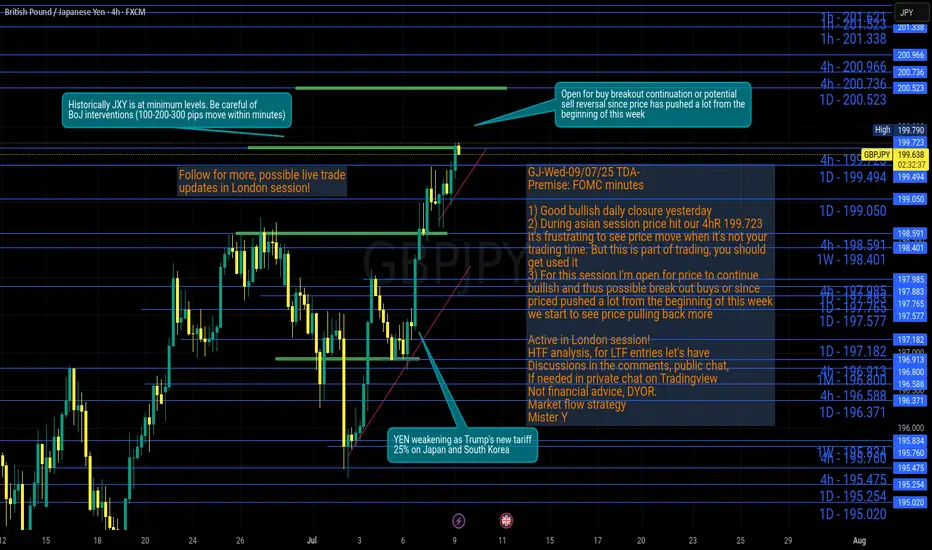
GJ-Wed-09/07/25 TDA-Asian push, price hit our 4hR 199.723Analysis done directly on the chart
Follow for more, possible live trades update!
I often share my live trades in Tradingview public chat in London session, stay tuned!
When you have a specific trading time during the day,
it's can be frustrating when moves happen outside of
your trading time. But remember this is part of the game,
we will never catch every single move on the chart.
Don't force the entries, learn to get used to it.
Premise:
A simple idea plan (like Tradingview public posts) won't describe everything.
No one can predict how market will move, it's always good to react to how it moves.
It gives an idea of how price might move, but no one come from FUTURE.
So I always encourage people to openly and actively discuss in real time.
For example discussing on Tradingview public chat (and more).
I don't give signals blindly, people should learn
and understand the skill.
Following blindly signals you won't know how to
manage the trade, where precisely put sl and tp,
lot size and replicate the move over time.
That's why you need active real time discussions.
Trading is not get rich quick scheme!
Active in London session!
Not financial advice, DYOR.
Market Flow Strategy
Mister Y
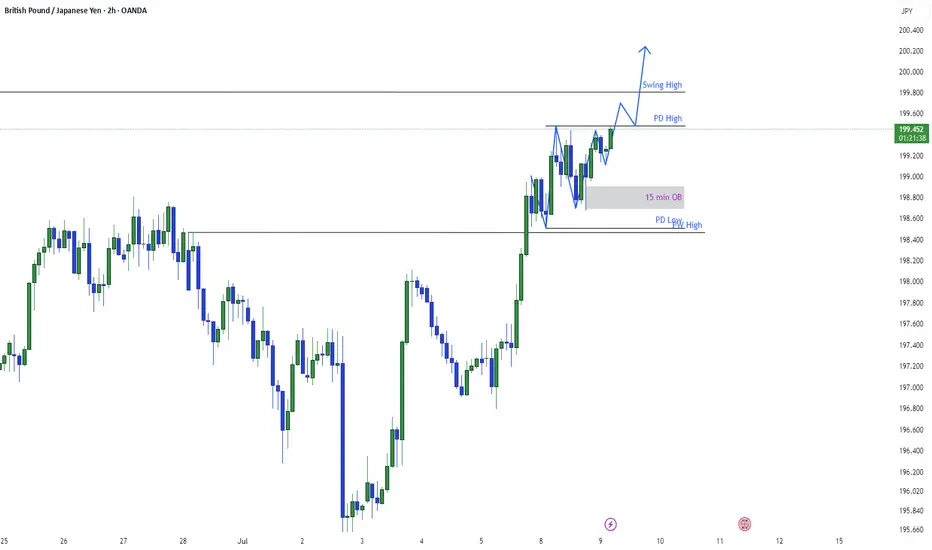
GBPJPY Extremely BullishAs described earlier GJ is extremely bullish and wants to target previous swing. current trading at 199.400 and travelling to the 199.857 which is previous swing high. In my yesterday's analysis I have given clue of GJ's being retracing and accumulating and going up again same is showing. We can see a pullback after taking swing high.
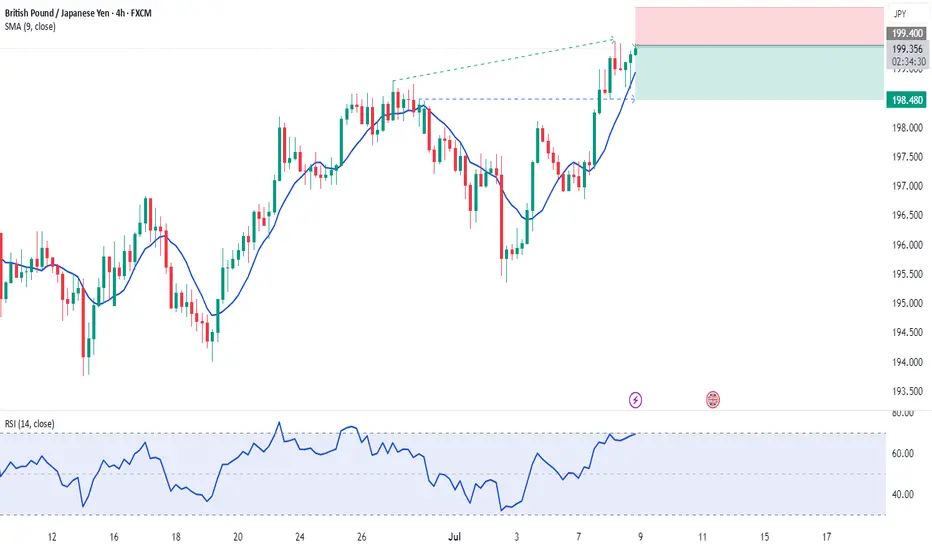
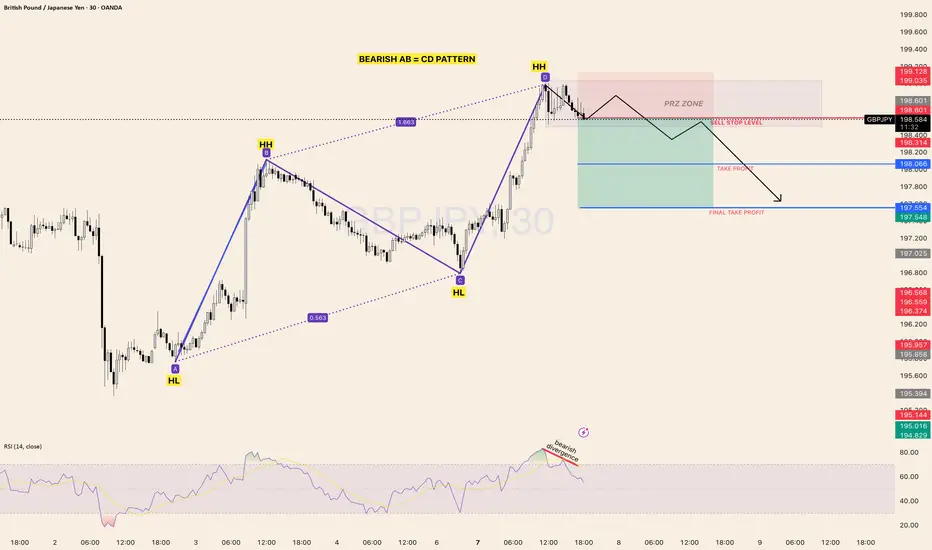
GBP/JPY BEARISH AB = CD PATTERN Potential Short Opportunity fromMarket Structure
Price formed a Higher High (HH) and is now completing a Bearish AB=CD harmonic
pattern
The Potential Reversal Zone (PRZ) has been tapped
RSI shows bearish divergence at the second HH, suggesting weakening bullish
momentum
Technical Details:
Pattern: Bearish AB=CD with clear symmetry
Key zone: PRZ between 198.684 and 199.128
Bearish RSI divergence adds extra confluence
Potential Sell Stop strategy below structure for safer entry confirmation
Bias Bearish (Pattern Completion + Divergence)
Short bias is activated only on the confirmation, either by sell-stop break or strong
rejection candles inside PRZ
If the price breaks above 199.128, the bearish setup is invalidated
Trade Plan
Action Level / Condition
Sell Entry Below 198.684 (Sell Stop Trigger Zone)
Stop Loss Above 199.128 (invalidation of PRZ)
Target 1 198.066
Final Tp 197.564
✅ Wish you best of luck and happy trading!
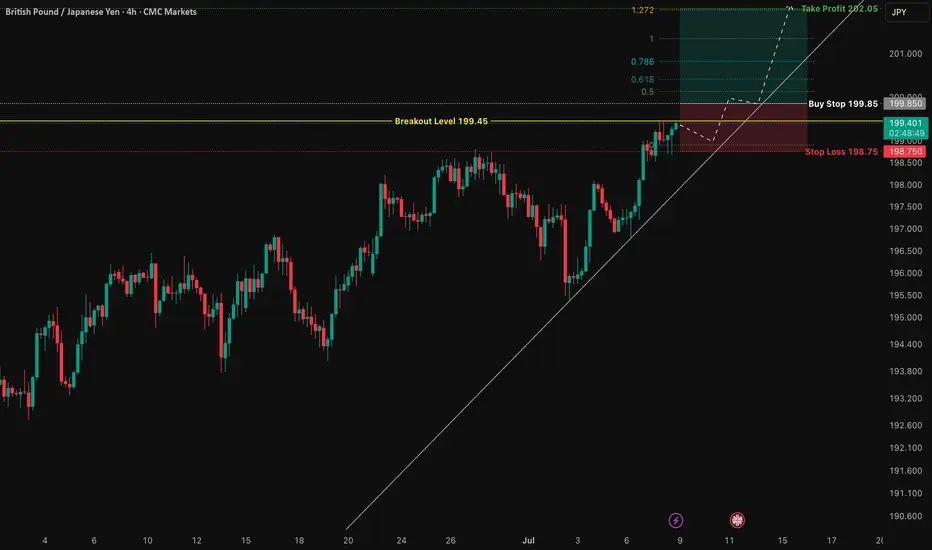
GBP/JPY: Total Confluence Targeting 202.05 BreakoutThis is a high-conviction trade setup based on a powerful confluence of fundamental drivers and multi-timeframe technical alignment. We are anticipating a bullish breakout in GBP/JPY, catalyzed by the upcoming UK GDP data release. The price action has formed a classic "coiled spring" pattern, indicating a significant buildup of energy before a potential move higher.
The analysis is based on pure price action, structure, and macroeconomics. The chart is kept intentionally clean to highlight the strength of the setup itself.
The Fundamental Why 📰
Two core data-driven factors underpin this trade:
1️⃣ Macro Policy Divergence: The primary long-term driver is the stark monetary policy difference between a relatively hawkish Bank of England (BoE), which is still fighting inflation, and an ultra-dovish Bank of Japan (BoJ). This fundamental imbalance creates a natural tailwind for GBP/JPY.
2️⃣ Positive Leading Indicators: Recent economic data from the UK has shown surprising strength. Both the Services and Manufacturing PMIs for June beat expectations, suggesting underlying resilience in the economy. This points to a higher probability of an upside surprise in Friday's GDP figures, which would be the direct catalyst for a breakout.
The Technical Picture 📊
Our confidence comes from a rare "Total Confluence," where every timeframe tells the same bullish story.
The Monthly Chart (Strategic View): Shows a powerful, multi-year uptrend that has decisively broken the critical 8-year resistance from the 2015 highs. The macro trend is undeniably bullish.
The Weekly Chart (The Confirmation): Confirms the uptrend is resuming now after breaking out of a year-long bullish continuation pattern. The "resting" phase appears to be over.
The 4-Hour Chart (The Setup): This is the "coiled spring." Price is consolidating in a very tight range right underneath the key breakout level of 199.45. This shows a lack of sellers and a buildup of buying pressure.
Fibonacci Confluence: Our take profit target is not random. It aligns perfectly with the 1.272 Trend-Based Fibonacci Extension, giving us objective, mathematical confirmation for the target at 202.05.
The Trade Plan ✅
This is a "set and forget" breakout strategy. The order should be placed as a Buy Stop to capture the momentum as it breaks higher.
📉 Asset: GBP/JPY
👉 Entry (Buy Stop): 199.85
⛔️ Stop Loss: 198.75
🎯 Take Profit: 202.05
🧠 Risk/Reward: 1:2
This analysis is for educational purposes. Always conduct your own research and manage your risk appropriately. Good luck.
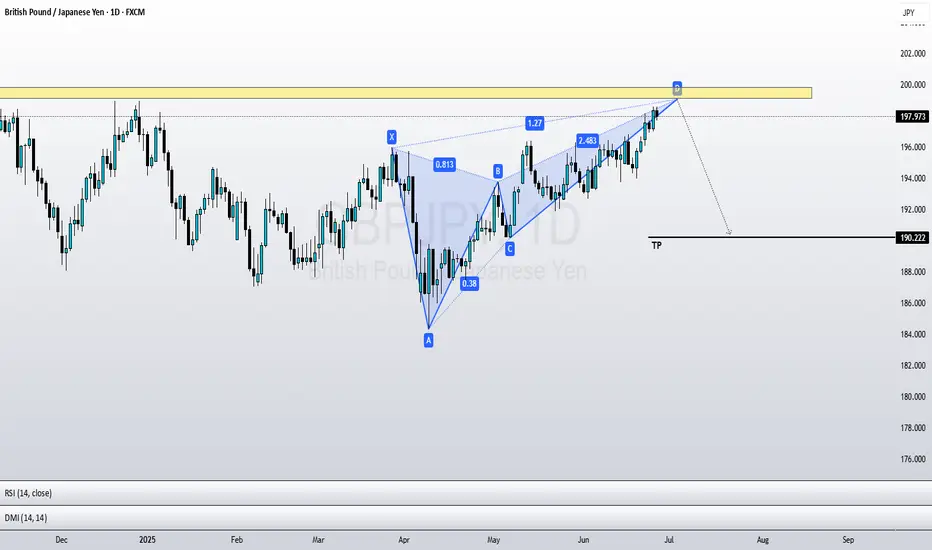
GBPJPY SHORT (swing)This is a trade setup based on a **Bearish Butterfly Harmonic Pattern**. The pattern meets all the key Fibonacci criteria for validity. Specifically, the AB leg retraces 80.8% of XA, which is close to the ideal 78.6% level and is considered acceptable, especially since it closed with a wick. The BC leg retraces 37.5% of AB, which is within the standard range of 38.2% to 88.6%. The CD leg extends 127% of XA, which is the minimum required for a valid Butterfly pattern, and also extends 252% of BC, which falls within the acceptable range of 161.8% to 261.8%.
What makes this setup stronger is that the Potential Reversal Zone (PRZ) at point D coincides with a **major resistance level**, adding significant technical confluence to the area. This increases the probability of a market reaction or reversal from that zone.
However, no entry will be taken immediately upon price reaching the PRZ. A trade will only be initiated **after the appearance of a confirmed reversal candlestick pattern** at or near the D point, such as a bearish engulfing.
This ensures that we enter with confirmation and not just based on pattern completion.
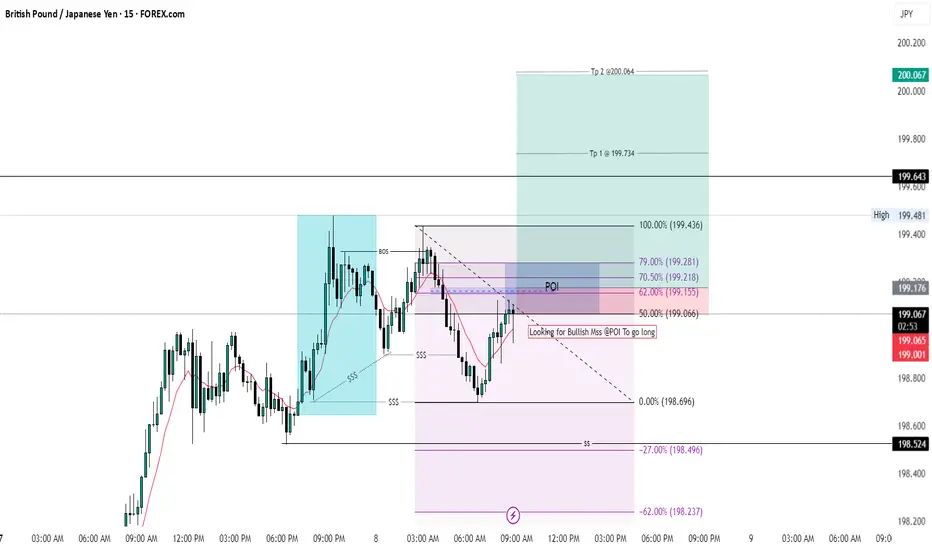
GJ BuysI'm waiting for that small FVG to be used as an iFVG — once that happens, I'll take my first entry on the retest.
Another entry will come from MSS on the lower time frame; if a swing low forms, that will also confirm another entry.
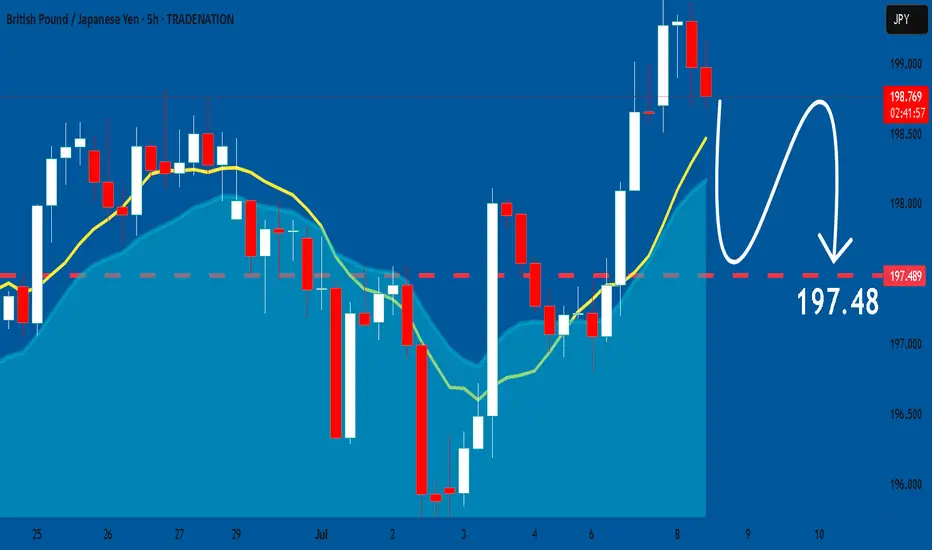
GBPJPY: Bearish Forecast & Outlook
Looking at the chart of GBPJPY right now we are seeing some interesting price action on the lower timeframes. Thus a local move down seems to be quite likely.
Disclosure: I am part of Trade Nation's Influencer program and receive a monthly fee for using their TradingView charts in my analysis.
❤️ Please, support our work with like & comment! ❤️
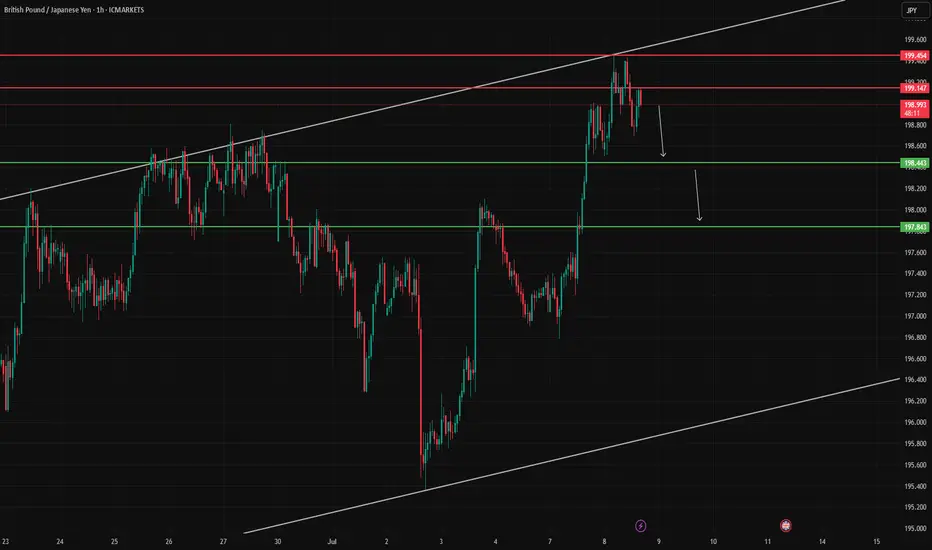
GBPJPY – Rejected from Upper Channel LineGBPJPY has failed to break above the upper channel resistance at 199.454. The pair is now showing signs of bearish rejection.
Targets to watch:
🔻 First: 198.443
🔻 Second: 197.843
Invalidation above 199.454 would negate the setup.