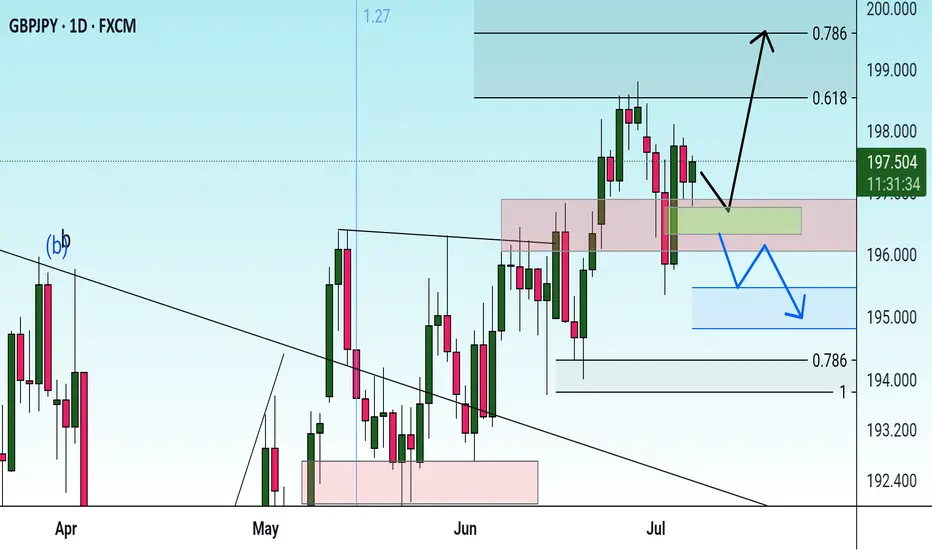
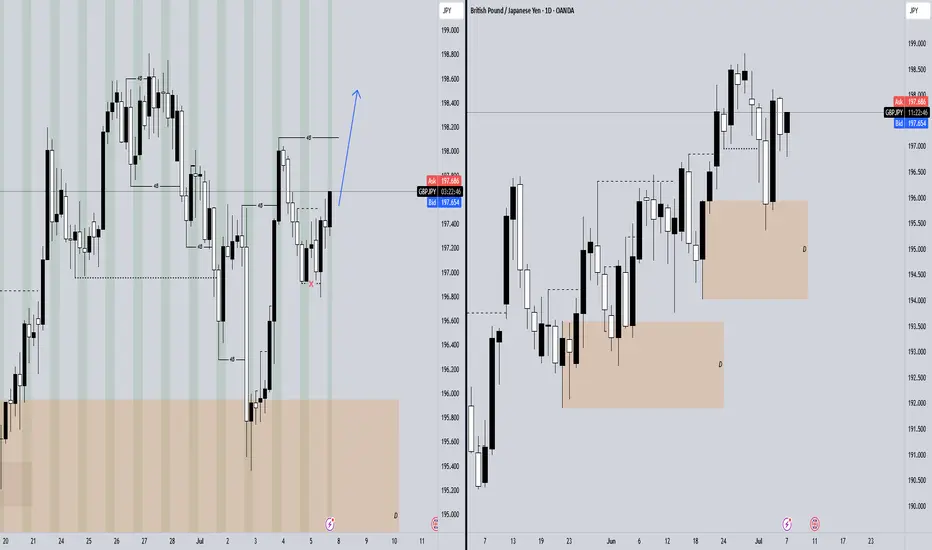
gbpjpyLet’s take a look at the #GBPJPY pair. Despite continuing in a clear uptrend confirmed by the weekly close and the start of this week, I wouldn’t rush into buying at the current levels just yet. 🚀📈
On the chart, I’ve marked two potential entries with different zones to watch. We’ll need to see if the price pulls back to these areas and finds support before considering a position. 🔍📉
As always, these setups are not fully confirmed, so it’s better to approach them with caution—either by using smaller position sizes or by ensuring that the combined risk of both trades does not exceed what you would risk on a single trade. ⚠️📊
Managing your risk carefully and waiting for a clearer confirmation can help protect your capital and maximize your chances of success. Patience and discipline remain key! 💪💼
GBPJPY trade ideas
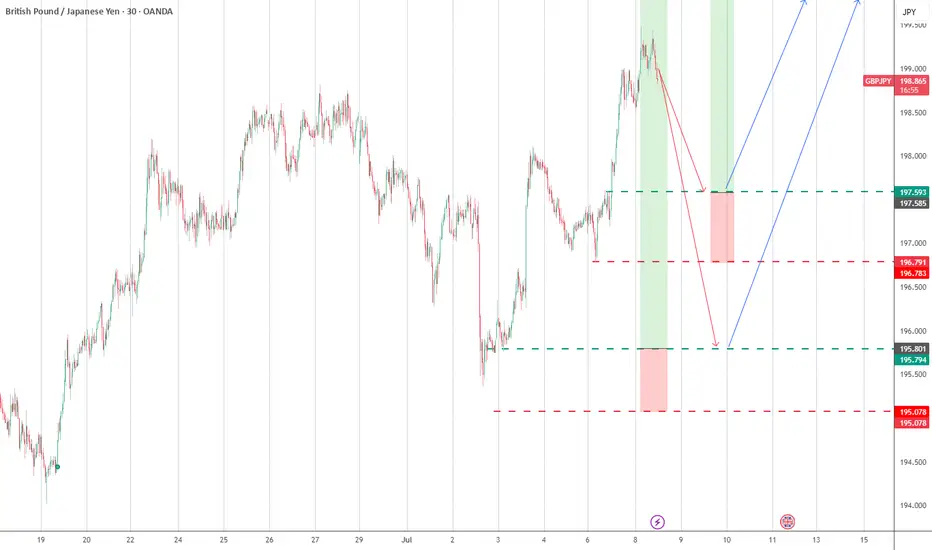
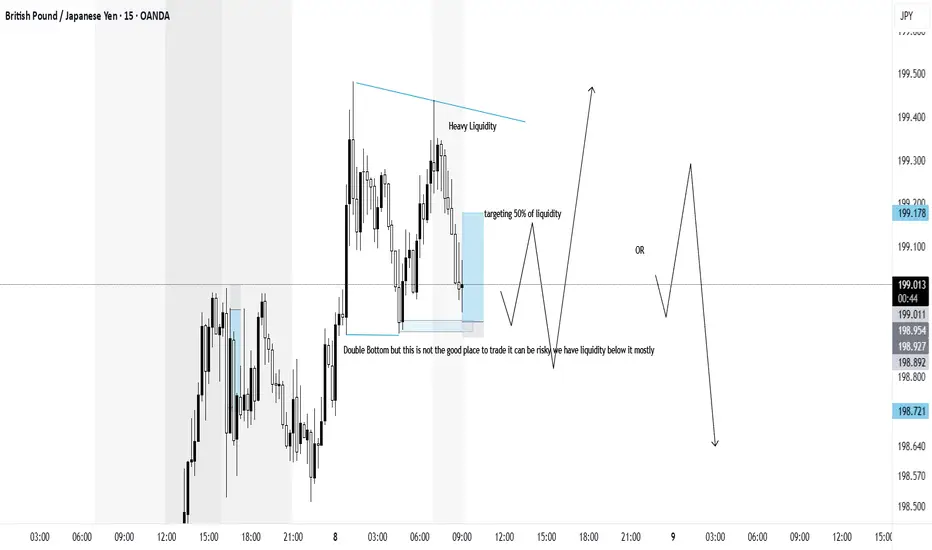
GBPJPYTargeting 1:7 RR this trade can be risky but have good potential as Price can even Take me out ( touch me SL then go UP ) so be cautious but yes its a good trade and has reason low liquidity retailers are trying to push price below and later retailers will try to buy at Double bottom same will be done by institutional and sellers will be taken out then buyers will be taken out so it will go up then can go down than back up
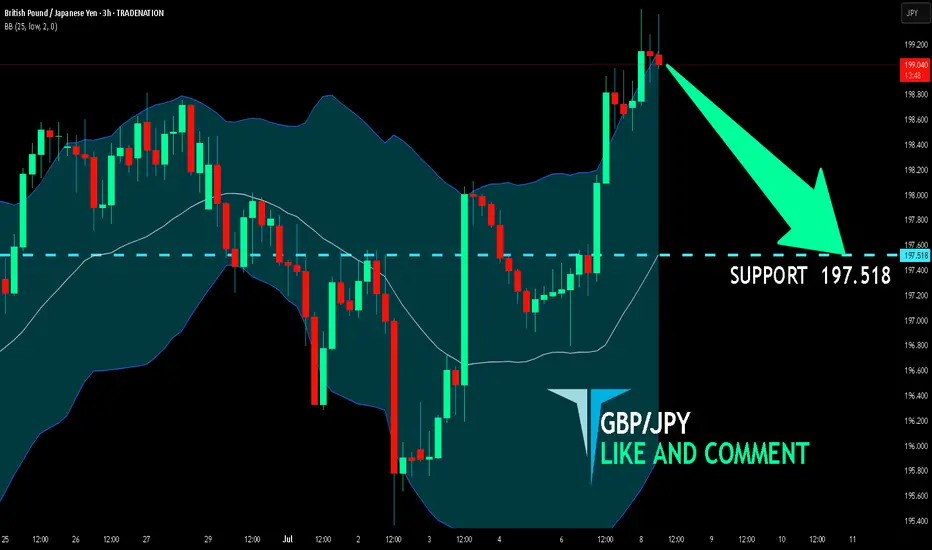
GBP/JPY SELLERS WILL DOMINATE THE MARKET|SHORT
Hello, Friends!
Previous week’s green candle means that for us the GBP/JPY pair is in the uptrend. And the current movement leg was also up but the resistance line will be hit soon and upper BB band proximity will signal an overbought condition so we will go for a counter-trend short trade with the target being at 197.518.
Disclosure: I am part of Trade Nation's Influencer program and receive a monthly fee for using their TradingView charts in my analysis.
✅LIKE AND COMMENT MY IDEAS✅
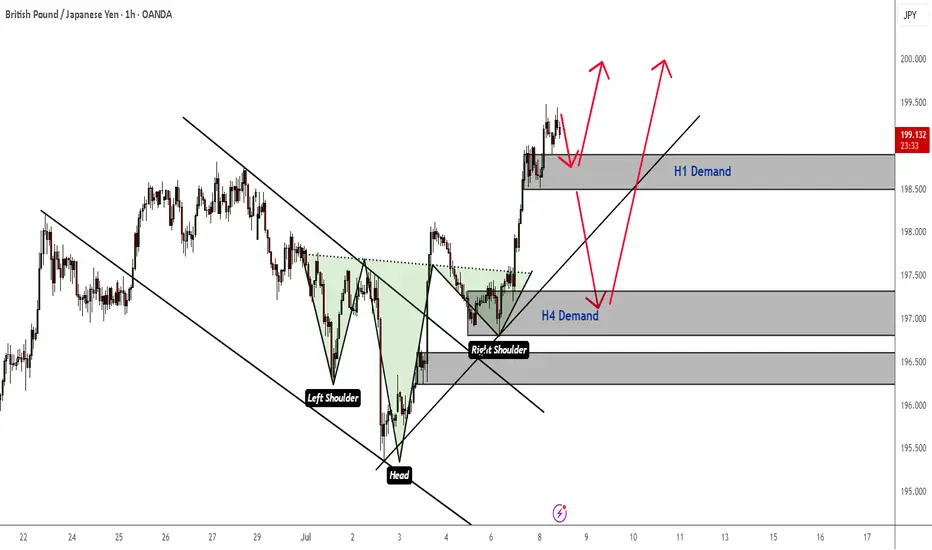
GBPJPY High Probability of a Bearish CorrectionThe trend is no doubt bullish here. But in the event that the current H1 demand is violated, there is a high probability of a retest or pullback to an H4 demand zone before the bullish trend resumes.
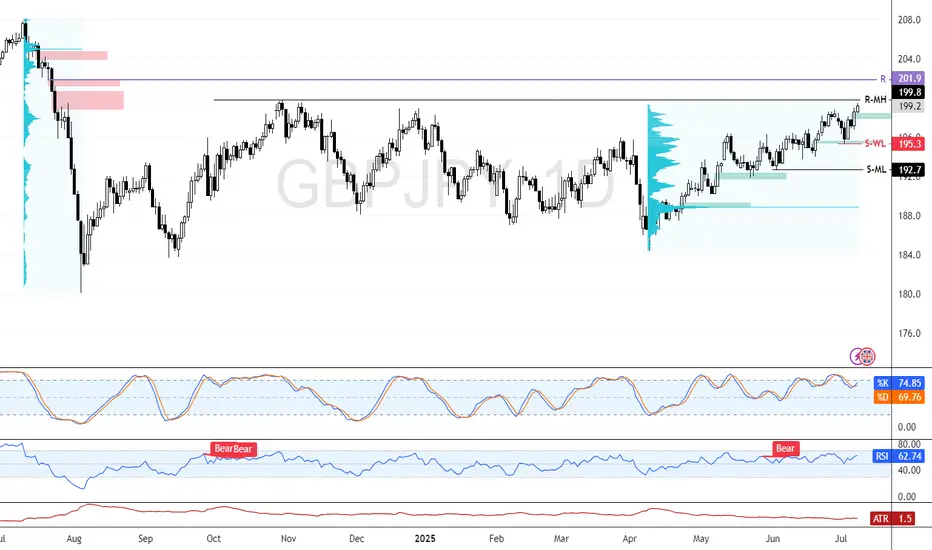
GBP/JPY Faces Critical Supply Zone Near 199.8 Monthly High GBP/JPY hit the monthly high resistance at 199.8, a level backed by a bearish fair value gap from July 2024. The pair now trades near 199.2, just below this zone.
With supply levels extending to 201.9, a decline toward the weekly support at 195.3 is expected if selling pressure builds.
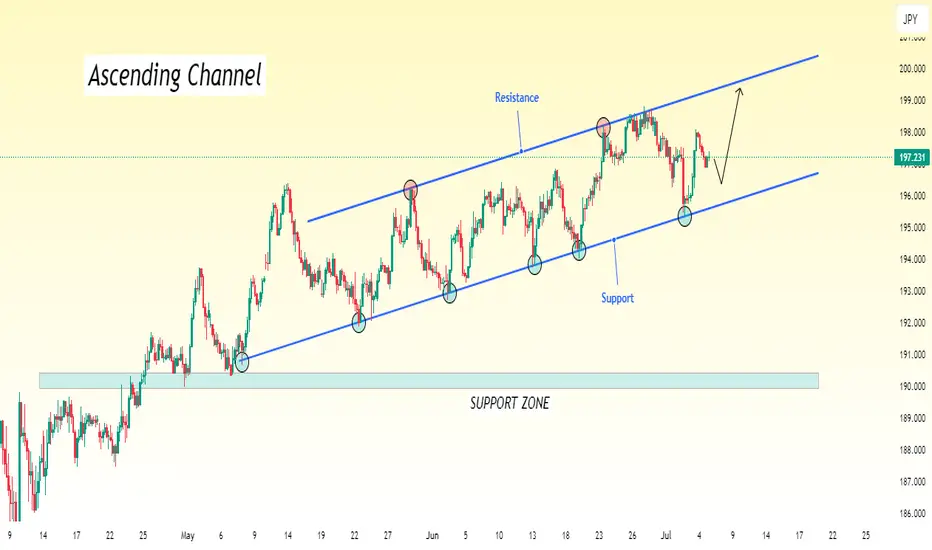
GBP/JPY Rising Within Ascending Channel – Target in SightGBP/JPY is currently moving within an ascending channel, where price action is forming higher highs and higher lows. This pattern indicates a steady uptrend.
At the moment, the pair is approaching the upper boundary (resistance line) of the channel. Based on the current momentum and structure, we expect the price to continue its upward movement and test the upper trendline.
This upper line serves as our near-term target, where we may look to take profit or reassess the trade setup. As long as the price remains within the channel and respects the trendline structure, the bullish bias remains intact.
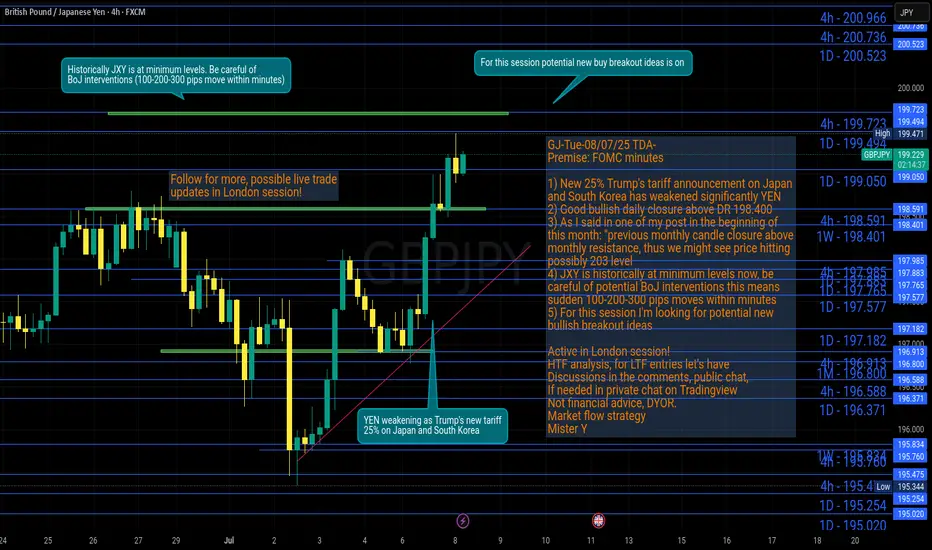
GJ-Tue-08/07/25 TDA-Trump's new tariff 25% on Japan, YEN weakAnalysis done directly on the chart
Follow for more, possible live trades update!
I often share my live trades in Tradingview public chat in London session, stay tuned!
Trump's new tariff 25% on Japan and South Korea has Yen weakening
further more significantly. Historically JXY is at minimum levels, where
BoJ can possibly intervene and buy back YEN and strengthening it.
Possibly causing massive dump on GJ like 100-200-300 pips move
within minutes. Always be careful and stay up to date to recent global
events and more.
Premise:
A simple idea plan (like Tradingview public posts) won't describe everything.
No one can predict how market will move, it's always good to react to how it moves.
It gives an idea of how price might move, but no one come from FUTURE.
So I always encourage people to openly and actively discuss in real time.
For example discussing on Tradingview public chat (and more).
I don't give signals blindly, people should learn
and understand the skill.
Following blindly signals you won't know how to
manage the trade, where precisely put sl and tp,
lot size and replicate the move over time.
That's why you need active real time discussions.
Trading is not get rich quick scheme!
Active in London session!
Not financial advice, DYOR.
Market Flow Strategy
Mister Y
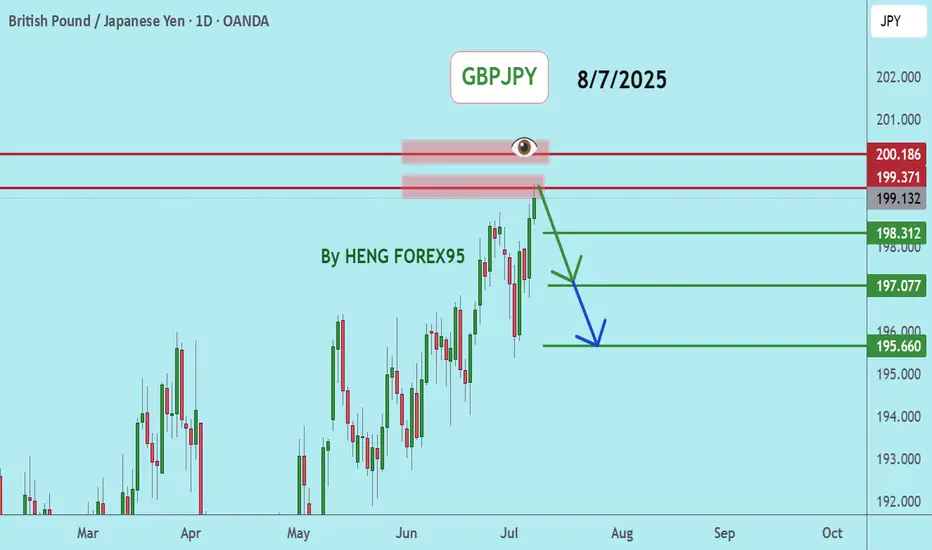
GBPJPYGBPJPY price is near the major resistance zone 200.186. If the price cannot break through the 200.186 level, it is expected that the price will go down. Consider selling the red zone
🔥Trading futures, forex, CFDs and stocks carries a risk of loss.
Please consider carefully whether such trading is suitable for you.
>>GooD Luck 😊
❤️ Like and subscribe to never miss a new idea!
Follow up on GBPJPY outlookA quick entry at LND open. Monitoring for any invalidation that might present
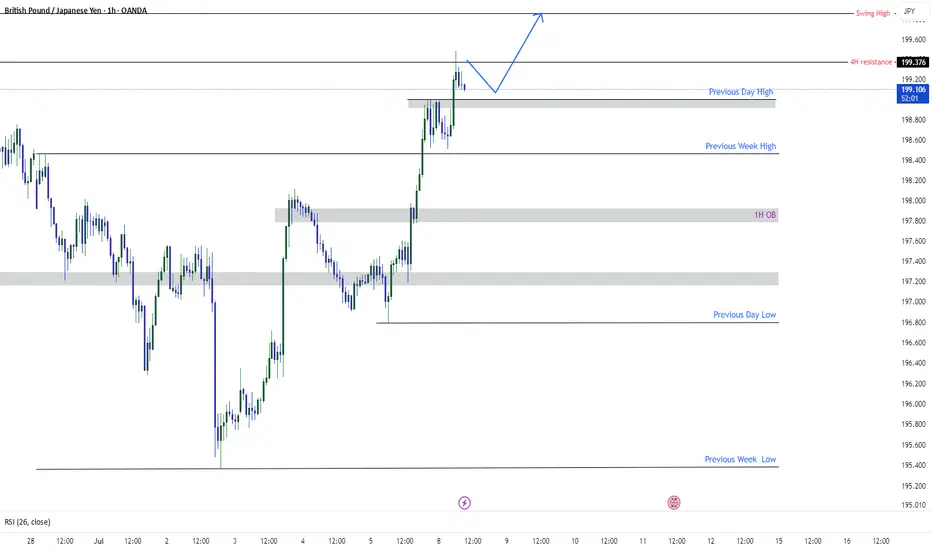
GBPJPY Targeting SwingGBPJPY has currently broken previous day high and wants to target the swing high which is 199.857 after retracing form previous 4H resistance GJ wants to travel to swing high. Chart is showing everything clearly. do not make things complex. Simplify as much as you can.


gbpjpy long outlookif anyone see any different lmk what you see. whati am seeing based off weekly chart is price breaking ristance asreas and moving on up to another ristsance zone. what do you guys think
?
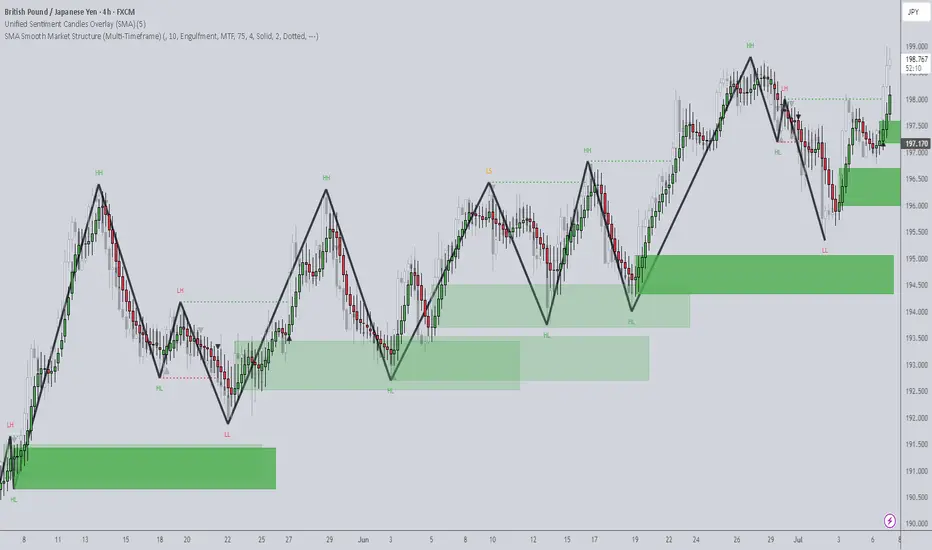
Timeframes: Why They’re Fundamentally Flawed (And What To Do)When analyzing price action, timeframes serve as a convenient lens through which traders attempt to make sense of the market. They help us categorize price movement — bullish , bearish , ranging , trending , and so on — within a structured framework. But here’s the reality: candlesticks themselves aren’t real . Much like clocks or calendars, they’re simply man-made constructs — tools we've invented to measure and scale something intangible: time . I know that might sound a bit abstract, but stay with me.
While traders commonly rely on standard timeframes like the Daily, 4H, 1H, 15M , etc., it’s important to recognize that price doesn’t conform to these rigid intervals. The market moves continuously, and the “spaces between” those timeframes — like a 27-minute or 3-hour chart — are just as real . These non-standard timeframes often offer better clarity depending on the speed and rhythm of the market at any given moment.
This begs the question: How do we keep up with this ever-shifting pace? Do we constantly toggle between similar timeframes to recalibrate our analysis? Do we measure volatility? Amplitude? Period length? There’s no clear consensus, which leads to inefficiency — and in trading, inefficiency costs.
In my view, the solution lies in blending multiple nearby timeframes into a single, adaptive framework . We need a representation of price action that adjusts automatically with the speed of the market. And the answer is surprisingly simple — literally . It’s called the Simple Moving Average (SMA) .
Think an SMA is just a line representing past highs, lows, or closes? It’s much more than that. When used creatively, the SMA becomes a dynamic lens that filters noise, reveals trend clarity, and smooths out irregularities in price behavior. Rather than relying on a single metric, we can combine multiple SMA variations — highs, lows, opens, closes — into one composite view of the market . This gives us a continuously adjusting snapshot of average price action.
Once we adopt this approach, everything starts to click.
• Engulfing patterns become more reliable
• Liquidity sweeps occur less frequently
• Supply and demand zones become more precise
• Market structure begins to make consistent sense
With SMA-based price action , our strategies don’t just become clearer — they become smarter .
Want to See It in Action?
If you’re interested in applying this concept to your own trading strategy, check out my TradingView profile: The_Forex_Steward . There, you’ll find the SMA Price Action indicator used in the examples shown, as well as tools that apply this methodology to:
• Supply and Demand
• Market Structure
• Market Balance Levels
• Velocity & Momentum
• And more to come!
If you found this idea helpful, be sure to follow the page. I’ll be releasing more exclusive indicators and trading concepts soon — so stay tuned!
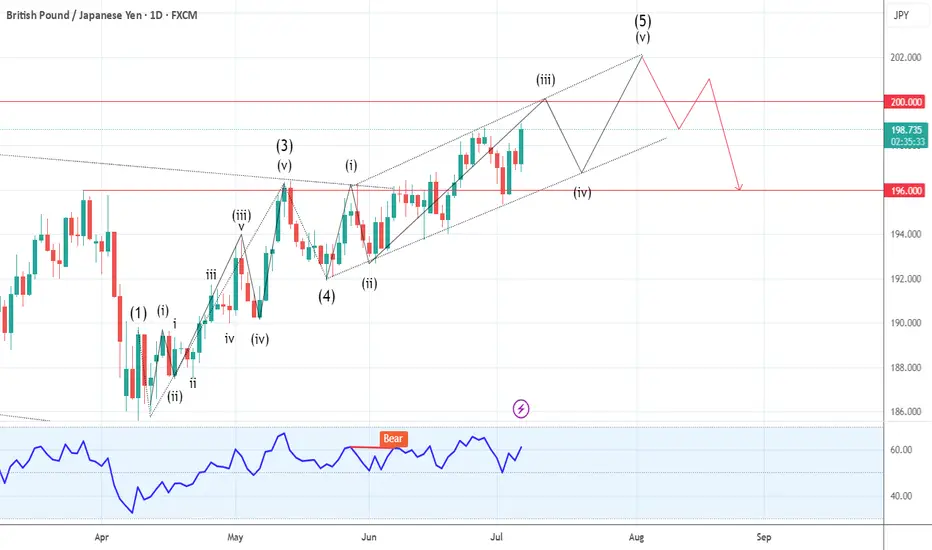
GBPJPY Elliott Wave AnalysisHello friends
We are witnessing the formation of a complete Elliott wave pattern on the GBPJPY chart. These waves from 1 to 5 are quite clear and you can even count their subwaves (especially the microwaves of the main wave 3). Now wave 5 is completing and moving inside an ascending channel.
At the moment, the microwaves of the 5th wave have not been completed, so we expect the price to grow within this channel. The minimum growth is up to 200.00, of course, it can grow even more.
But after the completion of the 5th wave, with the breakdown of the trend line drawn below and a return to it, we can expect the price to fall to the specified support. The first support is 196.00. Of course, the price decrease in the 5th wave is always accompanied by divergence and a decrease in the slope of the chart, as you can see that the slope of wave 5 is much lower than wave 3.
Good luck and be profitable.
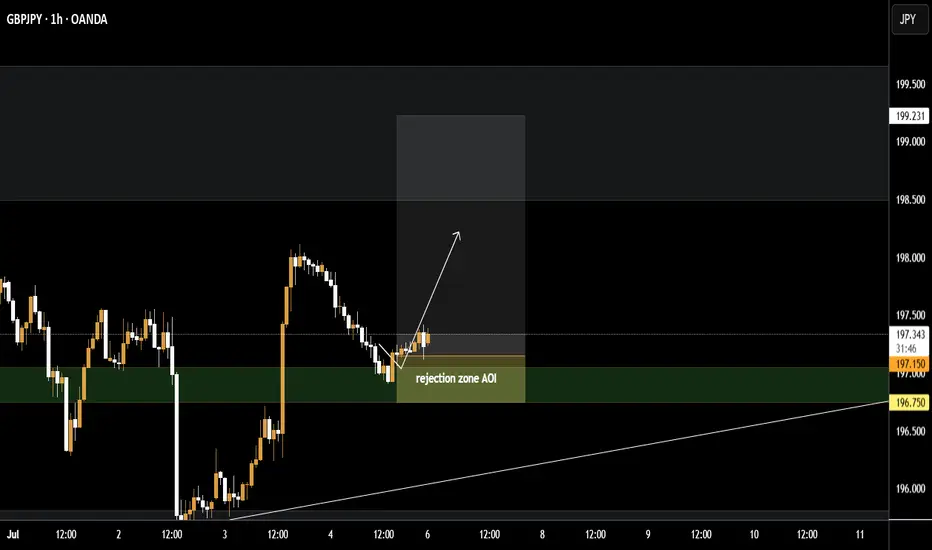
IDEA TRADE GBPJPY LONG POSITION Hi Traders
Pair: GBPJPY
📈 Position: LONG (BUY)
✅ Entry: 197.150
🔺 SL: 196.750 (-40 pips )
🎯 Take Profits:
• TP 1: 197.550
• TP 2: 197.950
• TP 3: 198.350 Trailing SL)
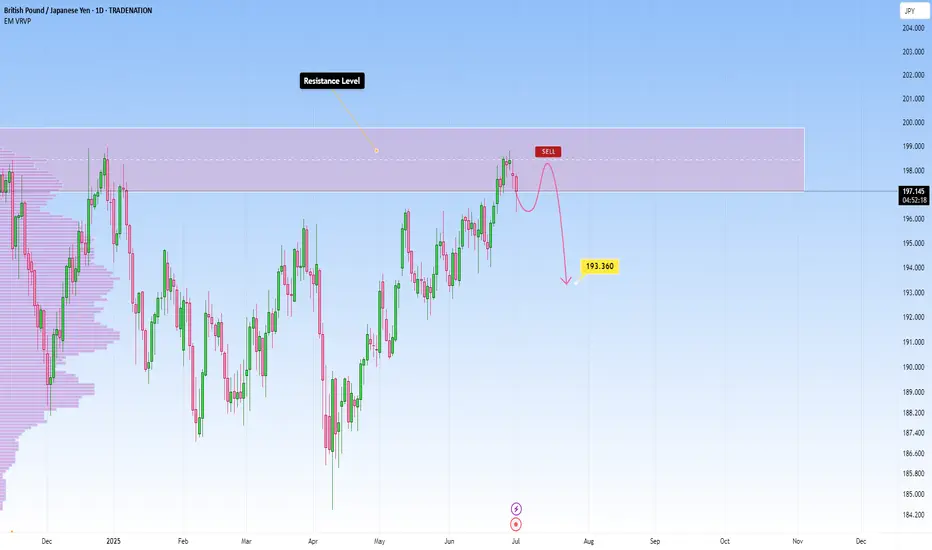
GBPJPY sitting at resistance – Is a drop to 193.360 likely?GBPJPY is sitting right at a key daily resistance zone. This is a level where it has struggled to break through and reversed strongly to the downside. So this makes it definitely one to monitor, especially if you’re eyeing potential short setups.
If we start seeing signs that the price is getting rejected here: like long wicks, strong bearish candles, it could be the early indication of another move lower. My focus is on a moderate drop toward the 193.360 area, similar to what we’ve seen in past pullbacks. Nothing too dramatic, just a simple downside play if sellers step in again.
But if we get a strong breakout? That changes everything: it would hint that bulls are taking full control. This area is pretty important and could give us a better idea of where price is headed next.
Just sharing my thoughts on support and resistance, this isn’t financial advice. Always confirm your setups and manage your risk properly.
Disclosure: I am part of Trade Nation's Influencer program and receive a monthly fee for using their TradingView charts in my analysis.
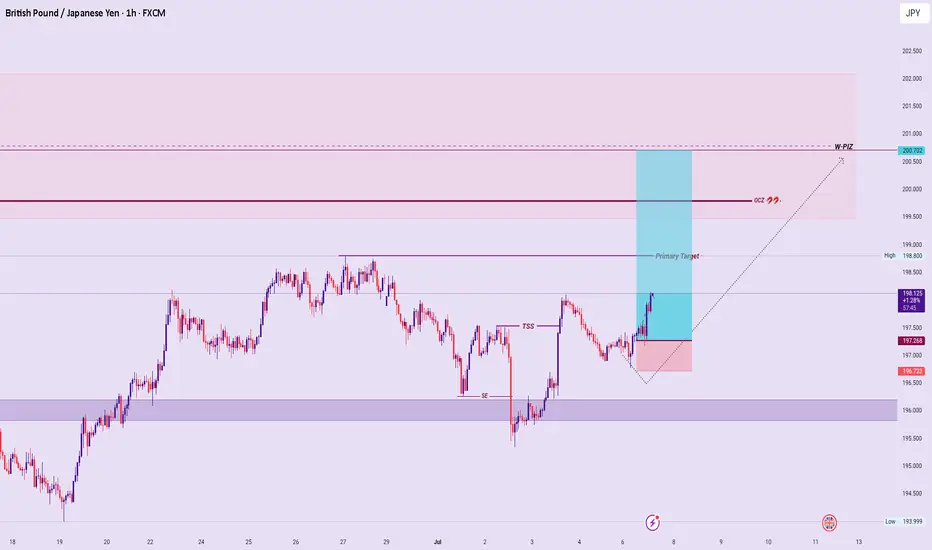
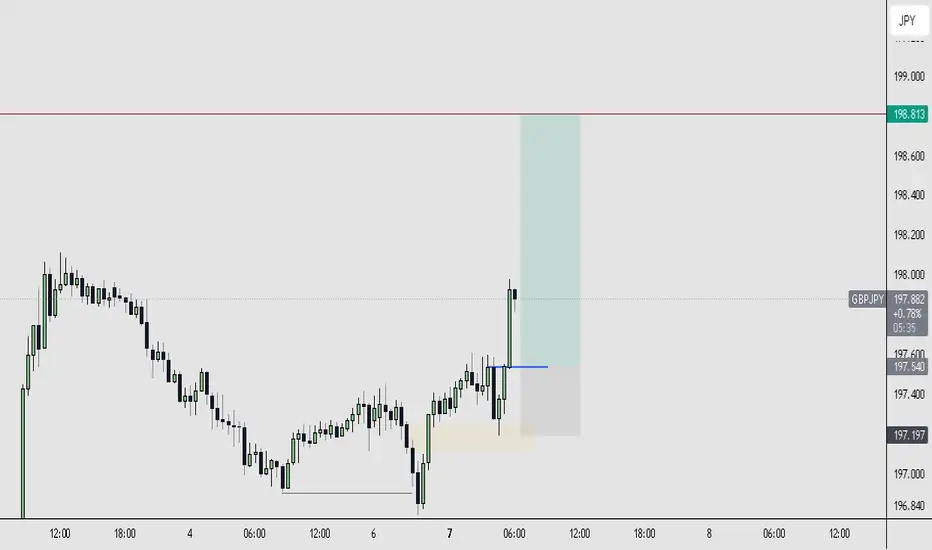
GJ Buy-setup SMC/ICT Perspective. Bias: Bullish
I’m expecting further upside continuation on GBP/JPY based on a confluence of smart money principles and higher timeframe structure.
🧠 Reason for Buying:
🔹 HTF Bullish Structure:
Price remains in a clear bullish trend across the Weekly, Daily and 4H timeframes, consistently forming higher highs and higher lows. This trade aligns with that higher timeframe narrative.
🔹 Liquidity Sweep
🔹 CISD
🔹 Rejection from a FVG
🎯 Trade Details:
Entry: 197.540
Stop Loss: 197.199 (invalidation point)
Take Profit: 198.813
🎯 Why I’m Targeting 198.813:
This level aligns with:
🔸 Untapped Buy-Side Liquidity: Clean highs from previous price action likely hold resting buy orders (liquidity pool).
🔸 Round Number Magnet: 198.800 is a psychological level that can act as a price magnet, especially when aligned with technical confluence.
⚖️ Risk to Reward: 3.7R+
A high-probability trade with favorable reward relative to risk. Trade management will be key — partials can be taken as price approaches interim highs.
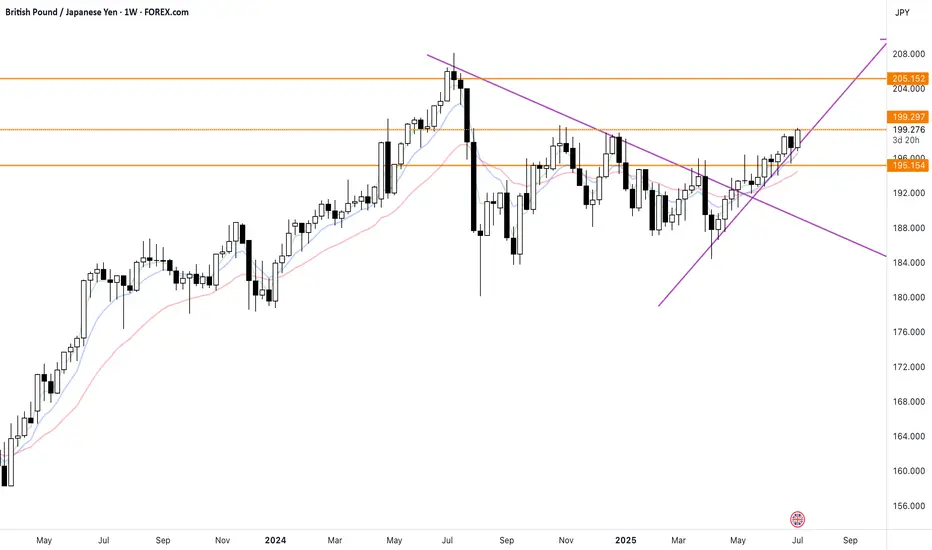
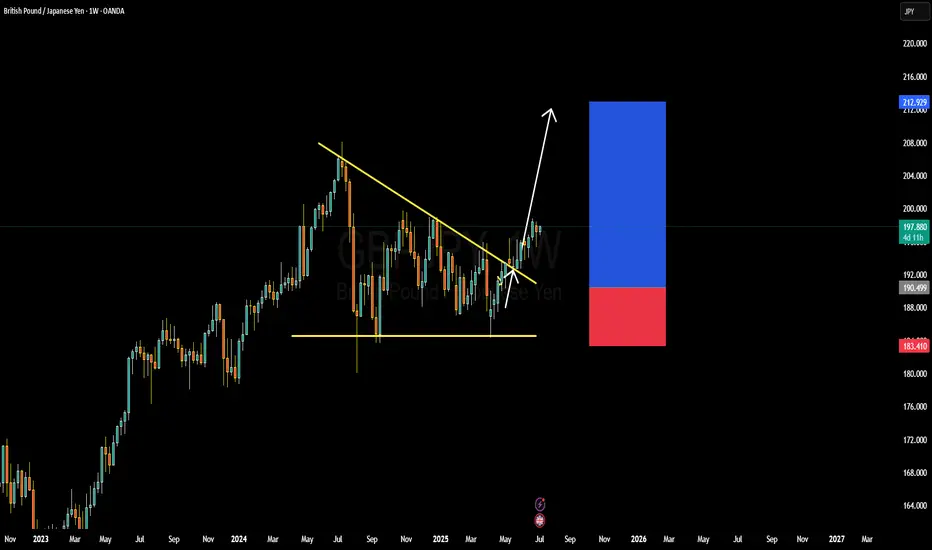
GBPJPY BULLISH OR BEARIS DETAILED ANALYSISGBPJPY has successfully broken out of a long-term falling wedge on the weekly chart, and the bullish momentum is unfolding as expected. Price has rallied from 190.00 to the current 197.00 level, delivering solid profits from the breakout zone. This continuation setup is extremely strong, with the market respecting the wedge breakout structure and forming higher highs. As long as we hold above the 190.00 support, the bullish bias remains fully intact, with 205.00 as the next key upside target.
Fundamentally, the British pound remains well-supported due to the Bank of England’s hawkish stance. Despite softer inflation data, the BoE has signaled a cautious approach to rate cuts compared to other central banks, maintaining underlying GBP strength. On the other side, the Japanese yen continues to weaken as the Bank of Japan sticks with its ultra-loose monetary policy. Yen weakness is further fueled by rising US and UK bond yields, widening the yield differential and attracting carry trades into GBPJPY.
Technically, the breakout is unfolding with textbook precision. Price has cleared descending resistance, retested it, and is now building a new leg higher. The volume profile is supporting this bullish breakout, and market structure is confirming further upside. The 200.00 psychological level may act as a minor resistance, but once cleared, 205.00 is well within range and aligns with major Fibonacci extensions.
GBPJPY is also benefiting from increased volatility in risk-on sentiment, as equity markets remain firm and bond yields rise globally. Traders are favoring high-yielding currencies like GBP while shorting low-yielders like JPY. With the fundamentals and technicals now strongly aligned, this trade is well-positioned to deliver continued profits toward 205.00 and beyond.
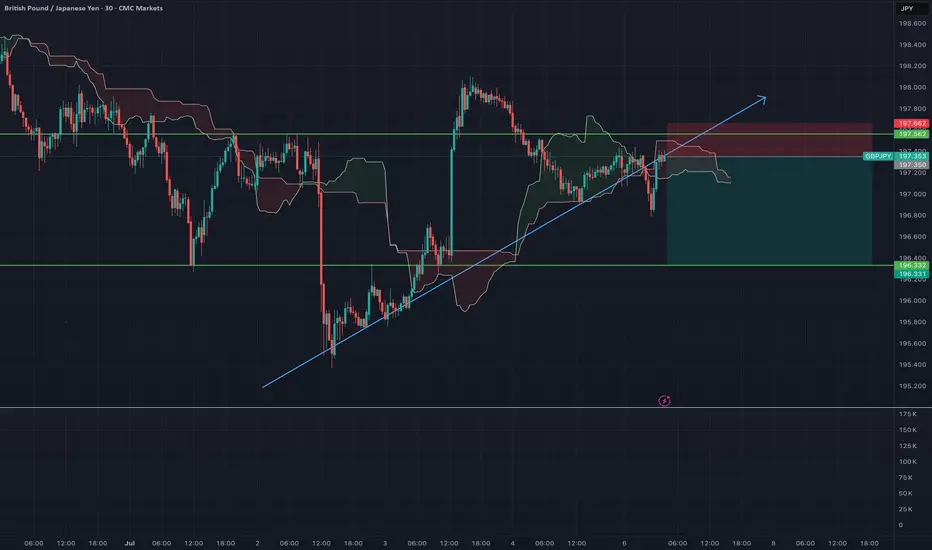
GBP/JPY - Channel BreakoutThe GBP/JPY pair on the M30 timeframe presents a Potential Selling Opportunity due to a recent Formation of a Breakout Pattern. This suggests a shift in momentum towards the downside and a higher likelihood of further advances in the coming hours.
Possible Short Trade:
Entry: Consider Entering A Short Position around Trendline Of The Pattern.
Entry: 197.347
Stop Loss: 197.662
Take Profit: 196.332
Uptrend Resumes After BOS – Ready to Load LongsI am expecting price to continue higher after mitigation of this fractal 4hr demand zone. In 4hr Price has shifted the swing structure to bullish with strong momentum and now price has formed a another bullish continuation structure within the bullish leg imbalance zone. This is the very clean winning trade setup and has the higher probability. The closest target is the 4hr swing weak HH.
Possibility of uptrend It is expected that a trend change will take place within the green support area and we will witness the start of an upward trend. Otherwise, the correction trend will continue to the next support levels.