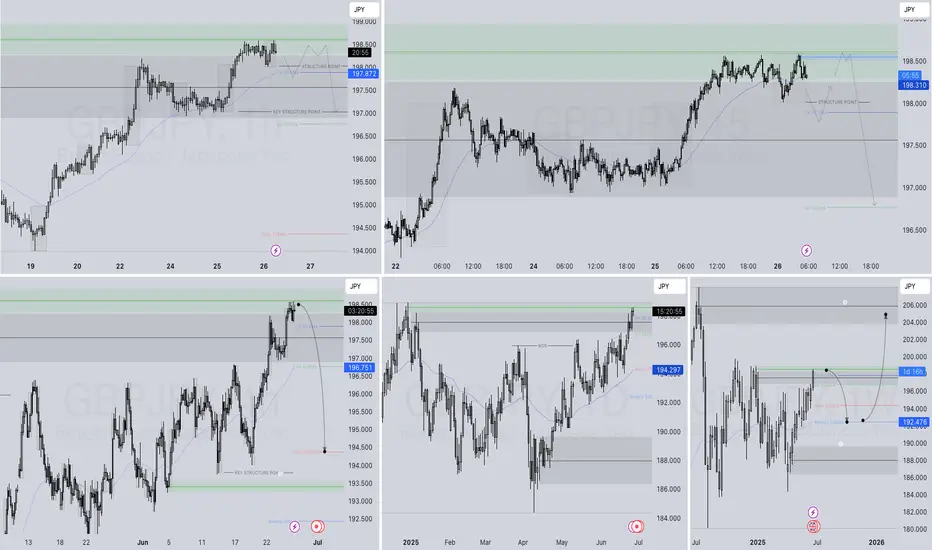
XAUUSD and GBPJPY Analysis todayHello traders, this is a complete multiple timeframe analysis of this pair. We see could find significant trading opportunities as per analysis upon price action confirmation we may take this trade. Smash the like button if you find value in this analysis and drop a comment if you have any questions or let me know which pair to cover in my next analysis.
GBPJPY trade ideas

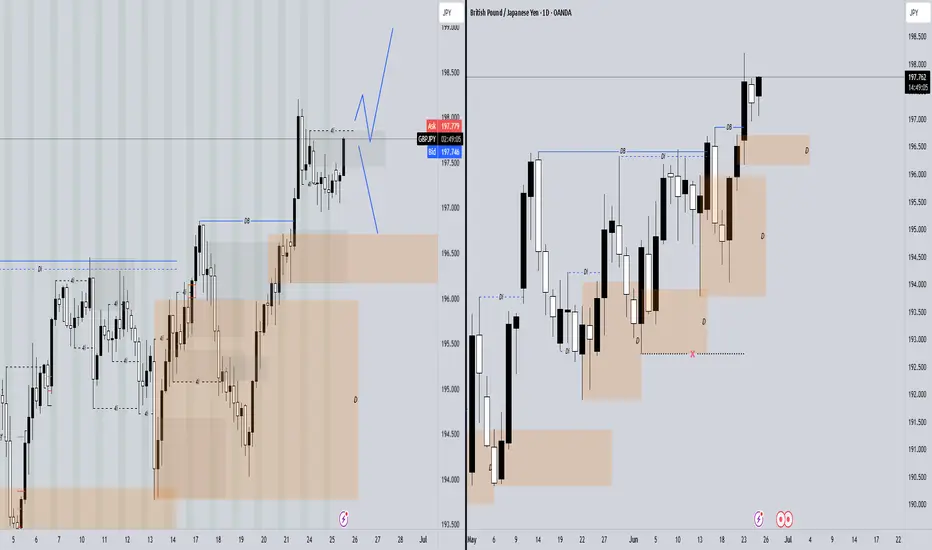
GBPJPY BuyExternal structure is bullish, price came into order block. Asia cycle has been completed. price should continue upward to take out high.
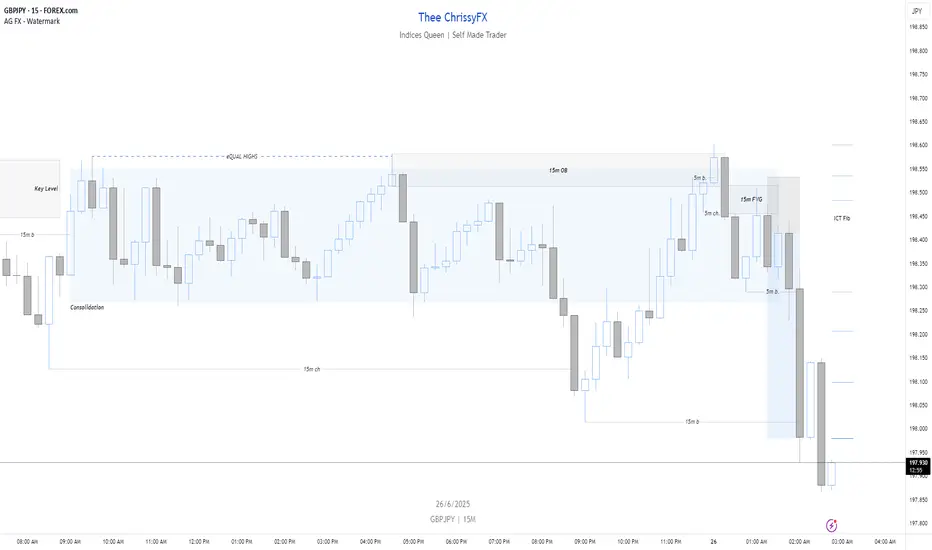
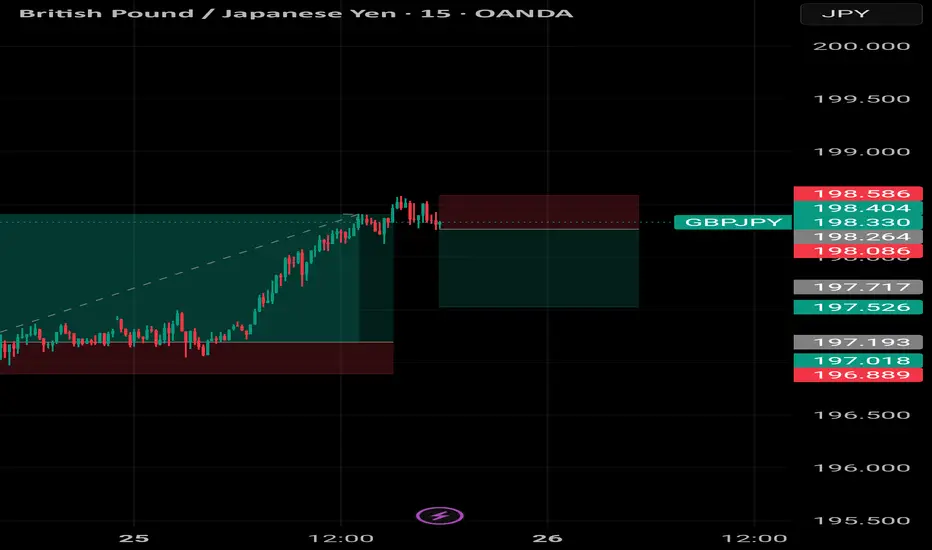
GBPJPY Shorts 6/26/25Priced formed a consolidation on Key Level 198.500 creating eQUAL Highs earlier in the day. Price broke out of the consolidation creating a bearish choch on the 15m timeframe. Price made a steep pull back into the consolidation once more tapping into a 15m OB while also taking out BSL the eQUAL High left behind. Within the 15m OB and key level there was a bearish 5m b/ch which created a 15m FVG. I drew a Fib from the 5m high/low which aligned with the 15m FVG and scaled down to the 1m time frame. From there I waited for a MsS/ch and entered the trade taking profit at the -1 deviation.
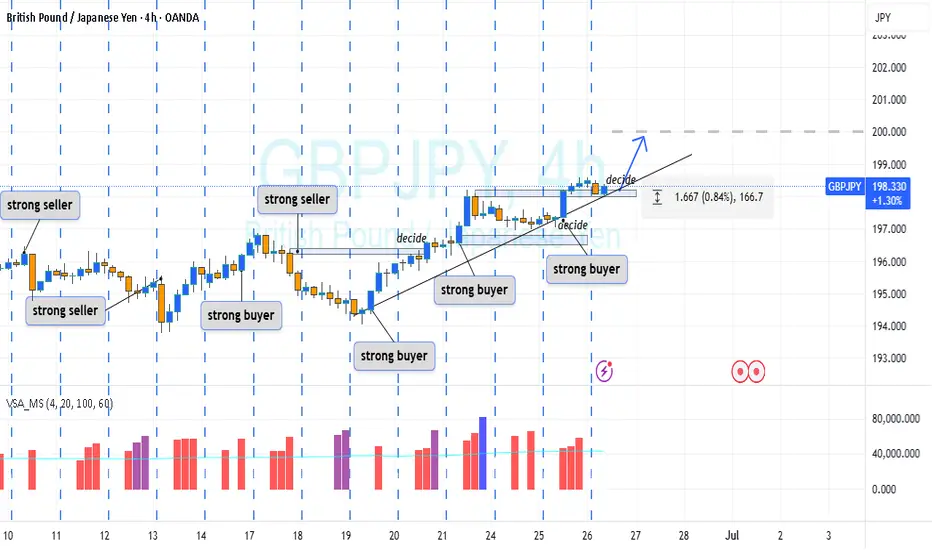
GJ-Thu-26/06/25 TDA-Huge 4hFVG created, how gj will react?Analysis done directly on the chart
Follow for more, possible live trades update!
I often share my live trades in Tradingview public chat in London session, stay tuned!
Hot take of the day:
I'd rather want people to understand the thought process
behind the market structure, how price will likely to move,
than giving blindly signals. This might not be attractive, but
learning the skill is better than follow signals without
understanding why you are doing it.
Active in London session!
Not financial advice, DYOR.
Market Flow Strategy
Mister Y

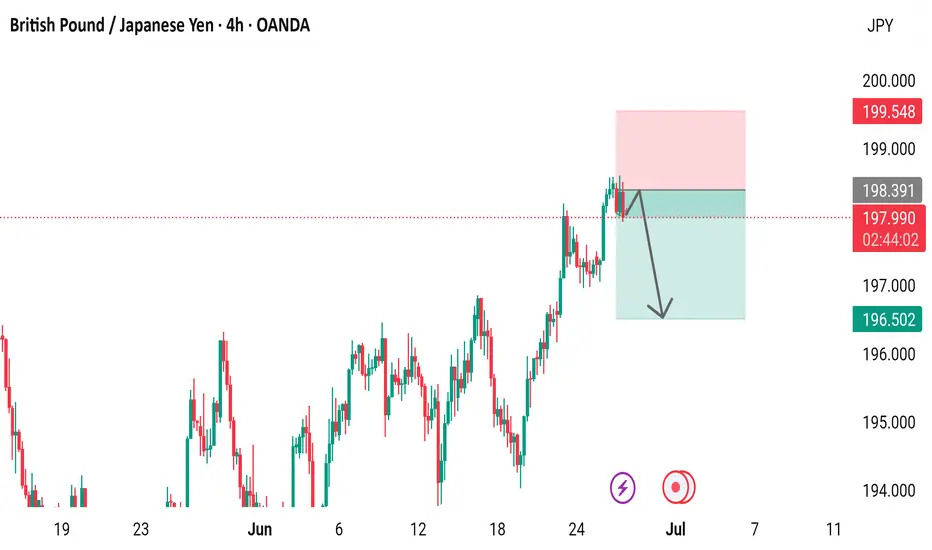
GBP/JPY 4-Hour Chart (OANDA) - June 26, 20254-hour performance of the British Pound (GBP) against the Japanese Yen (JPY) from OANDA, as of June 26, 2025, 11:14 AM PKT. The current exchange rate is 197.978, reflecting a decrease of 0.509 (-0.26%). The chart highlights a recent downward trend after reaching a peak near 199.548, with key support and resistance levels marked between 196.502 and 199.548.
GBPJPY SHORT FORECAST Q2 W26 D26 Y25GJ SHORT FORECAST Q2 W26 D26 Y25
Professional Risk Managers👋
Welcome back to another FRGNT chart update📈
Diving into some Forex setups using predominantly higher time frame order blocks alongside confirmation breaks of structure.
Let’s see what price action is telling us today! 👀
💡Here are some trade confluences📝
✅Weekly Order Block Identified
✅Daily Order block identified
✅4H Order Block identified
✅15' Order block identified
🔑 Remember, to participate in trading comes always with a degree of risk, therefore as professional risk managers it remains vital that we stick to our risk management plan as well as our trading strategies.
📈The rest, we leave to the balance of probabilities.
💡Fail to plan. Plan to fail.
🏆It has always been that simple.
❤️Good luck with your trading journey, I shall see you at the very top.
🎯Trade consistent, FRGNT X
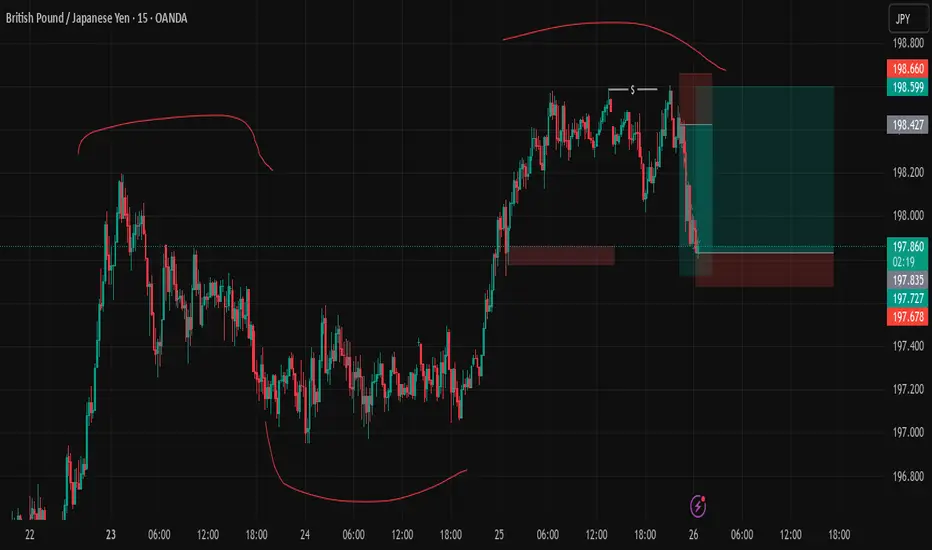
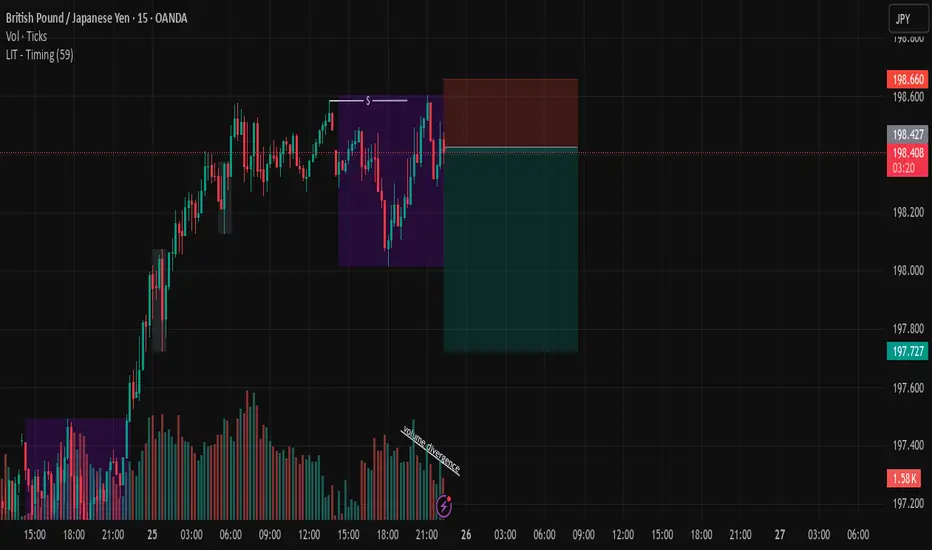
GBPJPY SellAsia induced high, slow price movement upward(correction/build up), and also volume divergence.
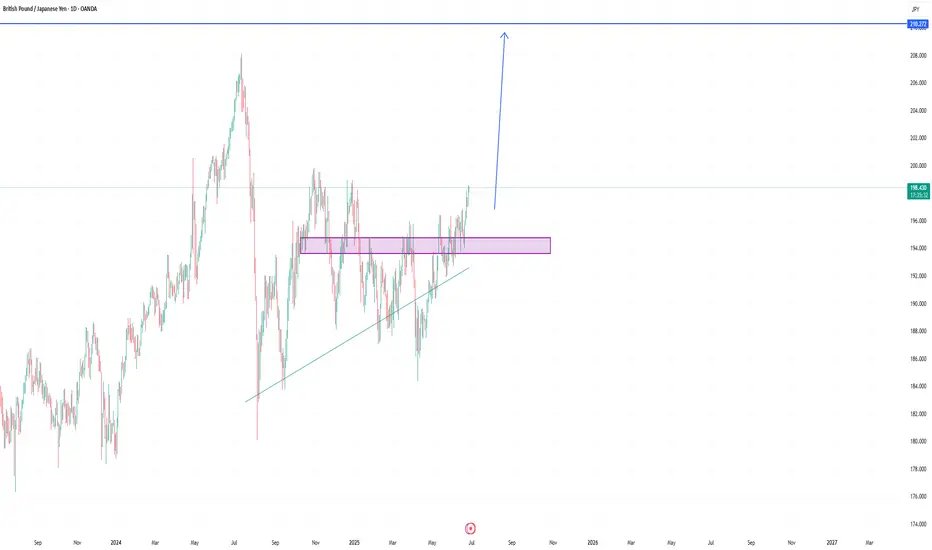
GBPJPY will spike soonAfter price break swap zone, the price keep pressure to make higher high.
My expectation is the price will break previous high at Daily timeframe.
Any chance to enter buy at lower timeframe please consider to execute
GBPJPY?
Hi Guys,
I am on buyside this week
Hoping.. stronger than ever. Will break 200.oo
Will check strength of pound and weakness of yen. Fundamentals
All the best
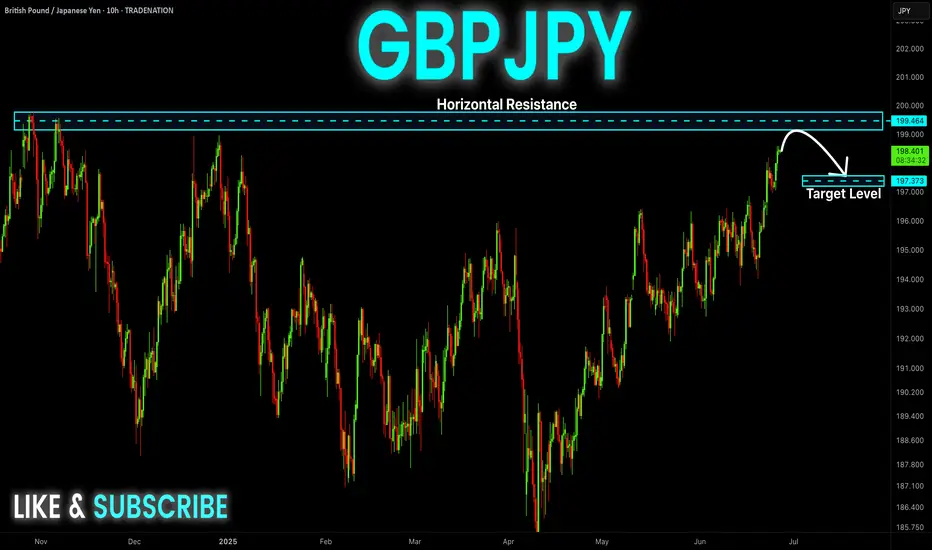
GBP-JPY Resistance Ahead! Sell!
Hello,Traders!
GBP-JPY keeps growing
In a strong uptrend and
The pair is locally overbought
So after the pair hits the
Horizontal resistance level
Around 199.803 we will
Be expecting a local
Bearish correction
Sell!
Comment and subscribe to help us grow!
Check out other forecasts below too!
Disclosure: I am part of Trade Nation's Influencer program and receive a monthly fee for using their TradingView charts in my analysis.
GBPJPY I Intraday Short from Top of the ChannelWelcome back! Let me know your thoughts in the comments!
** GBPJPY Analysis - Listen to video!

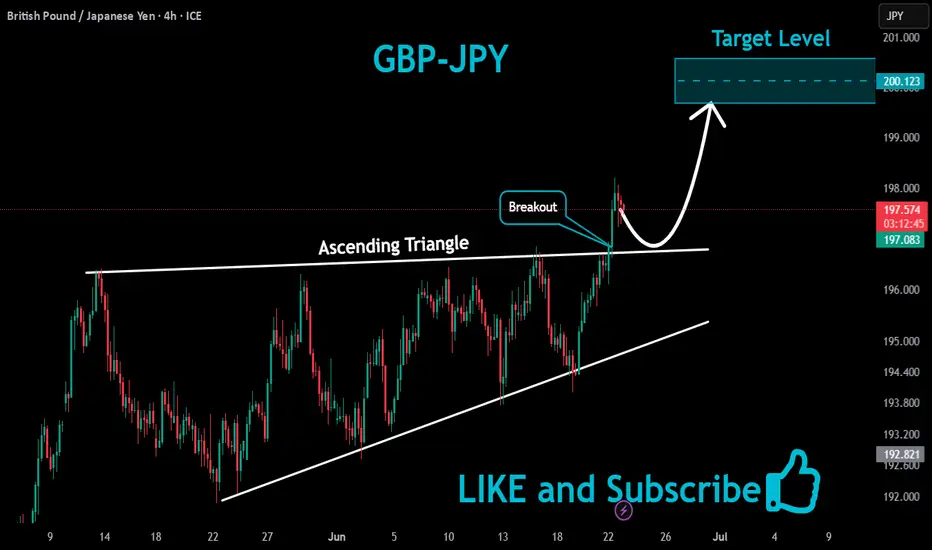
GBPJPY Ascending Triangle Breakout!
HI,Traders !
#GBPJPY is trading in an
Uptrend and the pair is
Now breaking out of the
Ascending Triangle so we
Are bullish biased now
And we will be expecting a
Further move up !
Comment and subscribe to help us grow !
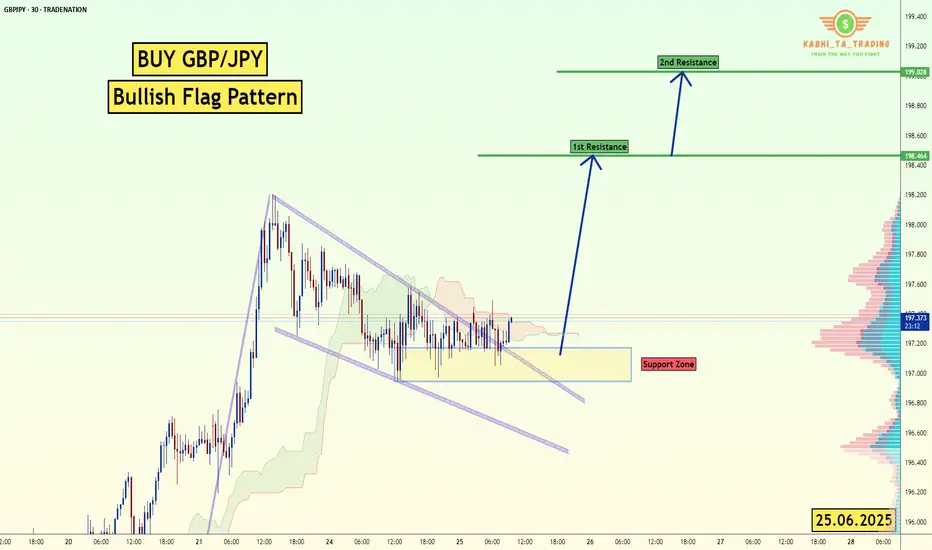
GBP/JPY Bullish Flag (25.06.2025) The GBP/JPY pair on the M30 timeframe presents a Potential Buying Opportunity due to a recent Formation of a Bullish Flag Pattern. This suggests a shift in momentum towards the upside and a higher likelihood of further advances in the coming hours.
Possible Long Trade:
Entry: Consider Entering A Long Position around Trendline Of The Pattern.
Target Levels:
1st Resistance – 198.46
2nd Resistance – 199.00
🎁 Please hit the like button and
🎁 Leave a comment to support for My Post !
Your likes and comments are incredibly motivating and will encourage me to share more analysis with you.
Best Regards, KABHI_TA_TRADING
Thank you.
Disclosure: I am part of Trade Nation's Influencer program and receive a monthly fee for using their TradingView charts in my analysis.
GJ sugar high VS reevesThe sugar high will wear off as the risk on geo tension premium evaporates & the fiscal liability hits from Reeves' autumn budget, it's a 1 to 5 reward and I'm betting the farm, or in my case the seedling! happy hunting
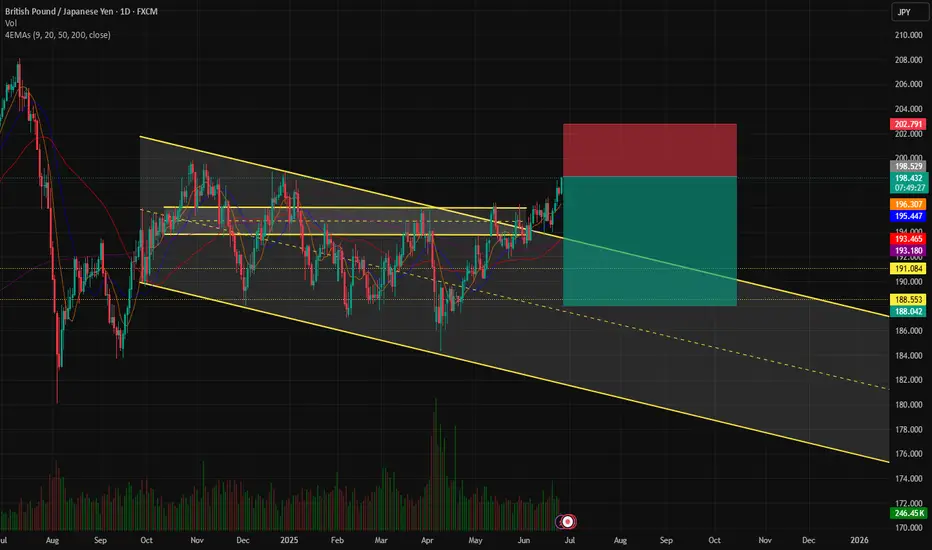
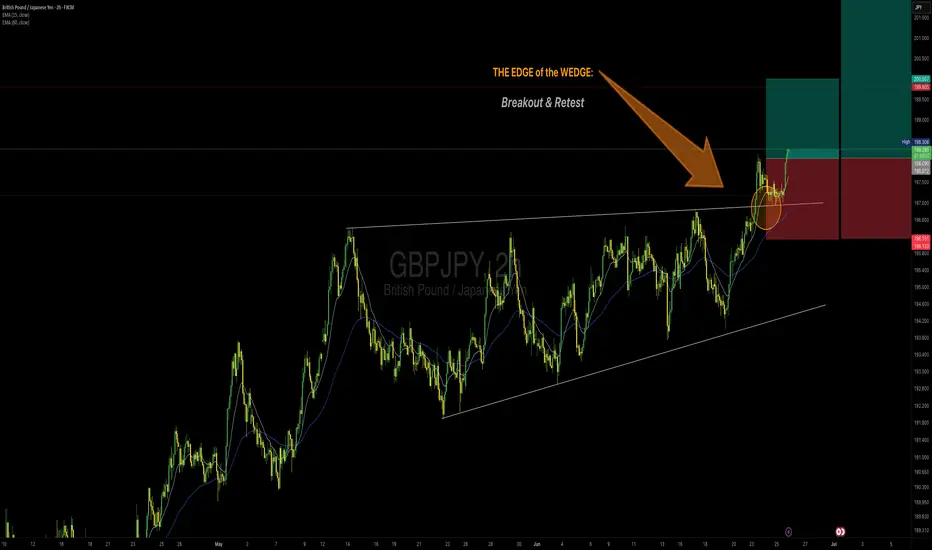
Edge of the Wedge || GBPJPY
Simply Breakout and retest of the Edge of the Wedge
Entry: 198
Tp1: 200
TP2: 202
TP3: 204
SL: 196
A classic trend following setup
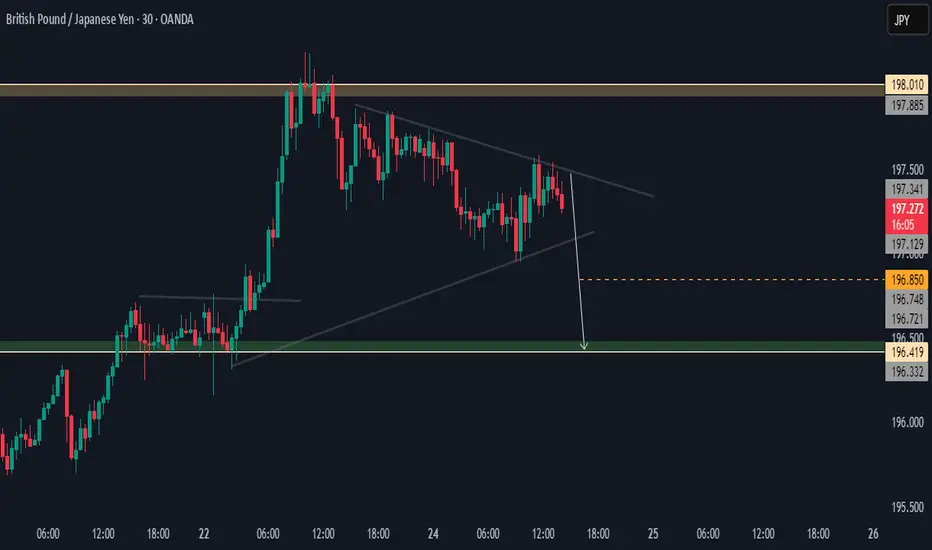
GJ Showing Bearish Pressure.Hi there,
GJ looks bearish on the M30 chart, with a price target of 196.850 and a bias of 196.419.
If the price reverses and breaks through 198.010, that will invalidate the bias.
Happy Trading,
K.
Not trading advice
GJ-Wed-25/06/25 TDA-Bullish structure created, more upsidesAnalysis done directly on the chart
Follow for more, possible live trades update!
I often share my live trades in Tradingview public chat in London session, stay tuned!
Knowing when not to trade is as important as taking good trades.
Just like you can take good trades, good wins. Understanding when not
to trade, it can saves you from bad trades and avoidable losses.
Easy to say than done.
Active in London session!
Not financial advice, DYOR.
Market Flow Strategy
Mister Y

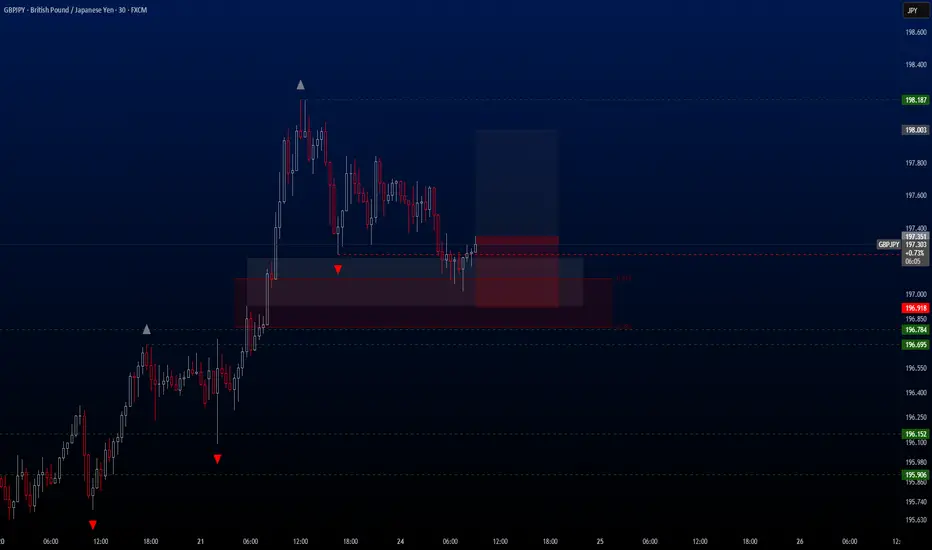
GBPJPY Hello traders.
The first trading opportunity of the day comes from the GBPJPY pair. The bullish scenario on this pair remains intact, and this is largely due to its strong correlation with USDJPY.
For the first time since May 17, USDJPY has climbed back to the 147.00 level, which has triggered momentum across all other JPY-related crosses. GBPJPY is one of the strongest beneficiaries of this movement, and we are now seeing a solid buy setup on the 30-minute chart.
I’ve personally entered the trade and am sharing the full breakdown with you below:
🔍 Trade Details
✔️ Timeframe: 30-Minute
✔️ Risk-to-Reward Ratio: 1:1.50
✔️ Trade Direction: Buy
✔️ Entry Price: 197.351
✔️ Take Profit: 198.003
✔️ Stop Loss: 196.918
🕒 If momentum weakens or the price stalls in a tight range, I will keep this trade open only until 23:00 (UTC+4). After that, I’ll close it manually—whether in profit or loss—depending on how price action evolves.
🔔 Disclaimer: This is not financial advice. I’m simply sharing a trade I’ve taken based on my personal trading system, strictly for educational and illustrative purposes.
📌 Interested in a systematic, data-driven trading approach?
💡 Follow the page and turn on notifications to stay updated on future trade setups and advanced market insights.
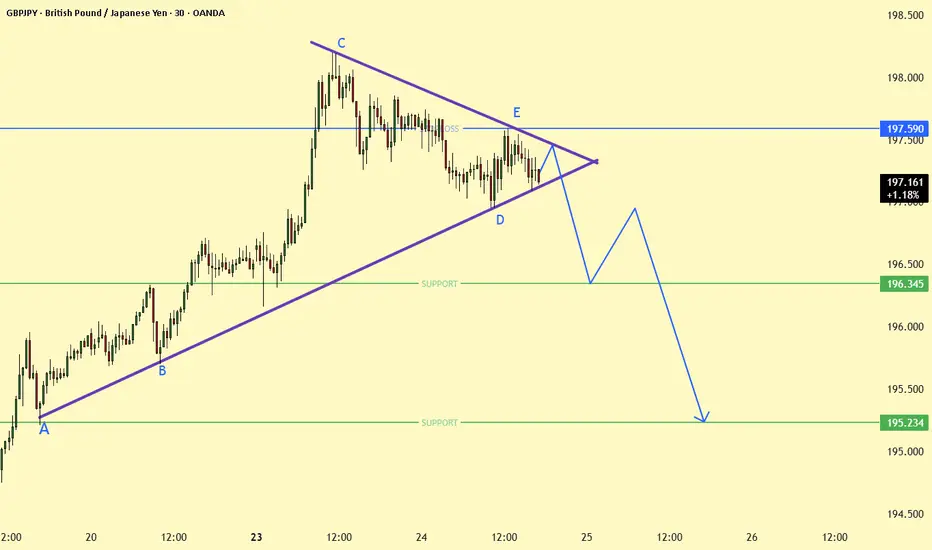
GBPJPY fromed Symmetrical Triangle Enter on Breakout 🔻 Bias: Bearish
Lower highs and tightening range indicate weakening bullish momentum.
A confirmed break below the 196.345 support could trigger a bearish move.
Downside targets:
TP1: 195.60
TP2: 195.23
🔍 Invalidation:
Bullish breakout above 197.59 would negate this setup and suggest trend continuation.
Strategy: Wait for a clean breakout and retest for confirmation. Use tight SL above the triangle if entering short.
Counter pullback In EU at the moment price is very bullish looking at daily and 4hr time frame. In daily price has managed to break above the weak internal HH so after the break we must expect a counter pullback with LTF confirmation which we can see in 4hr where it has created fresh internal structure so I am expectating price to continue lower from its supply zone. But if price manages to break the structure to bullish I will be looking to buy from the newly formed demand zone.
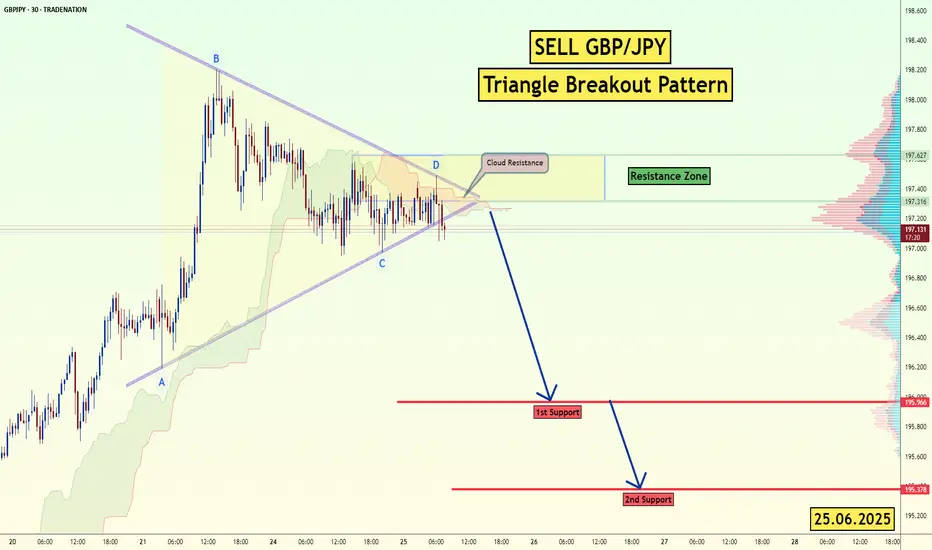
GBP/JPY Triangle Breakout (25.06.2025)The GBP/JPY Pair on the M30 timeframe presents a Potential Selling Opportunity due to a recent Formation of a Triangle Breakout Pattern. This suggests a shift in momentum towards the downside in the coming hours.
Possible Short Trade:
Entry: Consider Entering A Short Position around Trendline Of The Pattern.
Target Levels:
1st Support – 195.96
2nd Support – 195.37
🎁 Please hit the like button and
🎁 Leave a comment to support for My Post !
Your likes and comments are incredibly motivating and will encourage me to share more analysis with you.
Best Regards, KABHI_TA_TRADING
Thank you.
Disclosure: I am part of Trade Nation's Influencer program and receive a monthly fee for using their TradingView charts in my analysis.