GBPJPY → Assault on the resistance 196.400FX:GBPJPY under the pressure of the bull market breaks through the resistance with the aim of possible continuation of growth and retest of the liquidity zone
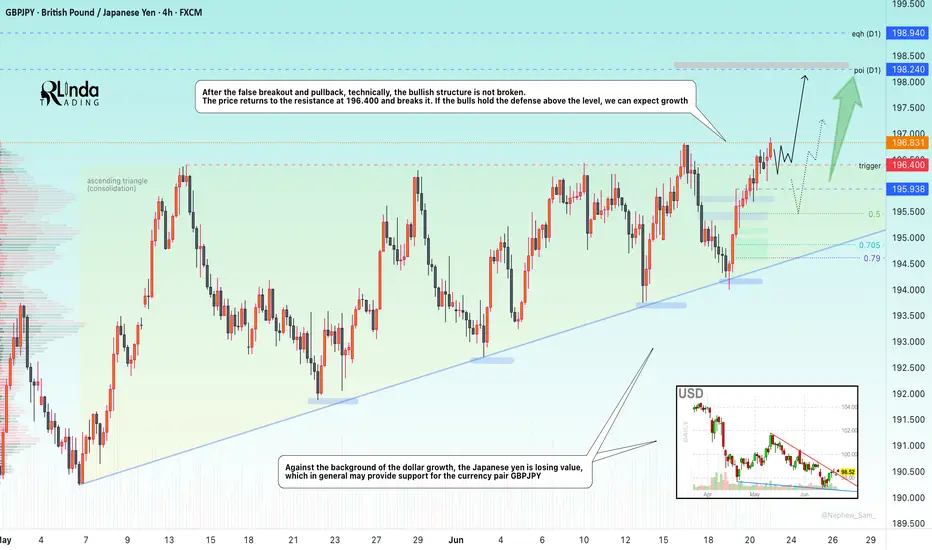
Against the background of the dollar growth, the Japanese yen is losing value, which in general may provide support for the currency pair GBPJPY
The currency pair, after a false breakout of the key resistance and a small correction, technically, the bullish structure has not broken. The price returns to the resistance at 196.400 and breaks it. If the bulls hold their defenses above the level, we can expect a rise
Resistance levels: 196.400, 198.24
Support levels: 195.94, 195.45
Consolidation above 196.400, retest and break of 196.93 may trigger continuation of the growth. Zones of interest 198.24, 198.94
Regards R. Linda!
GBPJPY trade ideas
GBPJPY| Midweek OutlookEven though it’s midweek, I wanted to share an update on GBPJPY and walk you through the process so far.
Price has been showing clear bullish structure from the 4H down to the 30M, so I remained patient and waited for price to revisit and mitigate a bullish order block — and that’s exactly what we got.
Now that mitigation has played out, I’m watching closely for LTF confirmations to line up. Ideally looking for entry opportunities around 196.006 – 195.922, depending on how the lower timeframes react and confirm.
Not rushing anything — just executing based on structure, mitigation, and confirmation. I’ll continue updating as price develops.
#GBPJPY #SMC #OrderBlock #SmartMoneyConcepts #PriceAction #ForexTrading #GJSetup #MidweekOutlook #InducementKing #DayTrader
Bless Trading!
Short GJPrice has leave the price value area, from the price action I anticipate that price will go back to the diagonal line.
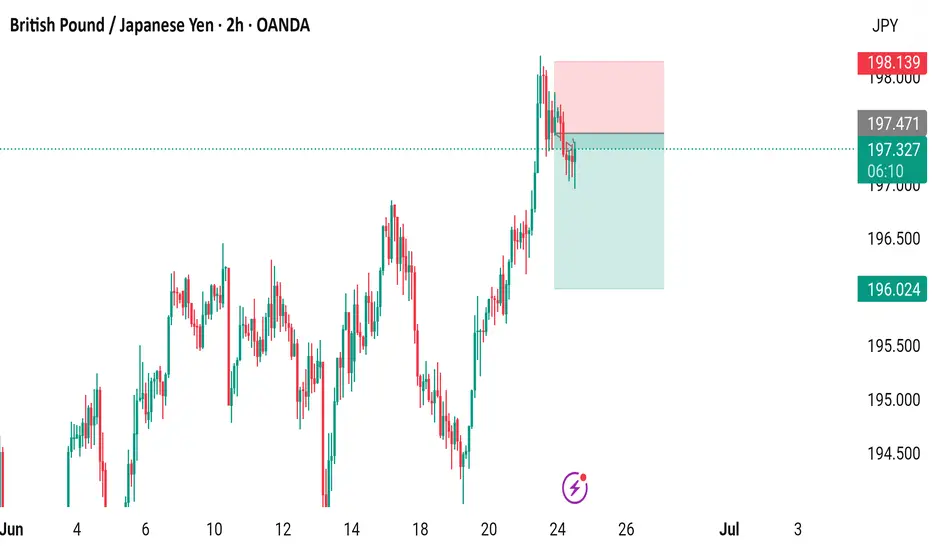
GBP/JPY 2-Hour Chart - OANDA2-hour performance of the British Pound (GBP) against the Japanese Yen (JPY) from OANDA, covering the period from June 4 to July 3, 2025. The current exchange rate is 197.308, reflecting a slight decrease of 0.364 (-0.18%). The chart highlights a recent upward trend with a notable peak followed by a decline, with key price levels marked at 197.471, 197.308, and 196.024.
GBPJPY Potentially BullishOANDA:GBPJPY has been on a bullish trajectory and with the current breakout to the upside signifying a potential bullish continuation. With this in mind, I will wait to see a proper re-test around the 196.839 and then see a price action confirmation before taking the trade. Until then, fingers crossed.
#GBPJPY
Disclaimer: Past results does not guarantee future results, do your due diligence.
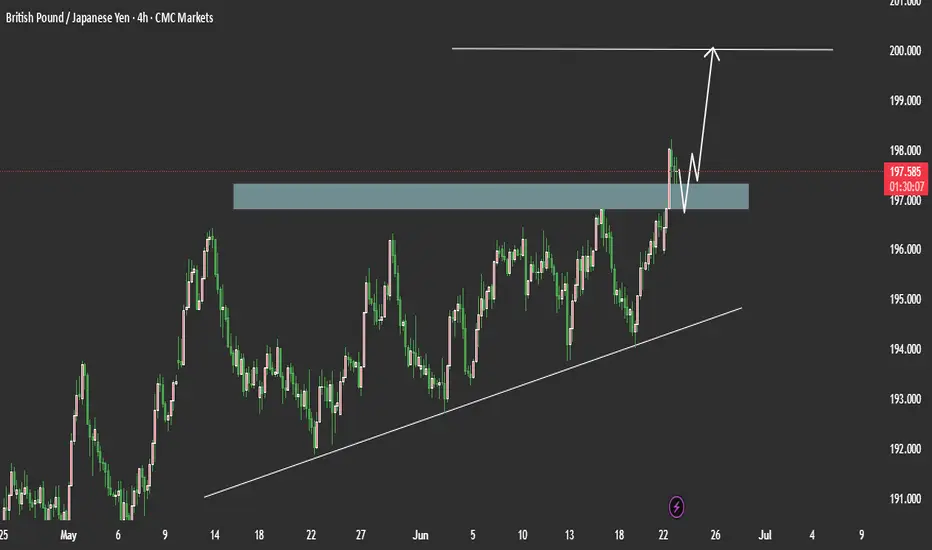
GBPJPY Bullish Momentum AnalysisGBPJPY Bullish Momentum Analysis
The GBPJPY pair is currently under bullish pressure, having broken through key resistance levels suggesting the potential for further upside continuation. This movement is supported by a weakening Japanese yen, driven in part by the continued strength of the US dollar and rising global yields.
Resistance Levels 200.00
Support Levels 196.000
Technically Key resistance and small correction the bullish structure has not broken the price returns break and get there resistance.
You May find more detils in the chart Ps Support with like and comments for more analysis.
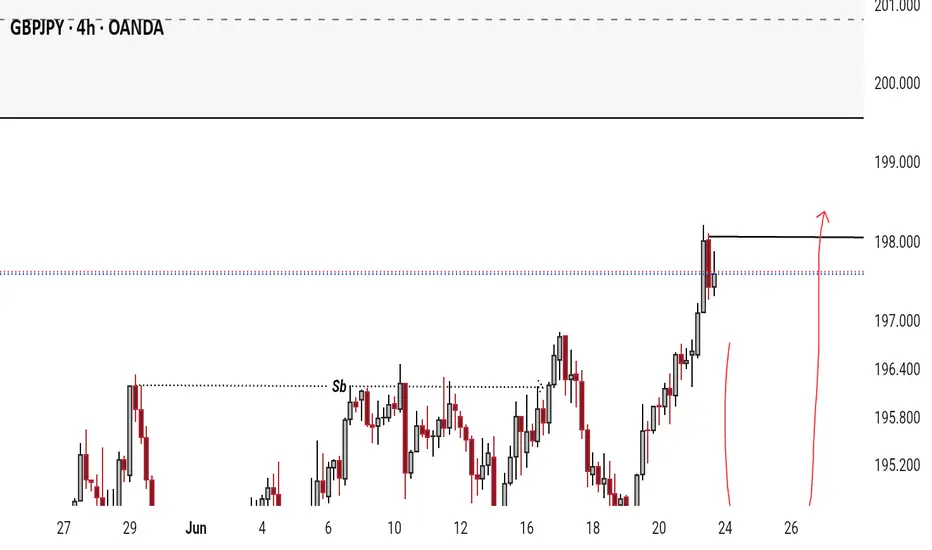
Pound-Yen Finds Support with Eyes on 198.1FenzoFx—GBP/JPY is forming bullish long-wick candlesticks near 196.8, just above key support at 196.5.
The market remains bullish above this zone, with potential to retest 198.1. A sustained move higher could extend the rally.
The bullish outlook is invalidated if GBP/JPY closes below 196.5.
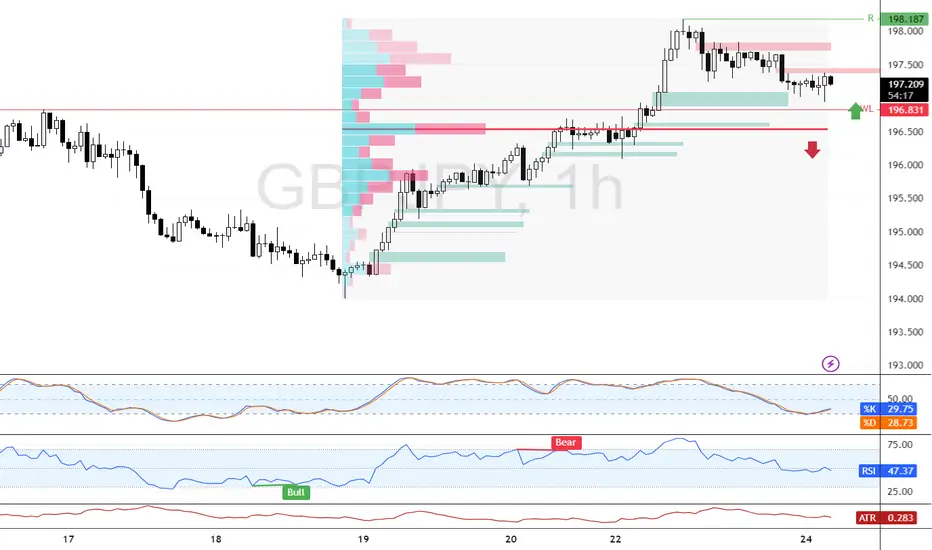

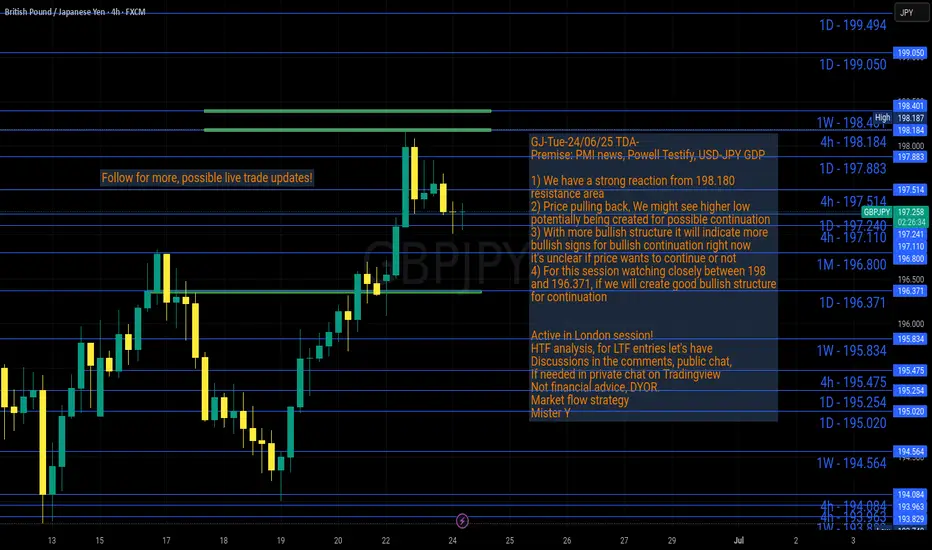
GJ-Tue-24/06/25 TDA-Strong resistance area 198.180Analysis done directly on the chart
Follow for more, possible live trades update!
A good advise is always to have understanding of the whole picture,
once you identified the full picture then come down to little details
that shapes the big picture.
Example trading related: understanding the
Higher timeframe structure (htf). This is what
We call the "Top Down Analysis" (TDA).
Once you identified the big picture, you go to
lower timeframe structure (LTF), these are the little details.
Comment down below if you agree or disagree!
Active in London session!
Not financial advice, DYOR.
Market Flow Strategy
Mister Y
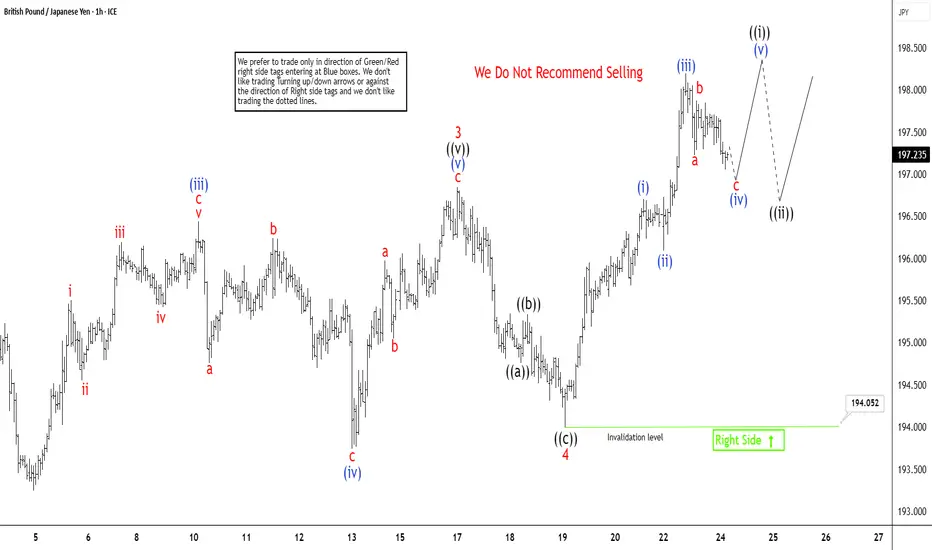
GBPJPY Elliott Wave Outlook: Impulse Pattern Approaching EndThe short-term Elliott Wave analysis for GBPJPY indicates that the cycle initiated from the April 9, 2025 low has reached a mature stage. The upward movement is unfolding as a five-wave impulse structure, a hallmark of Elliott Wave theory, signaling a strong bullish trend. Wave 1 concluded at 189.82, followed by a corrective pullback in Wave 2, which found support at 185.98. The subsequent rally in Wave 3, as depicted on the 1-hour chart, peaked at 196.84. Wave 4 then unfolded as a zigzag corrective structure. Its internal subdivisions completing as follows: Wave ((a)) declined to 194.75, and wave ((b)) rebounded to 195.33. Wave ((c)) finalized at 196, marking the completion of Wave 4 in the higher degree.
Currently, GBPJPY has resumed its ascent in Wave 5. From the Wave 4 low, the rally has so far developed in three waves. Wave (i) reached 196.7, followed by a dip in Wave (ii) to 196.09. Wave (iii) extended higher to 198.19. A corrective pullback in Wave (iv) is anticipated to find support within the 196.2–196.8 range, likely in a three-wave structure. Afterwards, one final push higher in Wave (v) should happen to complete Wave ((i)) of 5 in the higher degree. Following this, a larger-degree correction in Wave ((ii)) is expected to retrace the cycle from the June 19, 2025 low. Pullback is likely unfolding in a 3, 7, or 11-swing pattern before the pair resumes its upward trajectory.
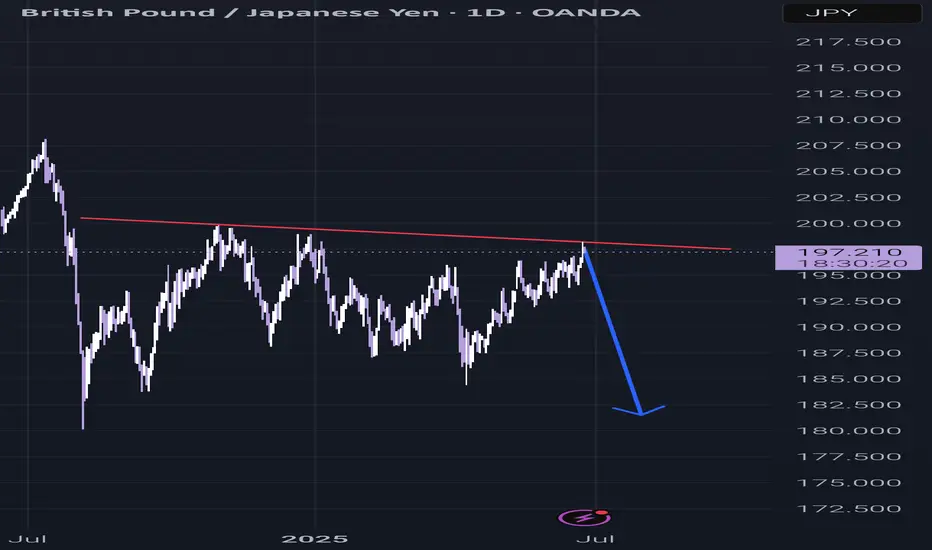
SELL GBPJPY (SELL 197.100 , SL 200.100 , TP 194.100)GBPJPY will go down soon. It seems exhausted to go up since yesterday.
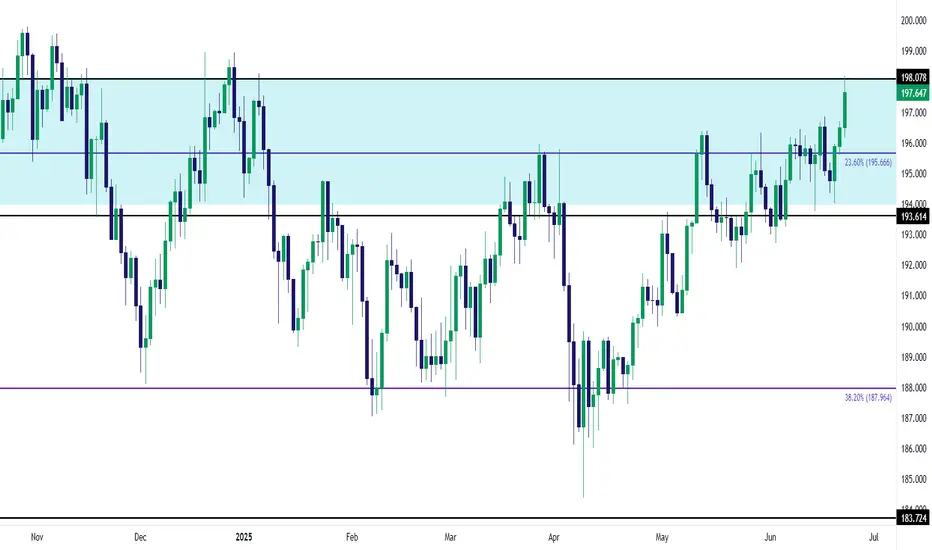
GBP/JPY Revisits 198.08All the way back in 2008, around the Financial Collapse, GBP/JPY posted a massive gap on the monthly chart and here we are, more than 16 years later, and that space on the chart continues to loom large.
The August 2008 close at 198.08 led into the September open at 193.61, and over the past couple of weeks those prices have played a big role in GBP/JPY price action, much as they have since last March when that zone finally came back into play when the gap was finally filled in April of last year.
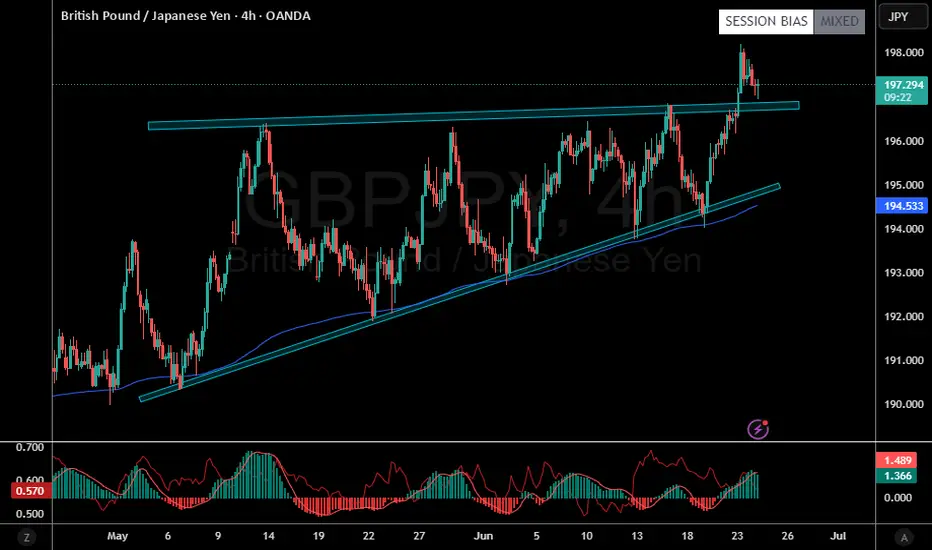
Last week GBP/JPY had set up an ascending triangle formation, with resistance around the 196.50 area and a progression of higher-lows since April and through May and early-June. Bulls defended 193.61 on a pullback last week, and came back with a vengeance to drive a breakout into this week with that 198.08 level coming back into the picture to set the current highs.
If looking for Yen-weakness, I remain of the mind that this could be a more attractive venue than USD/JPY, further illustrated by the sizable pullback showing in the major pair today compared to the move in GBP/JPY. - js
Gbp/jpy short 23/06Price broke the recent swing highand has tapped into daily supply levels. Anticipating a retracement into 196.000 for a retest of the daily zone. Head and shoulders on lowered timeframes retested, and liquidity taken with swift move back below. Jpy is also a safe haven currency and geopolitical tentions rife could cause a drop from this price area.
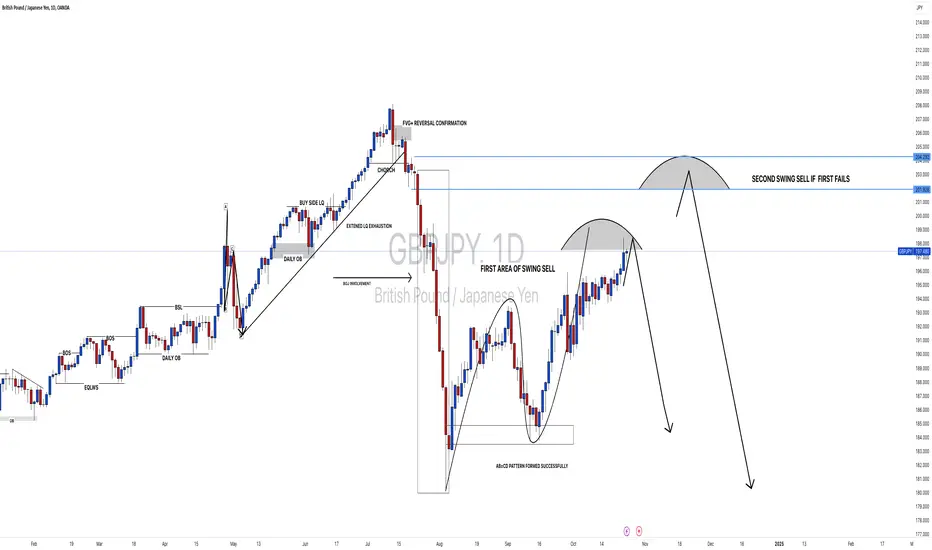
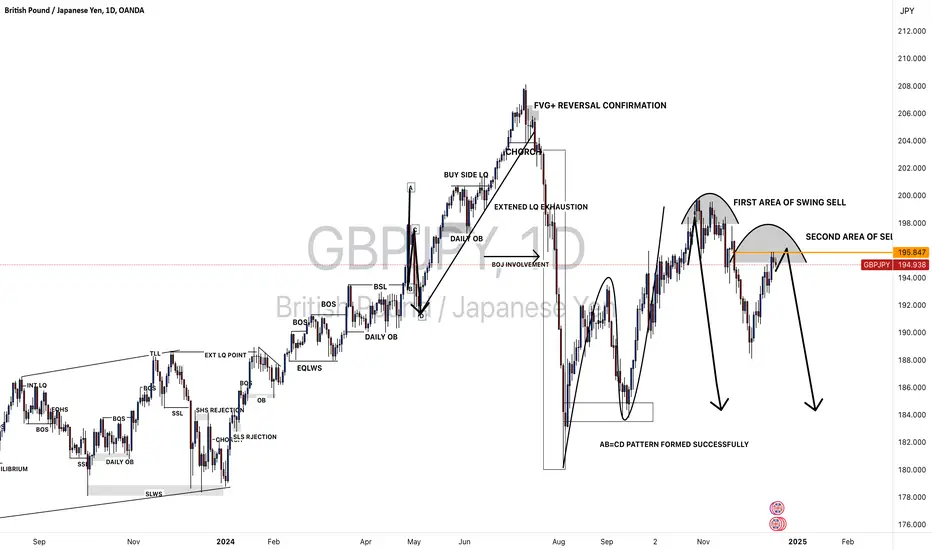
#GBPJPY: UPDATED VIEW 24/10/2024 **GBPJPY UPDATED VIEW BASED ON PREVIOUS ANALYSIS**
Dear Traders,
I hope you are doing well. Based on our previous analysis of GBPJPY, we identified two potential selling opportunities within the market.
However, the bullish sentiment in the DXY currency pair has had a significant impact on JPY, causing it to fall short of its full value within the daily timeframe. As of today, we have observed a potential exhaustion of DXY’s bullish momentum, with four-hour candles indicating a strong bearish pressure. This development presents an opportunity for JPY to rebound, potentially allowing us to secure substantial profits within the market.
Now, let’s focus on the GBPJPY currency pair. The price has extended its bullish trend, although there is a possibility of a reversal from its current position. We recommend implementing appropriate stop-loss orders for any sell entries taken from the current market price. If the initial entry fails, we are confident that the price is likely to reverse from our second entry.
Before making any decisions based on this analysis, it is essential to conduct your own research. This analysis is solely for educational purposes and should not be considered financial advice.
We appreciate your feedback and support. If you find our work valuable, please consider liking and commenting on our ideas. Additionally, following us will provide us with encouragement and motivation.
Best regards,
Team SetupsFX_
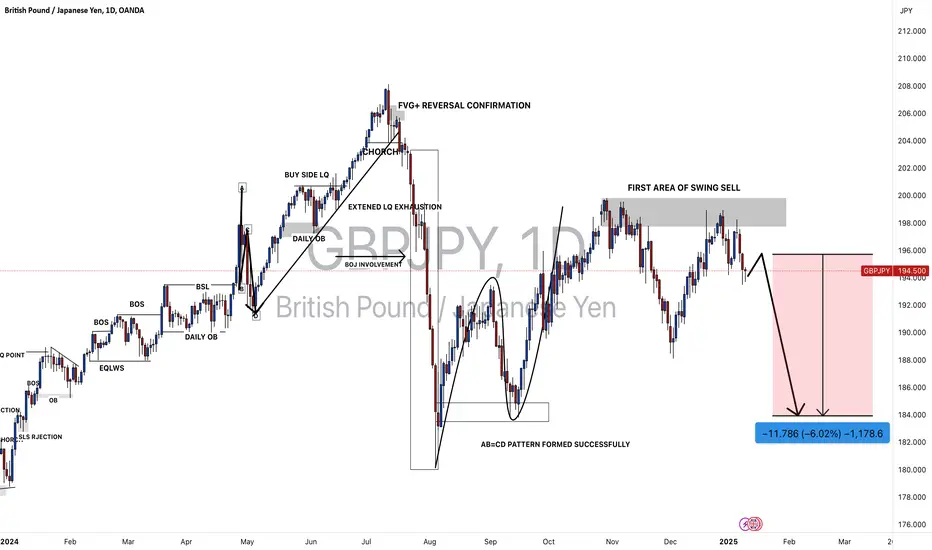
#GBPJPY: 1170+ Massive Sell Opportunity! Get Ready For Big MoveDear Traders,
We have an excellent selling opportunity on GBPJPY, with over 1100+ selling move is likely to occur within next couple of weeks. Please use accurate risk management. For more chart related information read the chart carefully.
GBPJPY: A Big Swing Sell Worth 1500+ pips! Dear Traders,
We have an excellent selling opportunity on GBPJPY with move worth up to 1500 pips! Good luck and like and comment for more!

GBPJPY: Price is trading at crucial level, Possible Swing MoveDear Traders,
GBPJPY, price is currently trading at very crucial area from where we can expect price to reverse, currently the price momentum shows a strong bearish presence. This can be a swing sell after looking at the data, price can touch the previous yearly low.
SELL TO BUYPrice;
Moved up
Broke the structure and leaving weak lows with resting liquidity above strong low.
Risky to sell, except with minimal risk
Or wait a pull back and join the rally after confirmation to buy after cleaing liquidity
GBPJPY 4Hr Chart Analaysis The GBP/JPY pair is showing signs of a potential bearish reversal. The key resistance level at 198.214 -199.372 may serve as a turning point, with price projected to decline toward the 190.588 support area in the upcoming sessions.
clear sell trade on GbpjpyIts a clear supply zone and its waiting for its mitigation, Always look out for the time market mitigates. Basic session i look out for is London, new york and Asian. and always for for that 50 percent using the fib

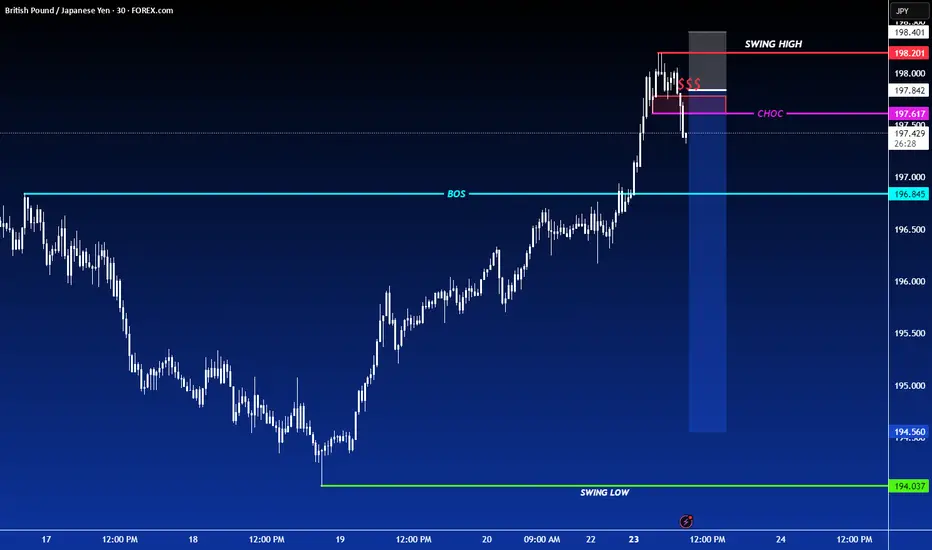
SHORT ON GBP/JPYGJ has given us a CHOC (change of character) on the Lower timeframes breaking a strong low.
I will be selling GJ to the next demand level basically catching the pullback to its overall UPTREND.
looking to catch 200-300 pips this week.
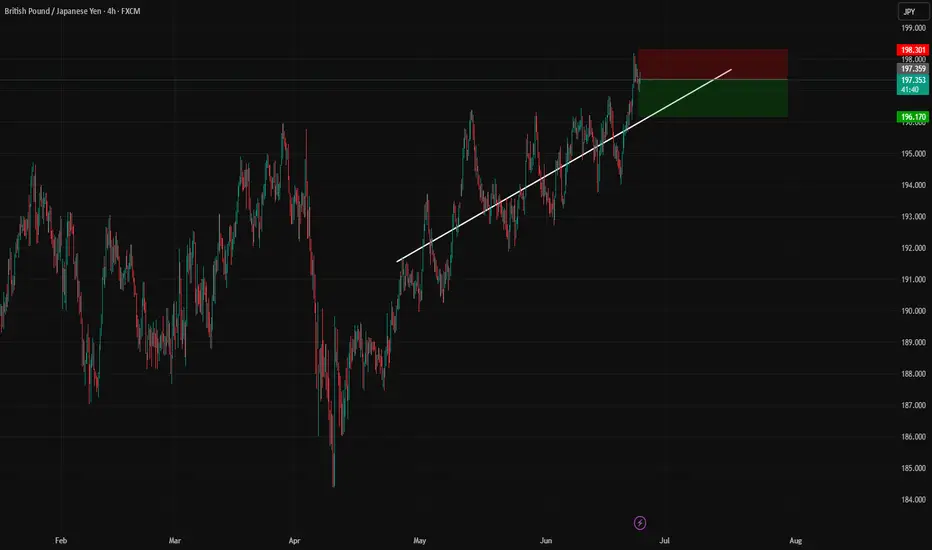
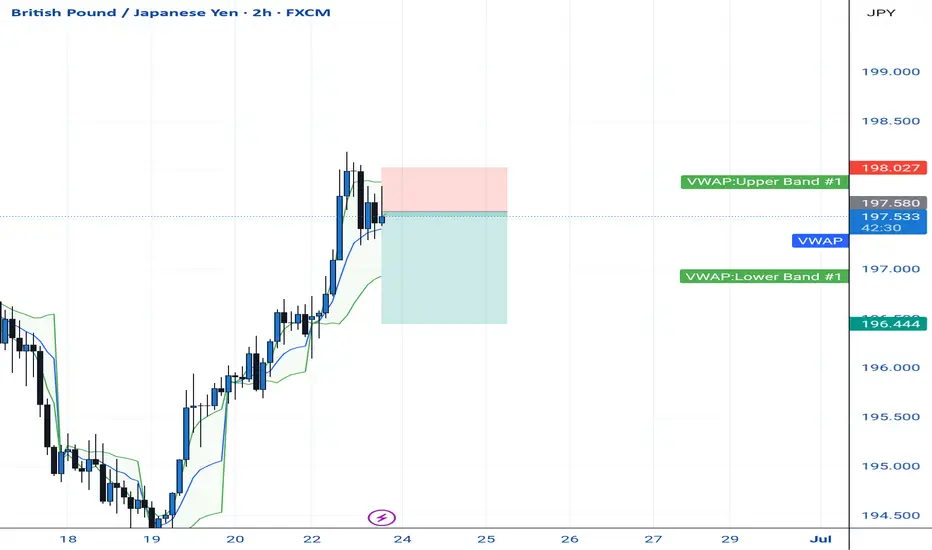
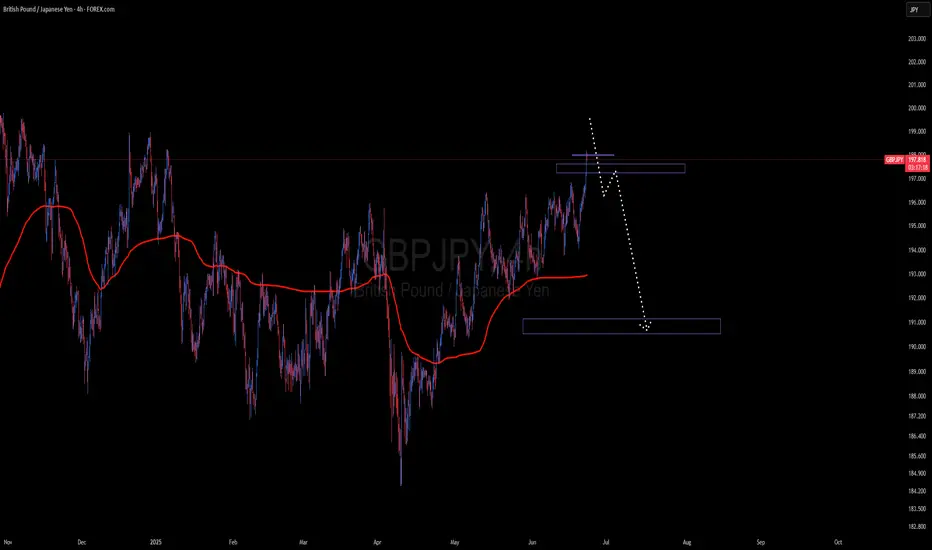
GBPJPY Double Play – Short from Channel Top into Key Buy ZoneCurrently in a short position from the top of the ascending channel (197.600s area), where price tapped into confluence:
• Rising wedge upper trendline
• Key Fibonacci zone (between -27% and 61.8%)
• Extended bullish move with clear signs of exhaustion
Trade Plan – Phase 1 (Sell):
I’m targeting the red box zone as marked on the chart, which aligns with prior structure support around 194.80–194.60, and also sits in a strong Fibonacci pocket (around the 61.8% retracement of the most recent impulse leg).
• Entry (Sell): ~197.600
• TP (Sell): 194.800
• SL: Above 197.750 (wick high)
⸻
Trade Plan – Phase 2 (Buy):
Once price taps into the red box, I’ll flip bias to long for a bullish continuation trade. This zone has acted as demand multiple times and aligns with:
• Lower trendline support
• Fib confluence zone
• Institutional-style stop hunt structure
Looking for a clean bullish signal (engulfing, pin bar, or strong volume reaction) before entering the buy. Expecting price to return to 196.3–197+ on the rebound.
• Buy Limit Zone: 194.800–194.600
• SL: Below 194.200
• TP: 196.300–197.000+