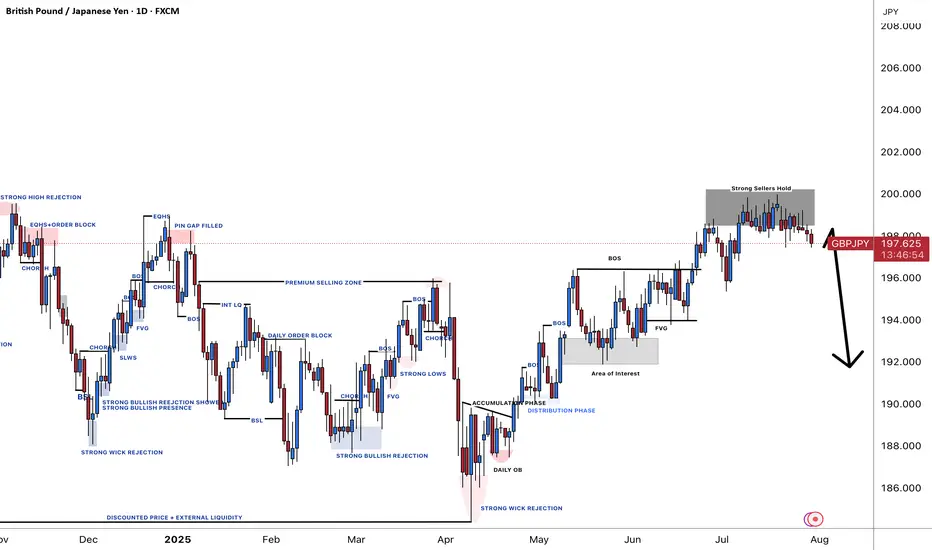
GBPJPY; 600+ PIPS Possible Selling Opportunity GBPJPY has failed to breakthrough 200 price region, suggesting a strong sellers hold. Price behaviour and volume show the same thing. Our target is at 191 which will be a 600 to 700 pips move.
Good luck and trade safe
GBPJPY trade ideas
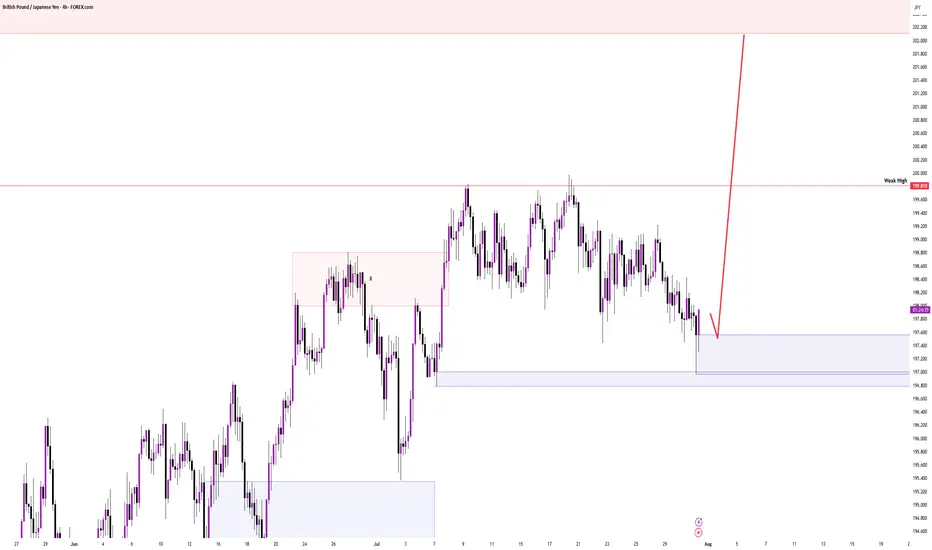
Trade Idea – GBPJPYBased on the daily market structure and Elliott Wave count, there’s potential for another bullish push to complete Wave 5.
However, on the H4 timeframe, price may still create one more lower low (LL) before confirming the upward move.
🔔 Wait for confirmation — either a break of structure or a bullish engulfing candle on the H1 timeframe before entering any buy positions.
#GBPJPY #ForexAnalysis #ElliottWave #Wave5Setup #UKTraders #USTraders #SwingTrading #PriceAction #ForexStrategy #H1Confirmation

GBPJPY Is Very Bearish! Sell!
Please, check our technical outlook for GBPJPY.
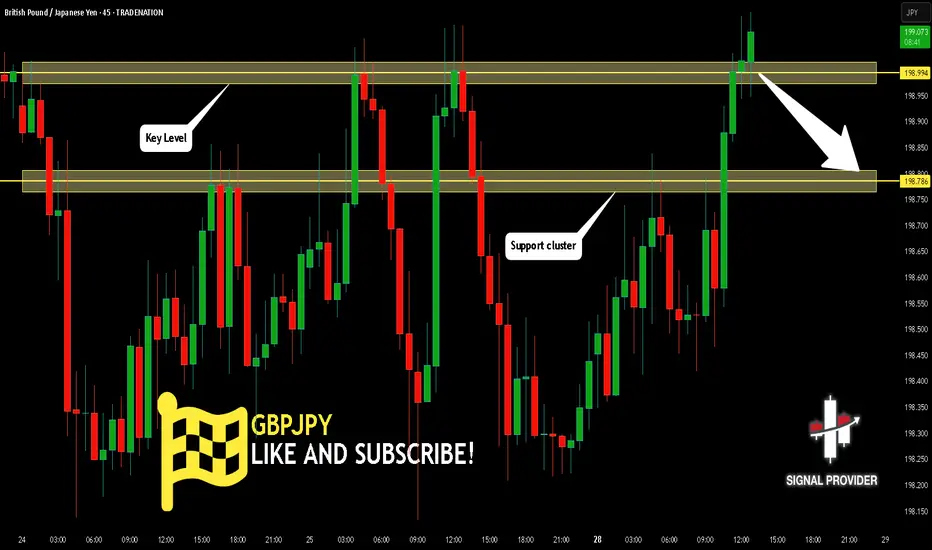
Time Frame: 45m
Current Trend: Bearish
Sentiment: Overbought (based on 7-period RSI)
Forecast: Bearish
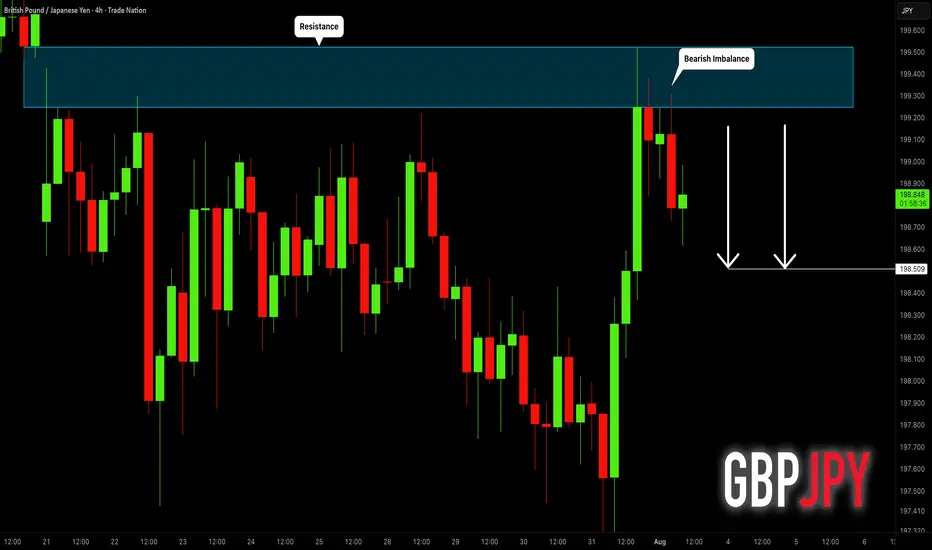
The market is approaching a significant resistance area 198.994.
Due to the fact that we see a positive bearish reaction from the underlined area, I strongly believe that sellers will manage to push the price all the way down to 198.786 level.
P.S
Overbought describes a period of time where there has been a significant and consistent upward move in price over a period of time without much pullback.
Disclosure: I am part of Trade Nation's Influencer program and receive a monthly fee for using their TradingView charts in my analysis.
Like and subscribe and comment my ideas if you enjoy them!
GBPJPY ShortGBPJPY is now net short on the regression break.
I am considering all JPY pairs as it appears a market correction may build.

GBPJPYDate:
August 3,2025
Session:
Tokyo Session
Pair:
GBPJPY
Bias:
Long
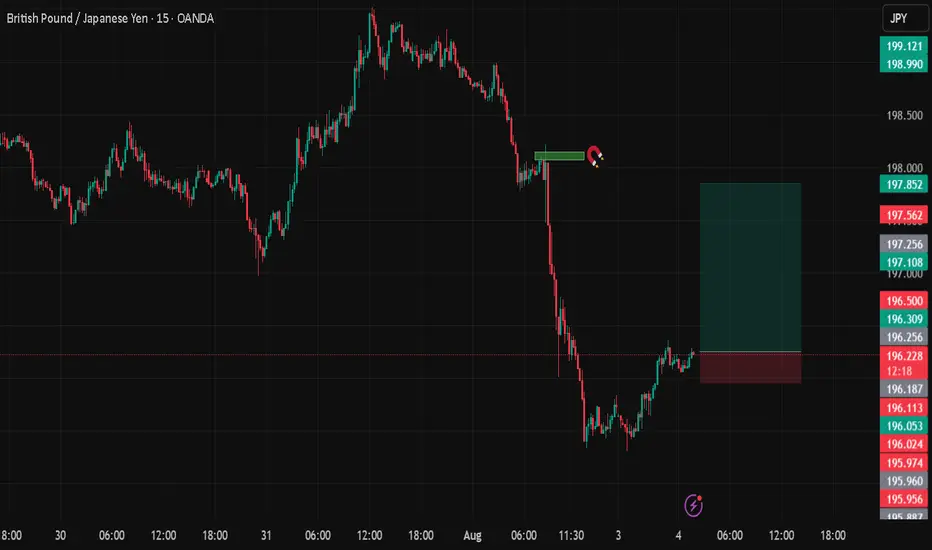
Fridays New York open left a liquidity pool. I see todays Asia or London session sweeping that area.
Entry:196.254
Stop Loss:195.957
Target:197.847
RR:5.32
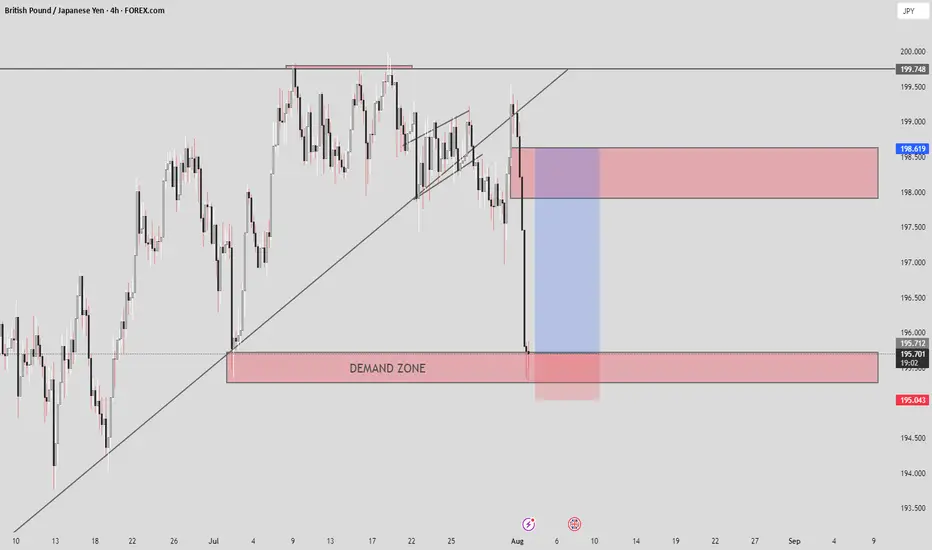
GBPJPY – Bearish Continuation Setup AheadPair: GBPJPY
Timeframe: 4H
Bias: Bearish
🔍 Technical Overview:
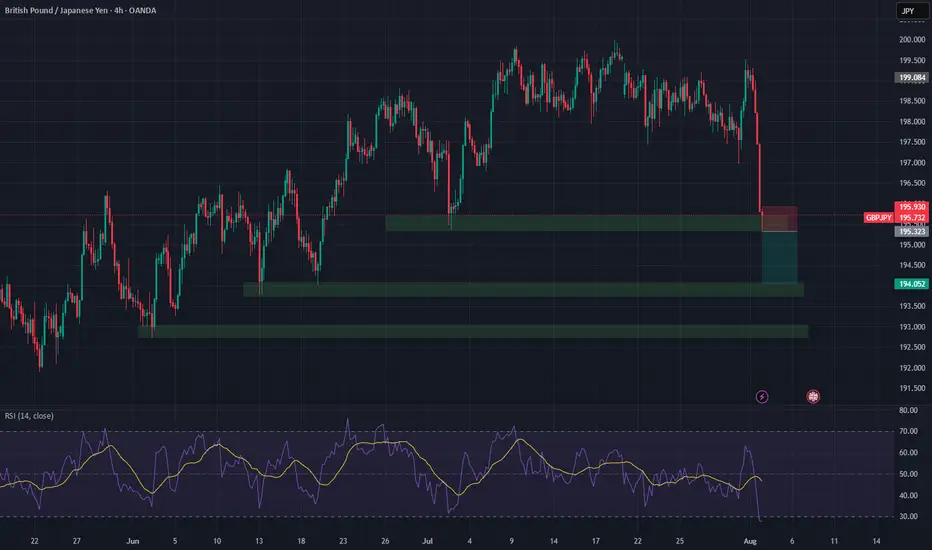
GBPJPY has broken down with high momentum and is now hovering at a 4H support zone (195.30). A clean break and close below this level opens the door for a deeper move toward the next support areas:
Entry Trigger: Break below 195.30
🎯 Target 1: 194.05
🎯 Target 2: 192.50
🛑 Stop Loss: Above 195.95 (previous resistance-turned-supply zone)
📉 RSI: 27.63 (Oversold but momentum-driven selloff suggests more downside)
🧠 Macro + Fundamental Confluence:
🏦 Central Bank Policy:
BOE (Bank of England) cut rates by 25bps (to 4.25%) in a hawkish tone, with internal disagreement (7–2 vote), signaling uncertainty and potential for further divergence.
Despite the “hawkish cut,” the market interpreted it cautiously, especially with falling UK economic momentum and weak retail data.
💴 Bank of Japan:
BoJ is slowly tightening policy — signaling an eventual exit from ultra-loose conditions.
Real interest rates remain negative, but the direction is now incrementally hawkish, strengthening the JPY across the board.
💡 Market Sentiment:
VIX at 20.42 = Risk-Off Environment → capital flows into safe-haven JPY, out of GBP.
With Nasdaq bullish, but volatility ticking up, JPY benefits from its safe-haven role.
📊 CFTC Positioning:
GBP: Longs decreasing, shorts rising, NNCs decreasing → Bearish bias
JPY: Longs flat, but massive drop in NNCs → institutional positioning is turning defensive
🧾 Economic Weakness:
UK Services PMI showing signs of stagnation
CPI and Retail Sales remain weak, suggesting limited scope for further GBP upside
Japan's latest Household Spending and Economy Watchers Survey show stabilizing conditions, supporting yen strength
📌 Final Take:
Fundamentals support the breakdown as monetary divergence and global sentiment drive capital into the JPY. Watch for confirmation via H4 close below 195.30 before entering the trade.
🧭 Trade idea aligns with macro, technicals, seasonality, and institutional flows.
GBPJPY is Holding above the SupportHello Traders
In This Chart GBPJPY HOURLY Forex Forecast By FOREX PLANET
today GBPJPY analysis 👆
🟢This Chart includes_ (GBPJPY market update)
🟢What is The Next Opportunity on GBPJPY Market
🟢how to Enter to the Valid Entry With Assurance Profit
This CHART is For Trader's that Want to Improve Their Technical Analysis Skills and Their Trading By Understanding How To Analyze The Market Using Multiple Timeframes and Understanding The Bigger Picture on the Charts

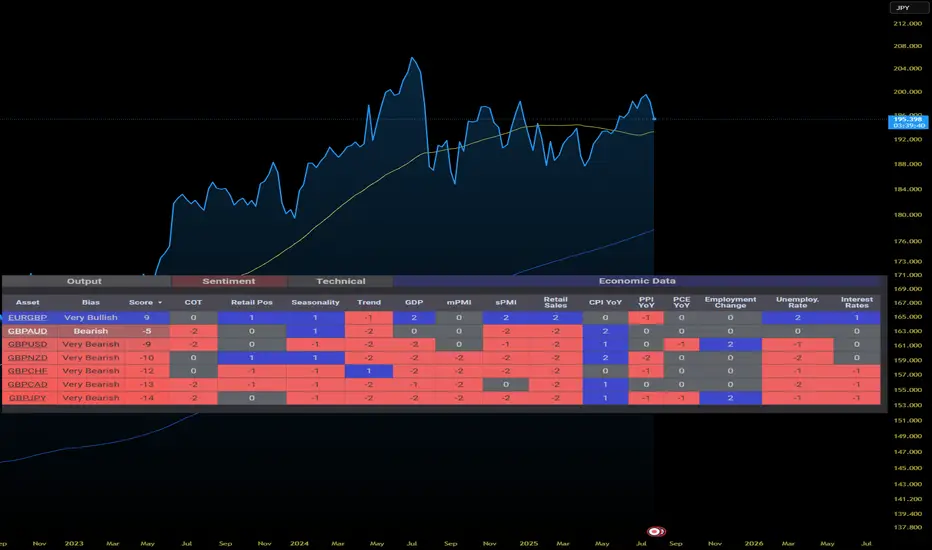
GBPJPY Fundamentally Bearish🧠 Macro-Fundamental Breakdown
🇬🇧 GBP (British Pound)
🔻 GDP Shrinking: UK growth has stalled with below-trend GDP prints 3 quarters in a row.
📉 PMI Weakness: Manufacturing and Services PMIs both under 50 = economic contraction
🧊 Retail Sales Down: UK consumer confidence and demand are cooling
💼 Labor Trouble: Unemployment ticking higher + BoE hinting at peaking rates
🪙 BoE Dovish Pivot?: Market now pricing possible cuts into early 2025.
🇯🇵 JPY (Japanese Yen)
🟢 Inflation is ticking higher
🔄 BoJ is cautiously shifting from ultra-loose policy
🛡️ Yen often strengthens in risk-off environments (which aligns with current market volatility)
🇯🇵 Tokyo CPI surprises have reinforced JPY support
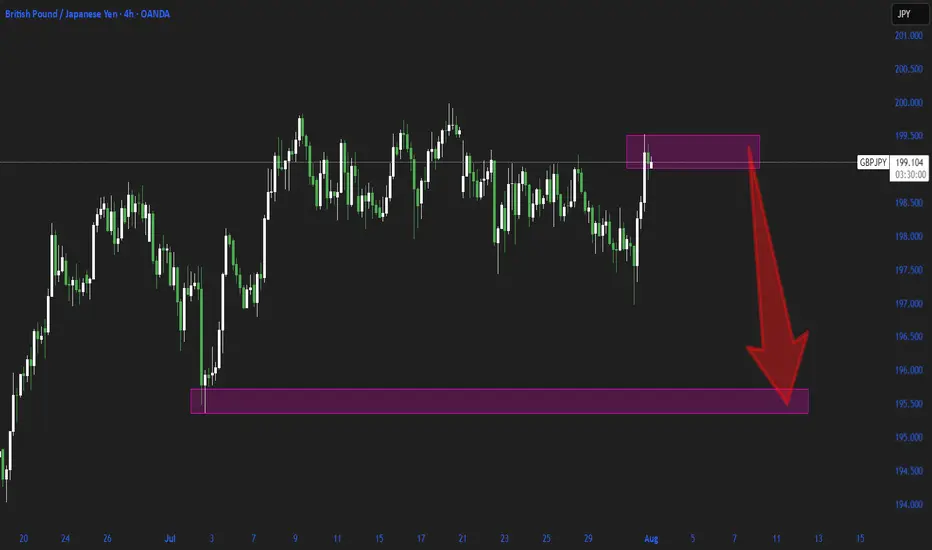
GBP JPY Another sell opportunityIn my previous analysis, I mentioned that GBP/JPY would turn bearish — and it dropped beautifully, around 280 pips.
Now, a new sell opportunity is setting up, and we can look to enter another short position.
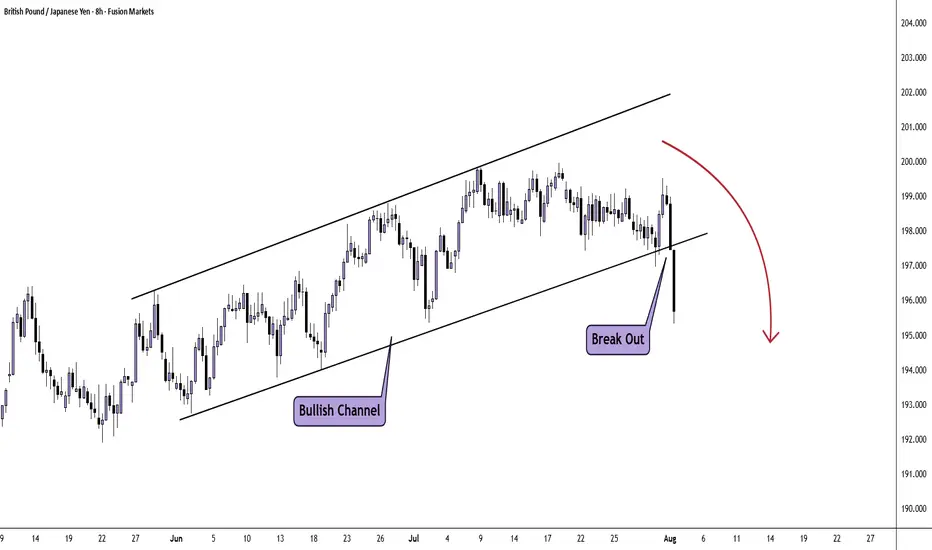
GBP/JPY H8 AnalysisPrice has been bullish since April this year with the most recent price action forming a parallel channel.
On Friday we saw a solid break lower and close below the channel. This could possibly lead to further downside.
Look for a trade that meets your strategy rules.
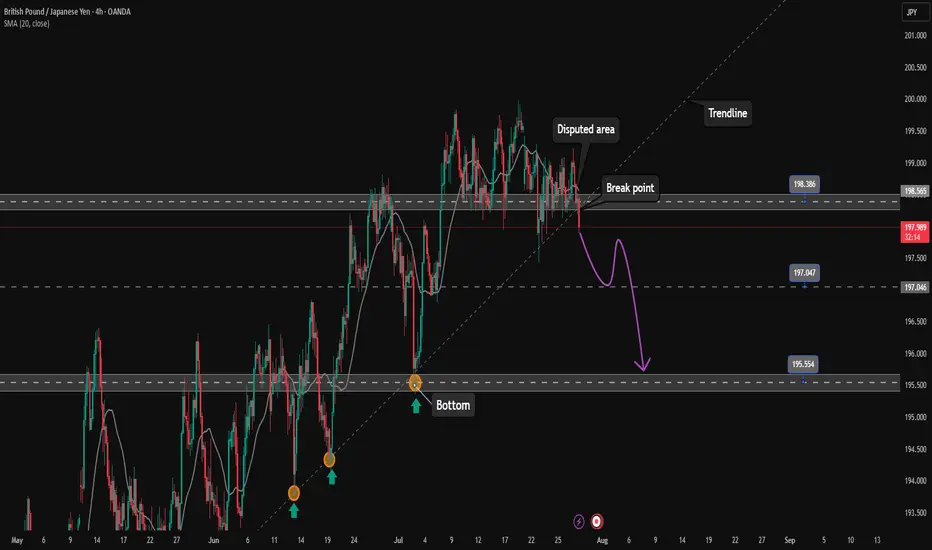
GBPJPY starts corrective downtrend. Ready to SELL✏️ OANDA:GBPJPY has broken the trendline structure and broken the disputed zone. Price is heading towards the support zone ahead around 197.000. This is considered a breakout zone for DCA rather than BUYing at this zone. The downtrend of GBPJPY may extend to the bottom of last week.
📉 Key Levels
SELL now GBPJPY 198.000
SELL trigger: Break support zone 197.000
Target 195.500
Leave your comments on the idea. I am happy to read your views.
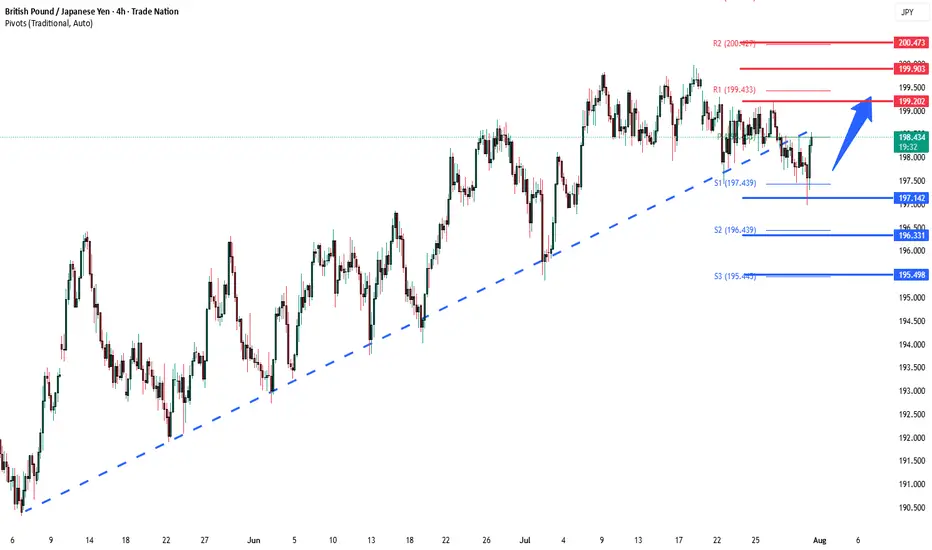
GBPJPY key support at 197.75Key Support: 196.75
This level marks the prior consolidation zone and serves as a critical pivot. A corrective pullback toward 196.75 followed by a bullish reversal would validate the uptrend, with upside targets at:
199.20 – Initial resistance and short-term target
199.70 – Minor resistance zone
200.40 – Longer-term breakout objective
However, a daily close below 196.75 would invalidate the bullish scenario, potentially triggering a deeper retracement toward:
195.80 – Near-term support
194.80 – Key downside level in a bearish reversal
Conclusion:
As long as 196.75 holds, the bias remains bullish, favoring continuation toward the 199–200 zone. A confirmed break below this support would shift momentum, opening the door for a broader corrective decline.
This communication is for informational purposes only and should not be viewed as any form of recommendation as to a particular course of action or as investment advice. It is not intended as an offer or solicitation for the purchase or sale of any financial instrument or as an official confirmation of any transaction. Opinions, estimates and assumptions expressed herein are made as of the date of this communication and are subject to change without notice. This communication has been prepared based upon information, including market prices, data and other information, believed to be reliable; however, Trade Nation does not warrant its completeness or accuracy. All market prices and market data contained in or attached to this communication are indicative and subject to change without notice.
GBPJPY is in the Down Trend From Resistance LevelHello Traders
In This Chart GBPJPY HOURLY Forex Forecast By FOREX PLANET
today GBPJPY analysis 👆
🟢This Chart includes_ (GBPJPY market update)
🟢What is The Next Opportunity on GBPJPY Market
🟢how to Enter to the Valid Entry With Assurance Profit
This CHART is For Trader's that Want to Improve Their Technical Analysis Skills and Their Trading By Understanding How To Analyze The Market Using Multiple Timeframes and Understanding The Bigger Picture on the Charts
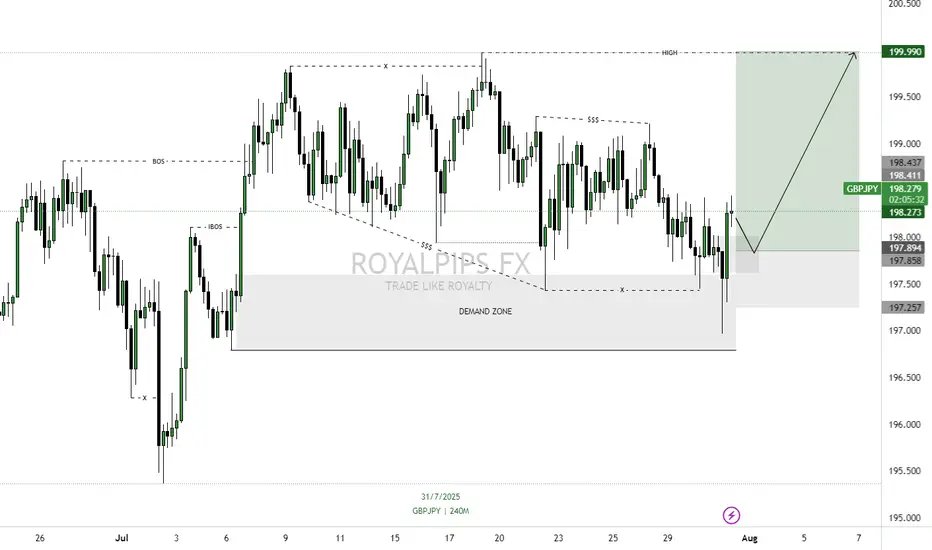
GBPJPY LONG OPPORTUNITYPrice has returned to a higher time frame demand zone after a clear pullback (retracement) and is now showing signs of rejection, where it has now mitigated previous unfilled buy orders. We’re seeing early signs of bullish intent and anticipate a continuation to the upside as demand takes control.
🔍 Detailed Breakdown:
1. Demand Zone:
• Price recently retraced back into this zone, completing a full mitigation.
• A clear reaction followed, indicating institutional orders may have been filled.
2. Market Structure:
• Previous structure broke to the upside (BOS) confirming shift in intent.
• We anticipate a higher low formation followed by a new higher high, respecting bullish structure.
3. Liquidity Sweep:
• Sell-side liquidity resting below the recent low has been swept before the bullish move began.
• This aligns with institutional behavior: taking out early sellers before raising price.
4. Entry Logic:
• Waiting for a minor retracement or lower timeframe BOS for refined entry.
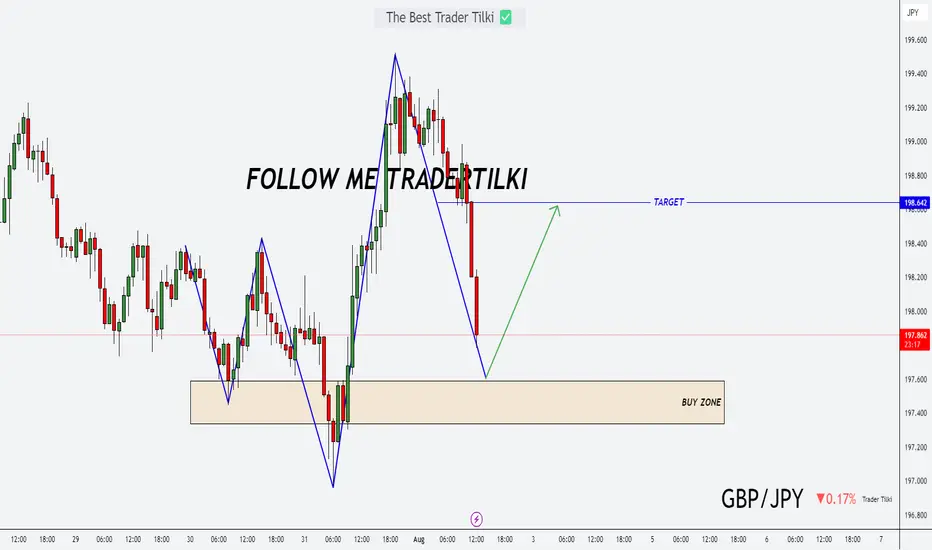
Today’s Opportunity: Stay Sharp on GBPJPY!Hey friends,
Here's my latest analysis on GBPJPY.
📌 Buy Entry Zone: 197.590 - 197.336
🎯 Target Level: 198.642
📅 Today, major economic data will be released from the U.S.
Make sure to factor this into your fundamental analysis.
📊 It’s not just about the charts—fundamentals matter too.
Technical + Fundamental = Powerful outcomes ✅
💬 Every like and bit of support keeps me going.
Thanks so much to everyone backing this journey! 🙌
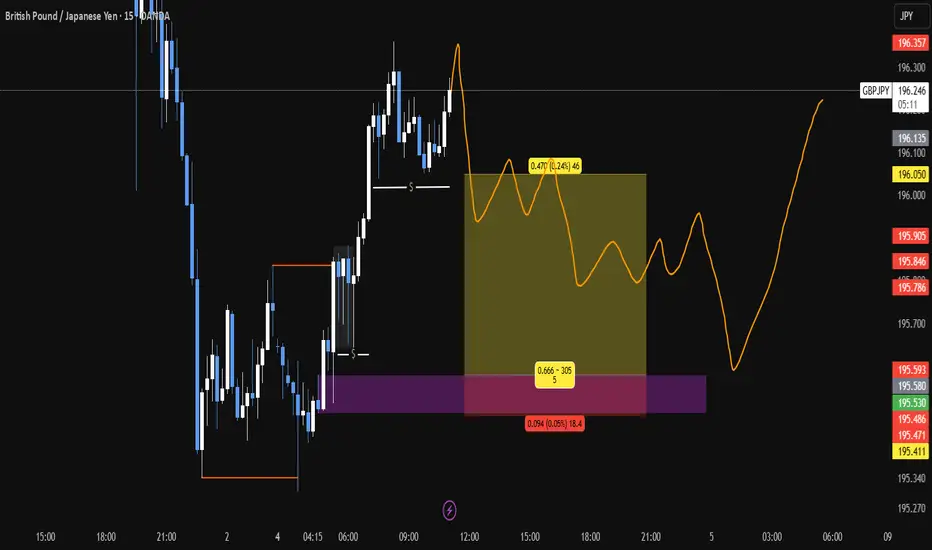
GBPJPY Buydaily cycle, lit cycle. Inducement for london has happened and price should continue upward.
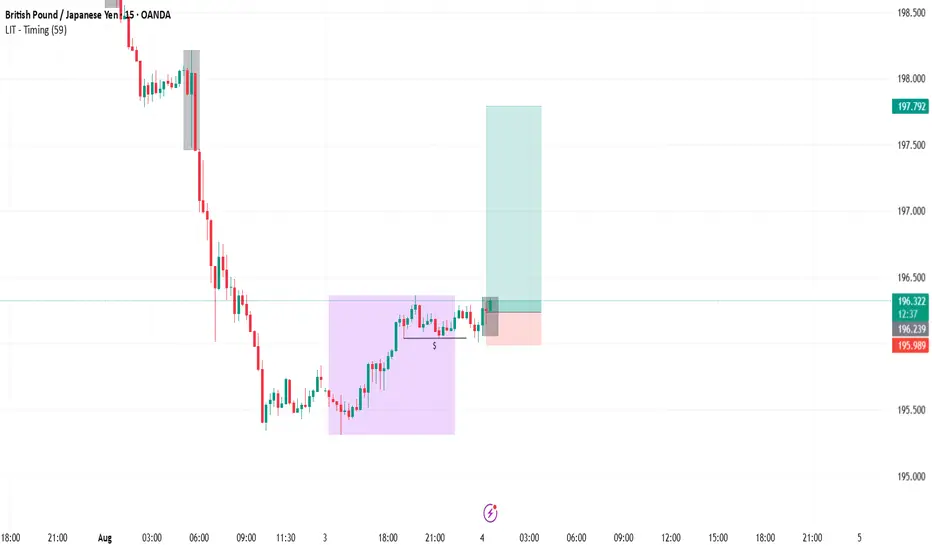
GBPJPY BUYBUY @195.580
SL @195.486
TP @196.050
If it moves above and create a BOS, then close the trade....
And always risk 1%
GBPJPY pullback for another bullish moveDaily candle closed with strong bullish.
A healthy pullback observed during Asian session.
I'm waiting at marking area for buy entry.
Calculate your own risk & reward.
Good Luck
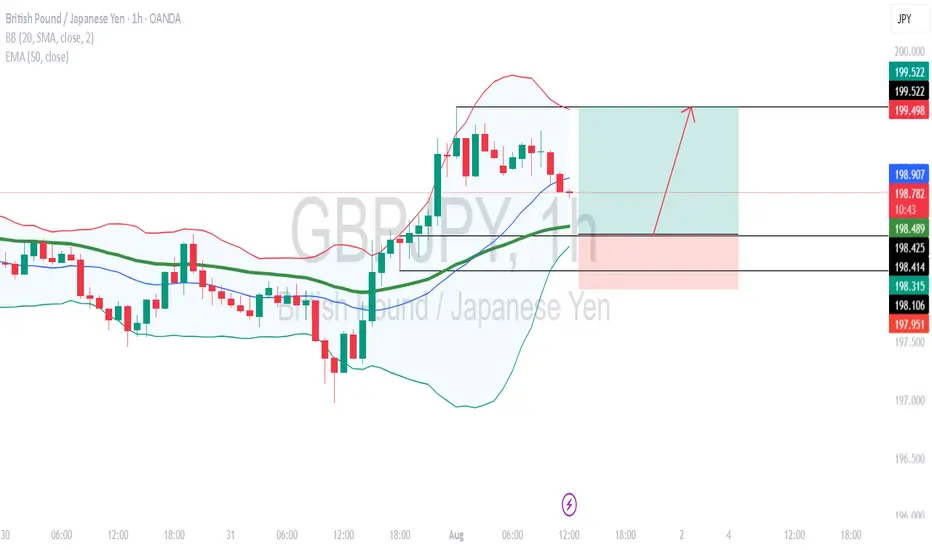
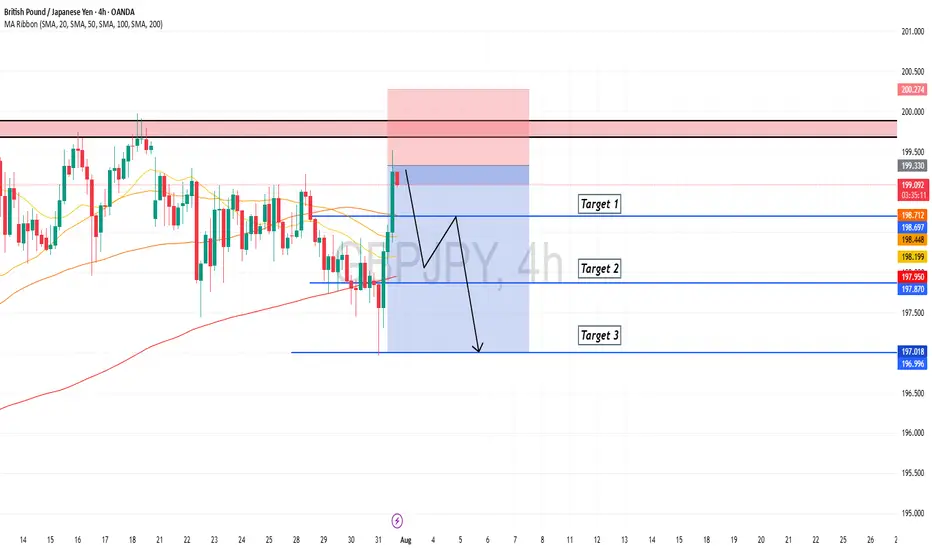
GBPJPY: Pullback From Resistance 🇬🇧🇯🇵
I think that GBPJPY will pull back from a wide
intraday supply area.
As a confirmation, I see a bearish imbalance candle that
is formed after its test.
Goal - 198.51
❤️Please, support my work with like, thank you!❤️
I am part of Trade Nation's Influencer program and receive a monthly fee for using their TradingView charts in my analysis.
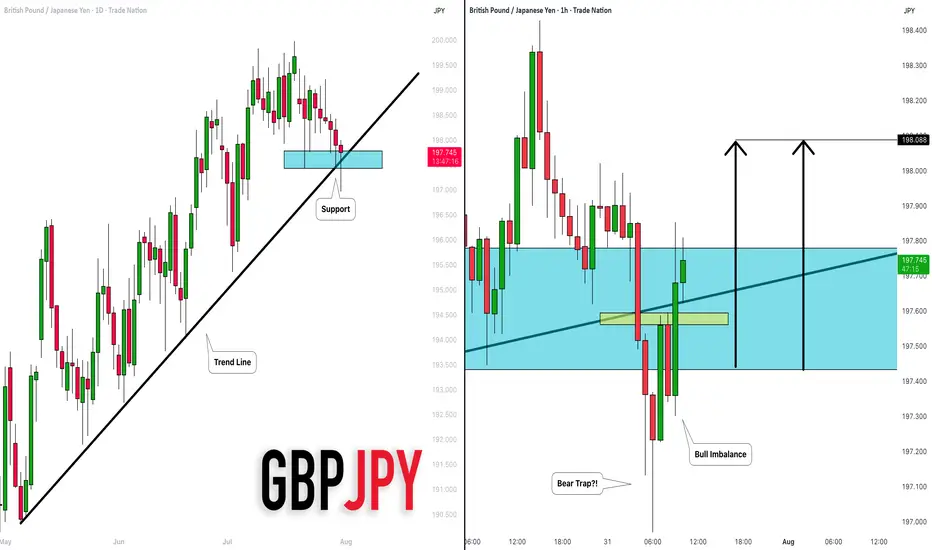
GBPJPY: Important Demand Zone 🇬🇧🇯🇵
GBPJPY is trading within an important demand zone that
is based on a rising trend line and a horizontal support.
We see a false violation of that and a bear trap, followed
by a bullish imbalance candle.
I think that the pair may go up and reach at least 198.08 level.
❤️Please, support my work with like, thank you!❤️
I am part of Trade Nation's Influencer program and receive a monthly fee for using their TradingView charts in my analysis.
SELL BIAS ON GBPJPYWith price potentially making a shift from buyside to sell side. There will be lots of sell sentiments this week.
