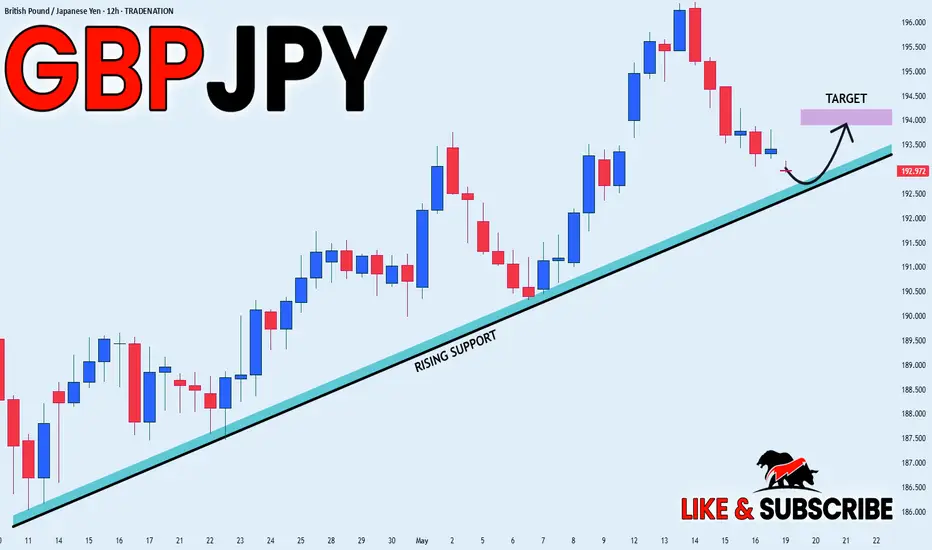
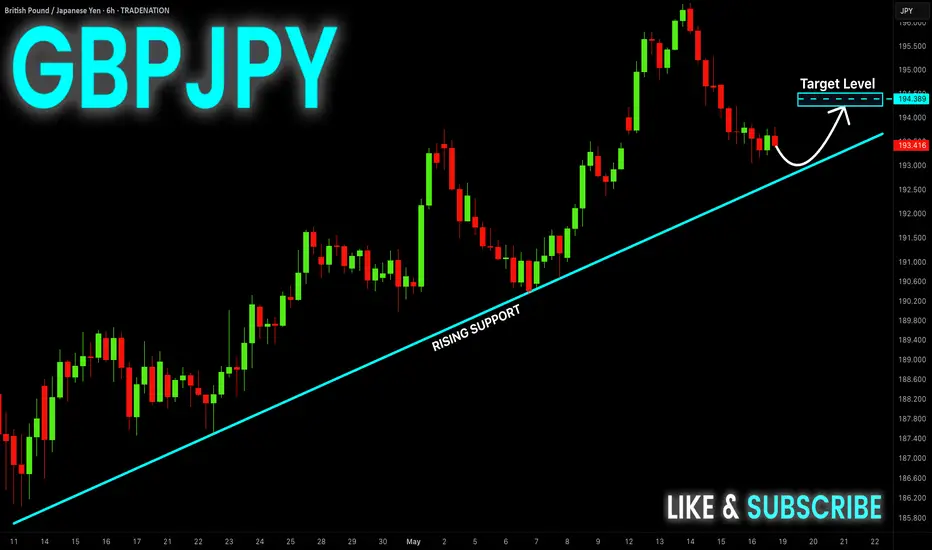
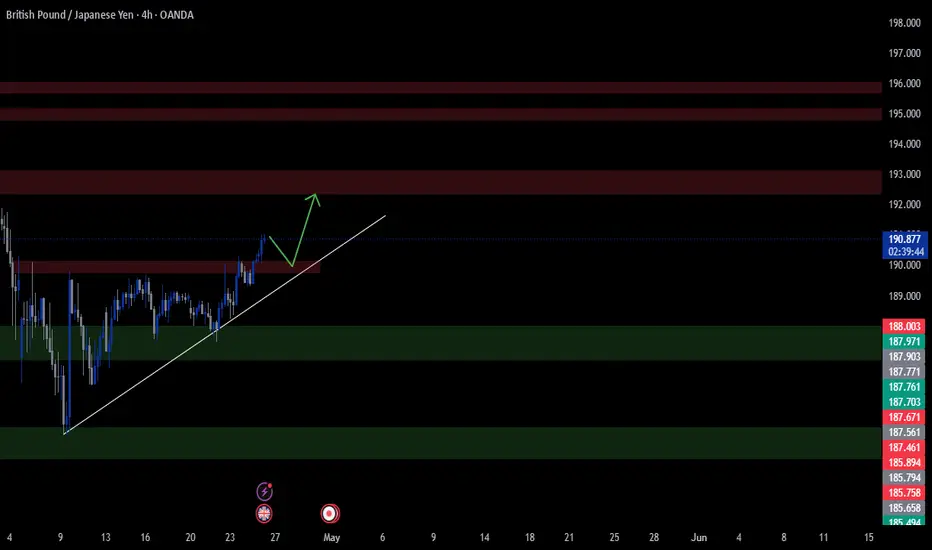
GBP_JPY GROWTH AHEAD|LONG|
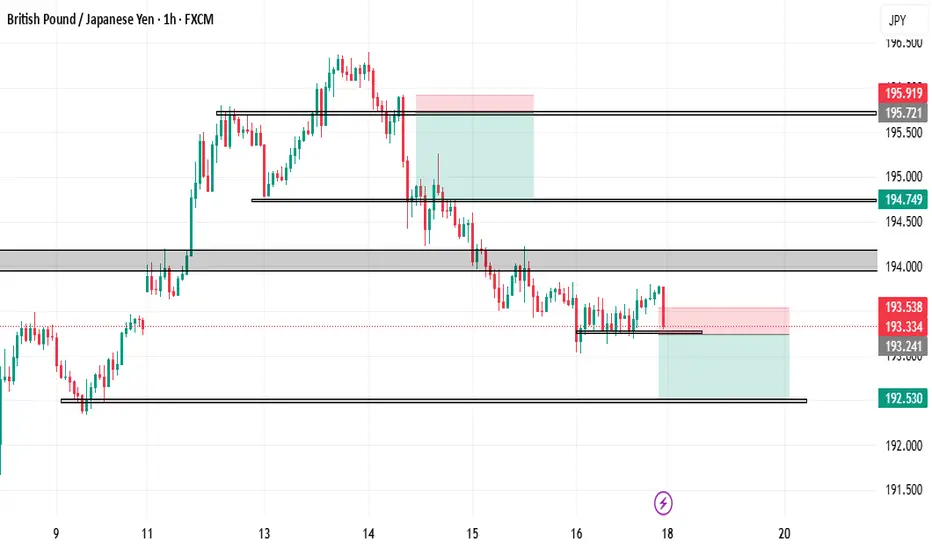
✅GBP_JPY is going down now
But a strong support level is ahead
Thus I am expecting a rebound
And a move up towards the target above 194.000
LONG🚀
✅Like and subscribe to never miss a new idea!✅
Disclosure: I am part of Trade Nation's Influencer program and receive a monthly fee for using their TradingView charts in my analysis.
GBPJPY trade ideas
GBPJPY is Holding above the SupportHello Traders
In This Chart GBPJPY HOURLY Forex Forecast By FOREX PLANET
today GBPJPY analysis 👆
🟢This Chart includes_ (GBPJPY market update)
🟢What is The Next Opportunity on GBPJPY Market
🟢how to Enter to the Valid Entry With Assurance Profit
This CHART is For Trader's that Want to Improve Their Technical Analysis Skills and Their Trading By Understanding How To Analyze The Market Using Multiple Timeframes and Understanding The Bigger Picture on the Charts
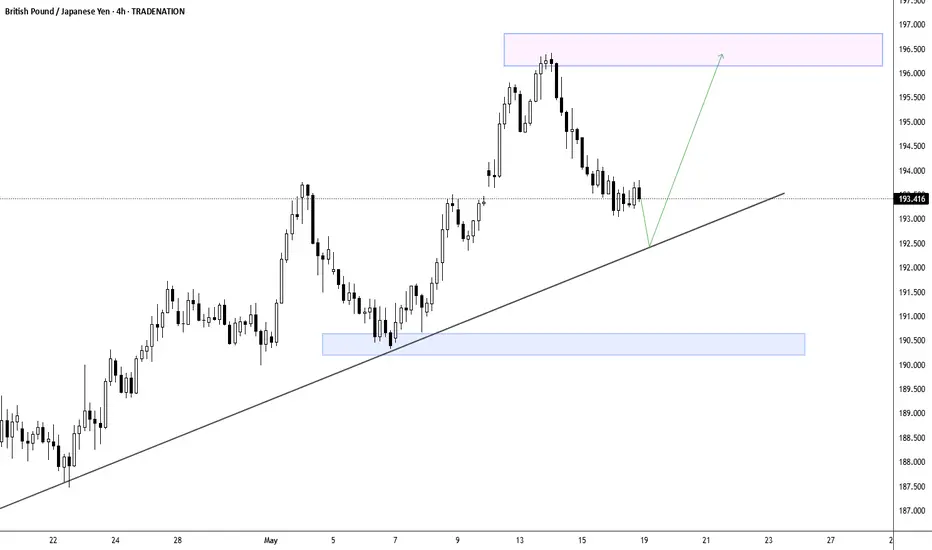
GBPJPY - Poised for Rebound at Major Trendline Support?The GBP/JPY pair is currently trading around the 193.41 level, showing consolidation after a notable correction from its recent peak of approximately 196.30. The clearly defined ascending trendline, which has supported price action since mid-April, remains the critical technical feature to monitor. As the price approaches this trendline support, traders should watch for potential bullish reactions that could propel the currency pair back toward the upper resistance zone marked by the pink rectangle near 196.50. The green arrow suggests a potential path forward with an expected bounce from the trendline followed by renewed upward momentum. However, any decisive break below this trendline would invalidate the bullish structure and possibly trigger a deeper correction toward the lower support zone around 190.50, highlighted by the light blue rectangle.
Disclosure: I am part of Trade Nation's Influencer program and receive a monthly fee for using their TradingView charts in my analysis.
GBPJPY SELLRanging market on weekly chart, weekly resistance respected
Bearish pressure seen on the daily chart with the last candle bearish, downtrend on H4. Price is currently consolidating on H1. Break of support on H1 and retest for entry.
Risk - 30 pips
Reward - 71 pips
...Mrwarm cares
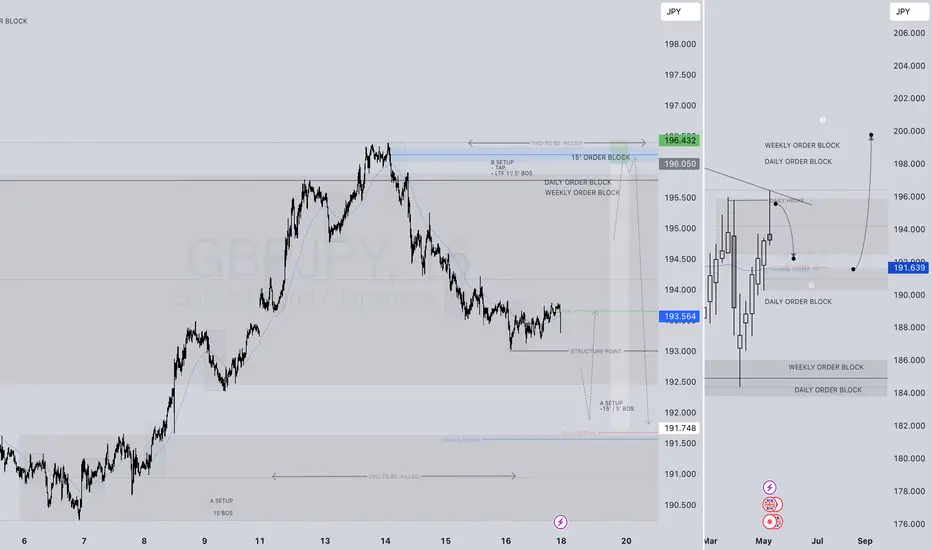
WHERE PRICE GOES...WE FOLLOW GBPJPY LONG FORECAST Q2 W21 Y25WHERE PRICE GOES...WE FOLLOW
GBPJPY LONG FORECAST Q2 W21 Y25
Professional Risk Managers👋
Welcome back to another FRGNT chart update📈
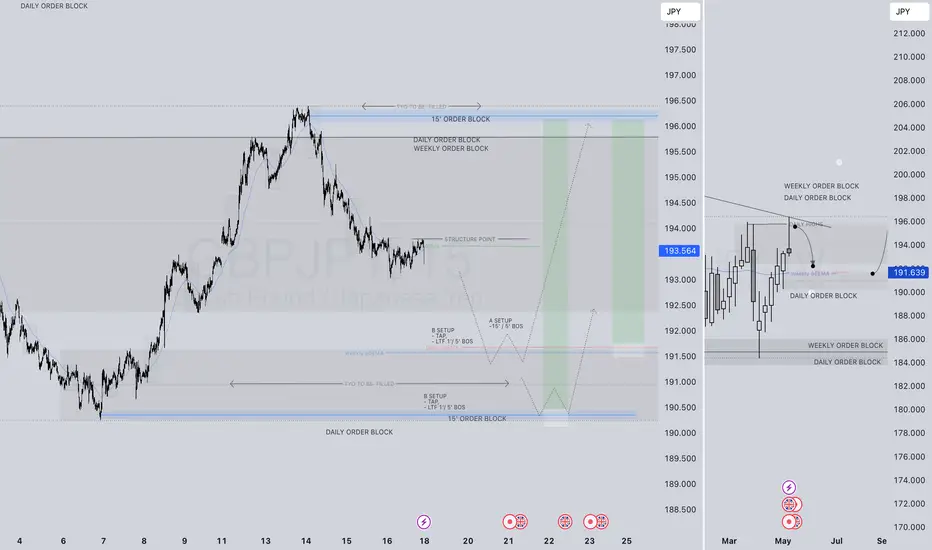
Diving into some Forex setups using predominantly higher time frame order blocks alongside confirmation breaks of structure.
Let’s see what price action is telling us today!
💡Here are some trade confluences📝
✅Weekly order block rejection
✅Daily order block rejection
✅Intraday 15' order blocks
✅Tokyo ranges to be filled
🔑 Remember, to participate in trading comes always with a degree of risk, therefore as professional risk managers it remains vital that we stick to our risk management plan as well as our trading strategies.
📈The rest, we leave to the balance of probabilities.
💡Fail to plan. Plan to fail.
🏆It has always been that simple.
❤️Good luck with your trading journey, I shall see you at the very top.
🎯Trade consistent, FRGNT X
GBP/JPY Buy OpportunityA potential buy signal is forming on GBP/JPY due to a break above a key supply zone. This breakout indicates strong bullish momentum, suggesting further upside potential.

GBP-JPY Long From Rising Support! Buy!Hello,Traders!
GBP-JPY is trading along
The rising support line
And the pair will soon hit
A trend-line from where we
Will be expecting a local
Bullish rebound and a
Further bullish move up
Buy!
Comment and subscribe to help us grow!
Check out other forecasts below too!
# GBPJPY DAILY SUPPLY# GBPJPY DAILY SUPPLY IN H4 Market will already mss in M15 , with valid mss conformation then enter o this trade and wait for some days / weeks / month ........................
GBP-JPY Long From Rising Support! Buy!
Hello,Traders!
GBP-JPY is trading along
The rising support line
And the pair will soon hit
A trend-line from where we
Will be expecting a local
Bullish rebound and a
Further bullish move up
Buy!
Comment and subscribe to help us grow!
Check out other forecasts below too!
Disclosure: I am part of Trade Nation's Influencer program and receive a monthly fee for using their TradingView charts in my analysis.
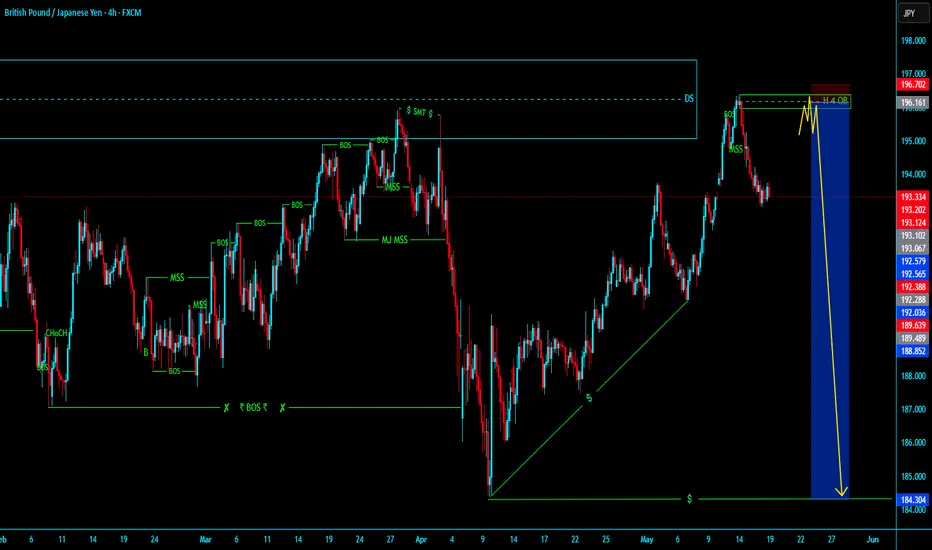
IT DEPENDS WHAT HAPPENS 1ST! GBPJPY SHORT FORECAST Q2 W21 Y25IT DEPENDS WHAT HAPPENS 1ST! GBPJPY SHORT FORECAST Q2 W21 Y25
Professional Risk Managers👋
Welcome back to another FRGNT chart update📈
Diving into some Forex setups using predominantly higher time frame order blocks alongside confirmation breaks of structure.
Let’s see what price action is telling us today!
💡Here are some trade confluences📝
✅Weekly order block rejection
✅Daily order block rejection
✅Intraday 15' order blocks
✅Tokyo ranges to be filled
🔑 Remember, to participate in trading comes always with a degree of risk, therefore as professional risk managers it remains vital that we stick to our risk management plan as well as our trading strategies.
📈The rest, we leave to the balance of probabilities.
💡Fail to plan. Plan to fail.
🏆It has always been that simple.
❤️Good luck with your trading journey, I shall see you at the very top.
🎯Trade consistent, FRGNT X
Buy GJBuy according to price action sign of reversal after pullback to 23fib within strong uptrend
Look at the chart for levels.
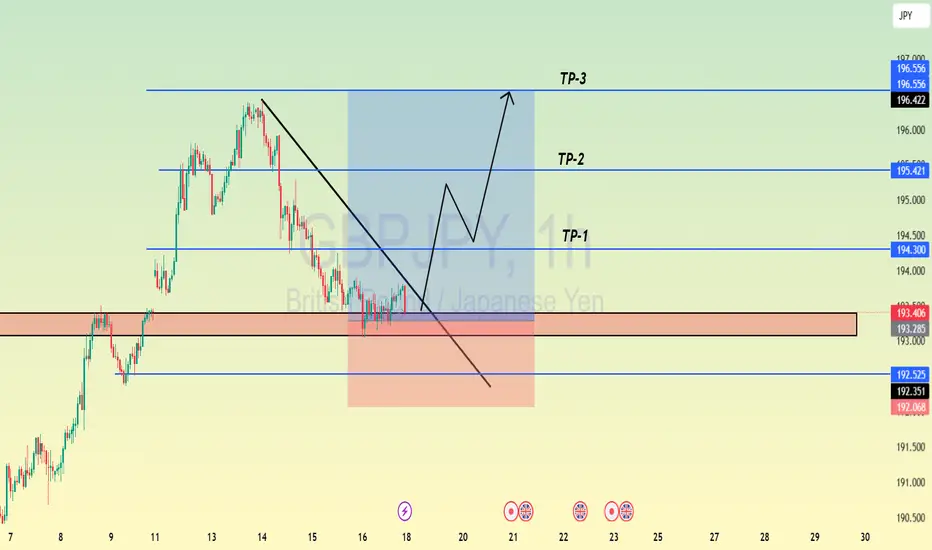
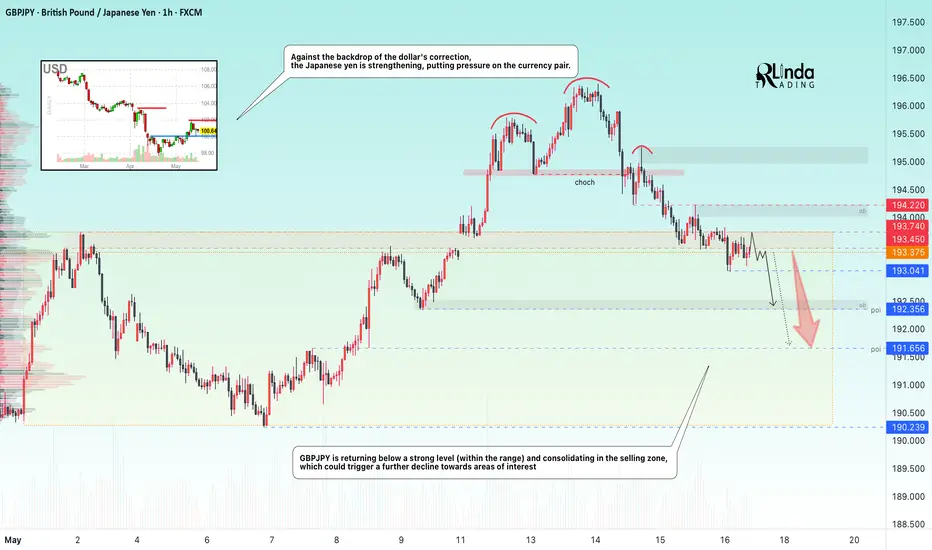
GBPJPY → Return to range. Possible price decline.FX:GBPJPY is forming a local bearish trend amid a correction in the dollar. The price is returning to the range and entering strong resistance.
Amid a correction in the dollar, the Japanese yen is strengthening, putting pressure on the currency pair.
GBPJPY is returning below a strong level (within the range) and consolidating in the selling zone, which could trigger a continuation of the decline towards areas of interest. Technically, the global trend is neutral and the currency pair is forming a rebound from strong downward resistance. If the bears keep the price below 193.45 - 193.74, the local downward trend may continue.
Resistance levels: 193.45, 193.74, 194.22
Support levels: 193.04, 192.35, 191.65
Price consolidation below 193.74 - 193.45 will confirm that bears are holding the range resistance. The sell-off may continue, and in this case, the price will head towards the indicated zones of interest and liquidity.
Best regards, R. Linda!
Trade Recap CW20Quick Recap of my two positions from last week and also covering a potential higher risk trade on EURUSD.

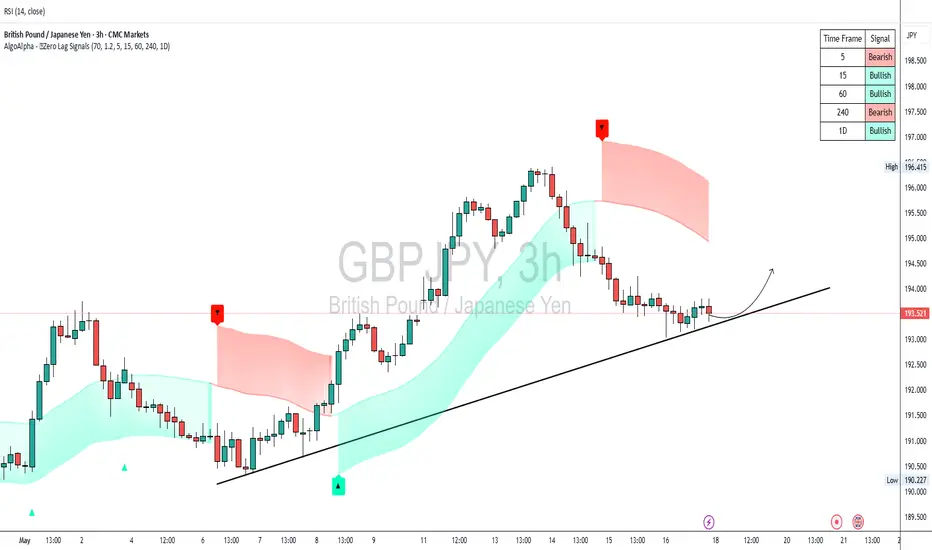
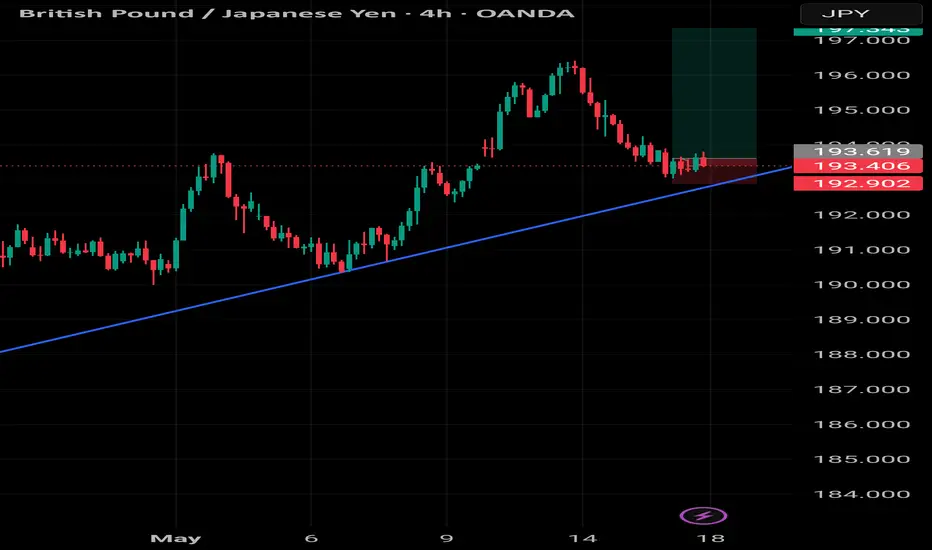
GBPJPY: Break, Retest, Boom ?Eyes on GBPJPY, Bulls Loading Up?
Price is respecting a clear ascending trendline on the 4H timeframe. After breaking through a minor Resistance Level, it looks set to pull back for a retest before continuing higher. The next target lies in the higher supply zone around the 192.500 193.000 area. As long as the trendline holds, the bullish bias remains intact.
⚠️ Not a financial advice
#GBPJPY #Forex #PriceAction #SmartMoney #TrendlineTrading #SupplyAndDemand #TechnicalAnalysis #BullishSetup #SwingTrading #MarketStructure
GBPJPYWeekly, it's on a consolidation.
The price must first touch the Key Level of 180, before anything else.

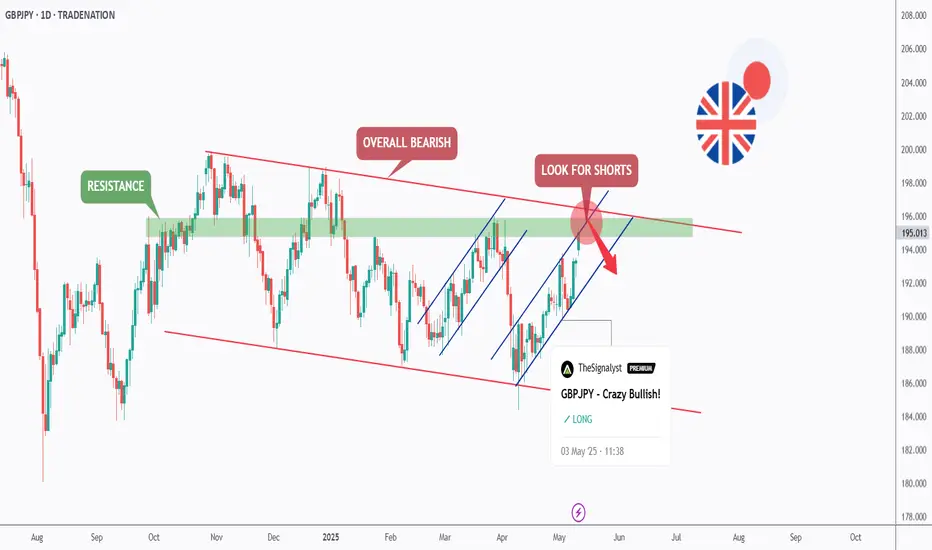
GBPJPY - Bullish No More!Hello TradingView Family / Fellow Traders. This is Richard, also known as theSignalyst.
📈As per our last GBPJPY analysis (attached on the chart), it rejected the lower bound of the rising blue channel.
What's next?
GBPJPY is currently approaching the upper bound of its falling trend marked in red.
Moreover, the green zone is a strong structure and resistance.
🏹 Thus, the highlighted red circle is a strong area to look for sell setups as it is the intersection of structure and upper red trendline acting as a non-horizontal resistance.
📚 As per my trading style:
As #GBPJPY approaches the red circle zone, I will be looking for bearish reversal setups (like a double top pattern, trendline break , and so on...)
📚 Always follow your trading plan regarding entry, risk management, and trade management.
Good luck!
All Strategies Are Good; If Managed Properly!
~Rich
Disclosure: I am part of Trade Nation's Influencer program and receive a monthly fee for using their TradingView charts in my analysis.