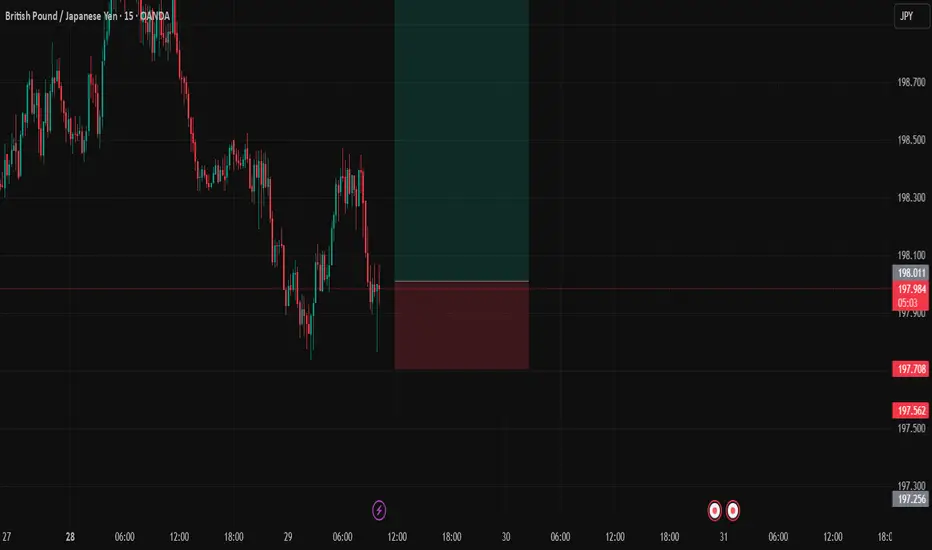
sell GBPJPYprice rejected the supply with pressure, i think the supply is increasing and buyers have lost momentum.
GBPJPY trade ideas

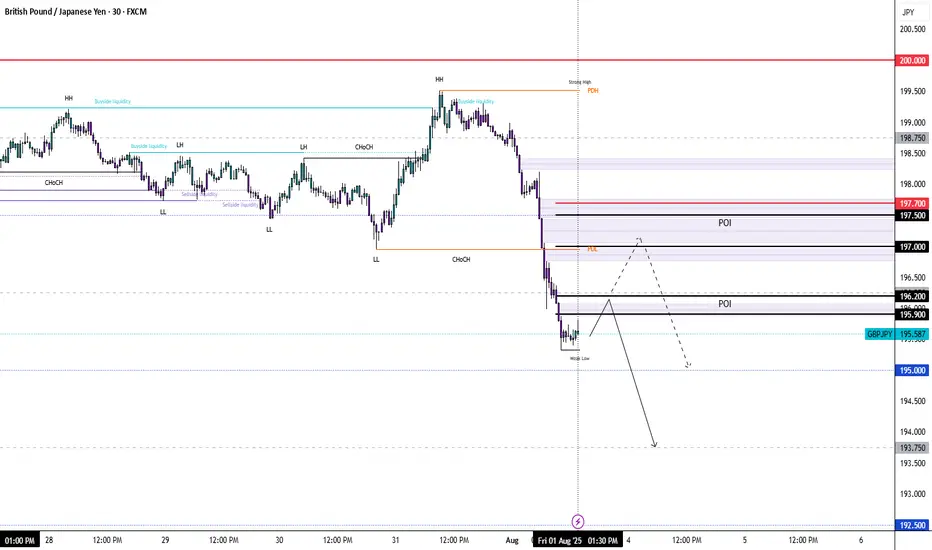
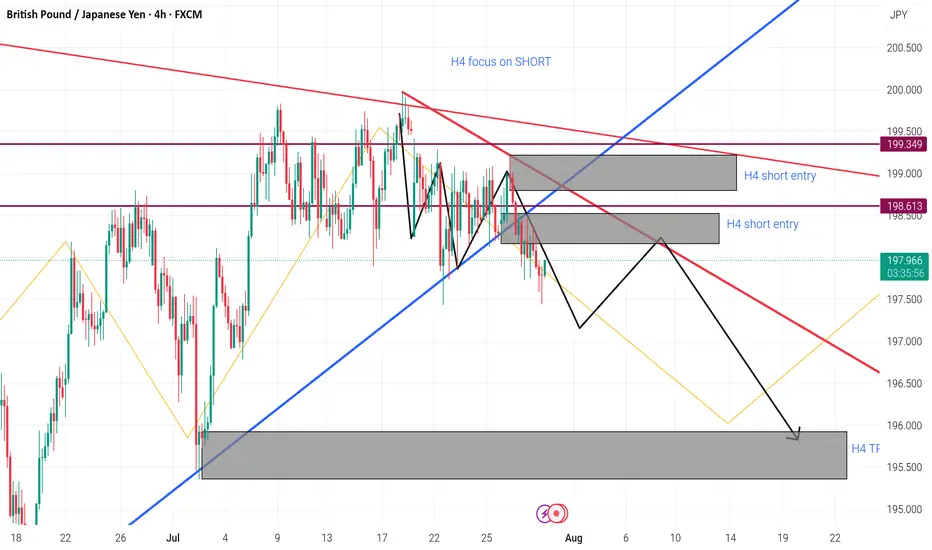
GBPJPY: Bearish Market StructureLook to sell after the correction...
(H4)
✅ Confirmed BOS below 197.20
✅ LHs
✅ Supply Zone: 196.10 – 196.60
(H1)
✅ Nice impulse down from 197.30 to 195.50
✅ Short-Term Supply Zone: 195.90 – 196.20 (H1 OB inside H4)
Looking for price to tap this zone and form a new LH
(M15)
✅ Price consolidating after the drop
✅ No bullish BOS
✅ New LH
Expecting liquidity sweep above 195.90, then bearish BOS below 195.70 to confirm entry
❌ Invalidation: Bullish BOS above 196.70 on M15.
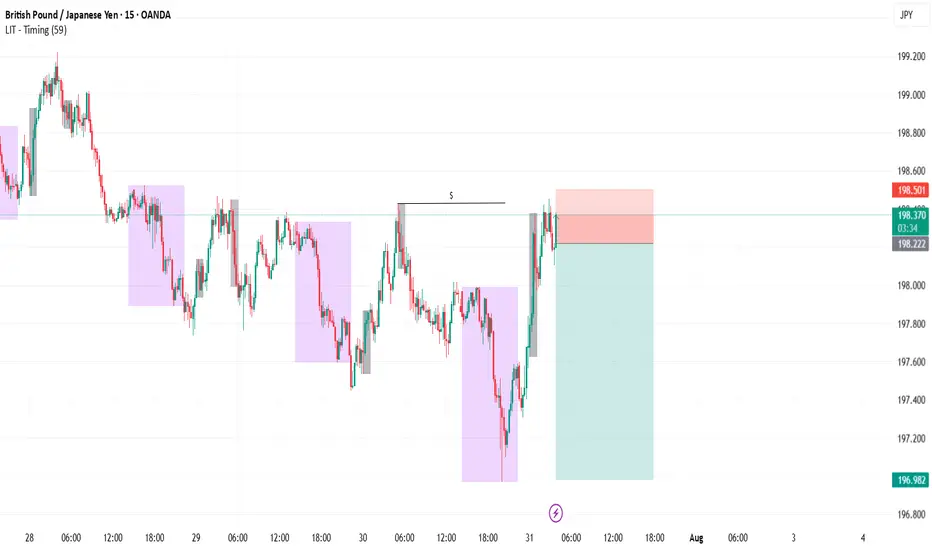
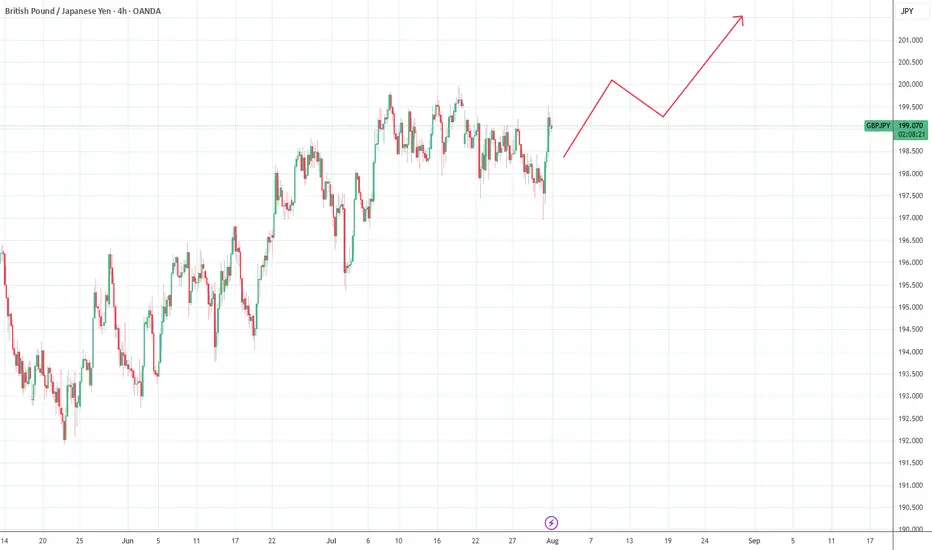
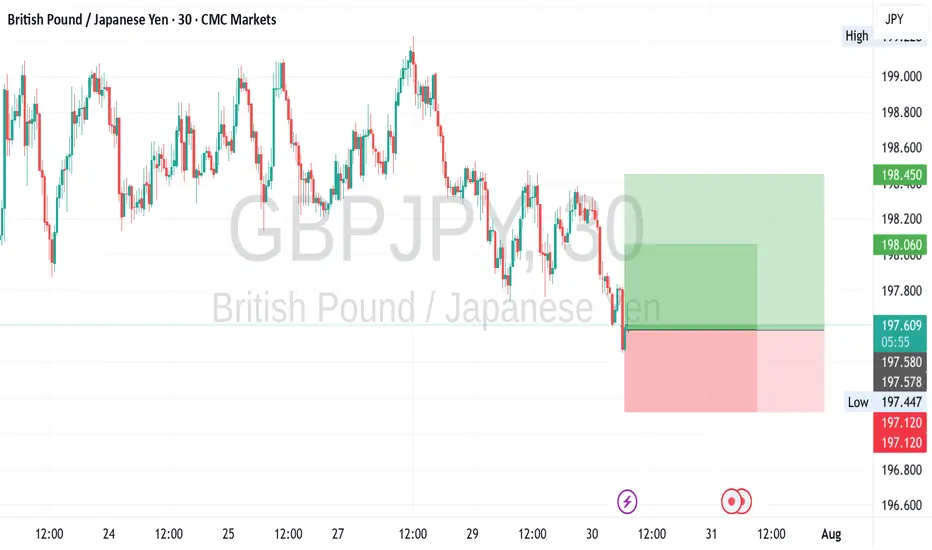
GBpJpY RETRACEMENT This is a possible retracement
Use a reasonable lot size
Risk only what you can afford
I wish you success

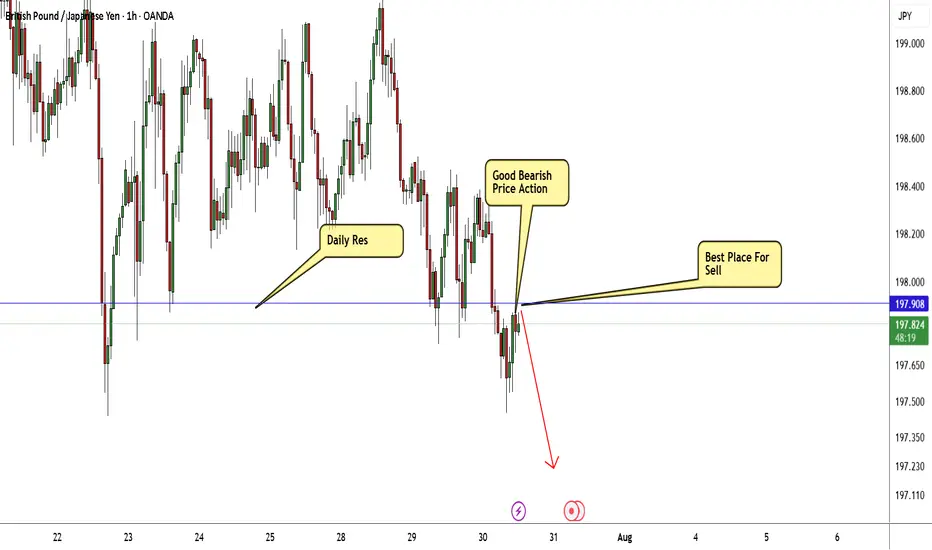
GBP/JPY Breakout Done , Short Setup Valid To Get 150 Pips !Here is my 1H Chart on GBP/JPY , We Have A Daily closure below my old support and new res and we have a very good bearish Price Action on 1And 2 Hours T.F , So i see it`s a good chance to sell this pair and targeting 100 to 150 pips . and if we have a daily closure again above my new res then this idea will not be valid anymore .
GBPJPY SellExternal structure is now bearish and the internal structure did a liquidity grab. Price should continue lower and go towards asia low to complete daily cycle.
GBP-JPY Risky Long! Buy!
Hello,Traders!
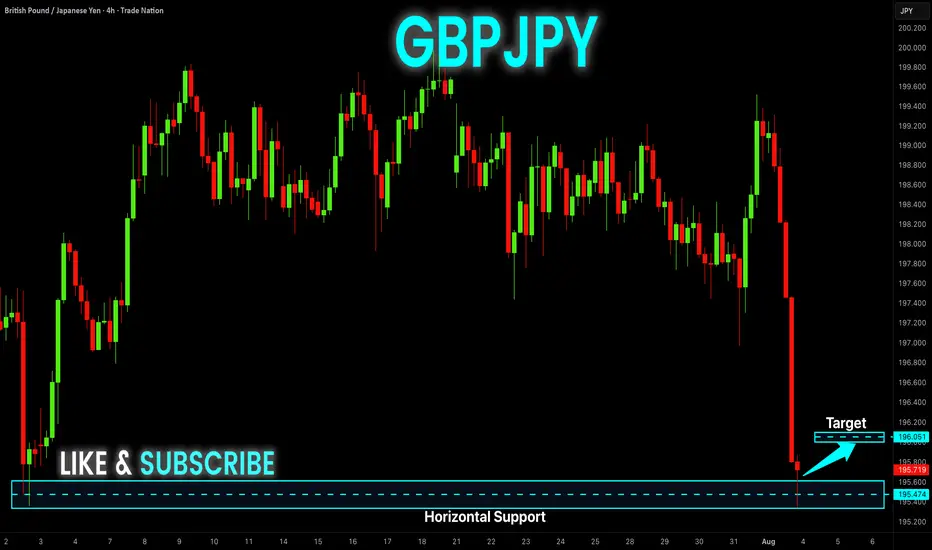
GBP-JPY collapsed on Friday
And the pair's final move
Was absorbed by the horizontal
Support of 195.400 so as the
Pair is oversold we will be
Expecting a local rebound
And a correction on Monday
Buy!
Comment and subscribe to help us grow!
Check out other forecasts below too!
Disclosure: I am part of Trade Nation's Influencer program and receive a monthly fee for using their TradingView charts in my analysis.
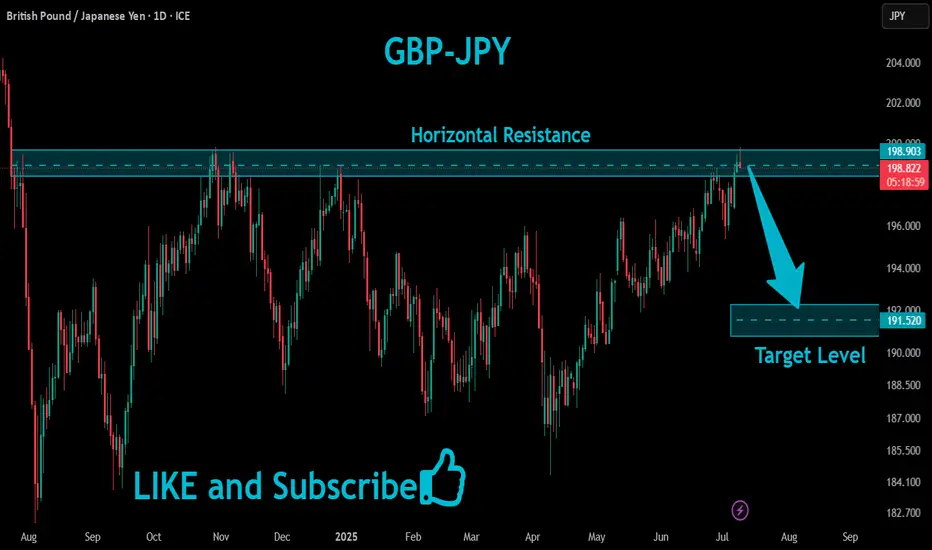
GBPJPY Will Fall!
HI,Traders !
#GBPJPY has retested a
Horizontal resistance level
Of 198.903 so we are
Locally bearish biased
And from the resistance we
We will be expecting a
Local bearish correction !
Comment and subscribe to help us grow !
GBP/JPY Clears July LowGBP/JPY clears the July low (195.37) as it tumbles to a fresh weekly low (195.34), and a close below the 195.70 (61.8% Fibonacci extension) to 196.60 (23.6% Fibonacci extension) region may push the exchange rate toward the June low (192.73).
Failure to hold above the 192.40 (50% Fibonacci extension) to 193.50 (38.2% Fibonacci extension) zone may lead to a test of the May low (190.33), but the selloff in GBP/JPY may turn out to be temporary if it defends the rebound from the June low (192.73).
GBP/JPY may attempt to retrace the decline from the July high (199.98) should it hold/close above the 195.70 (61.8% Fibonacci extension) to 196.60 (23.6% Fibonacci extension) region, with a close above the 199.80 (61.8% Fibonacci retracement) to 200.50 (78.6% Fibonacci extension) region opening up 201.20 (23.6% Fibonacci retracement).
--- Written by David Song, Senior Strategist at FOREX.com

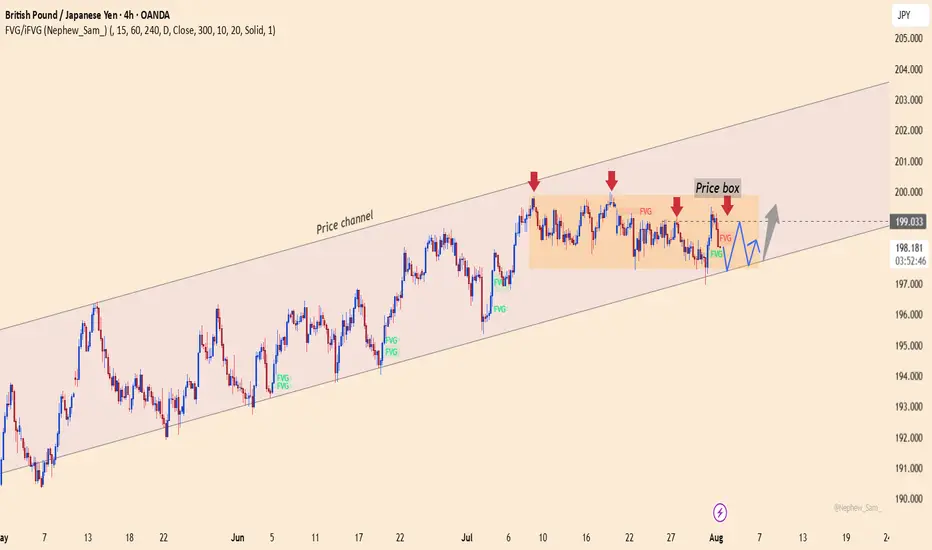
GBPJPY holds momentum, waiting for the final pushThe GBPJPY pair is moving sideways between 197.400 and 199.000, while maintaining its position inside the ascending price channel. Each pullback is quickly absorbed near the lower support, indicating that buying pressure is quietly building.
💡 Bullish factors supporting the trend:
– UK Services PMI beats expectations, strengthening economic outlook.
– BOJ maintains negative interest rates, weakening the JPY.
– Risk-on sentiment drives capital back into the GBP.
🎯 Suggested strategy:
Buy near 197.400 or on a breakout above 199.000.
Target: 201.500 | Stop-loss: below 196.800.
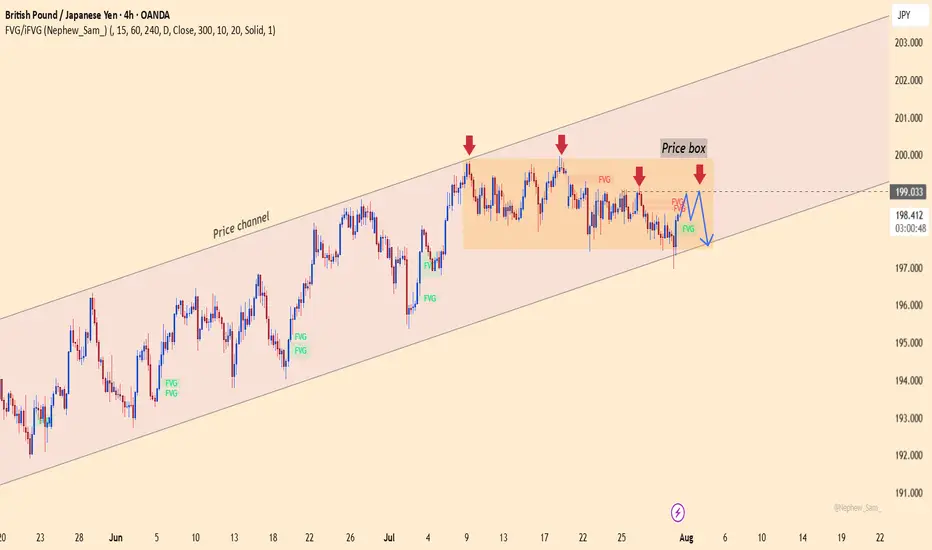
GBPJPY – Losing control zone, downtrend taking shapeGBPJPY is still trading within a long-term ascending price channel. However, what’s concerning is that recent price action has broken out of the previously established price box – which had acted as a stabilizing structure for the uptrend. Buyers failed to maintain momentum, repeatedly getting rejected at the top of the box.
Currently, GBPJPY is showing signs of breaking below the short-term support inside the price box, raising the risk of a deeper correction toward the lower boundary of the channel. A “lower high” structure is clearly forming, confirming that selling pressure is taking over.
From a news perspective, the Japanese yen is gaining strength as risk-off sentiment increases, while the pound is losing ground due to cautious tones from the Bank of England following a string of weak economic data. This shift is weakening GBP's appeal and could accelerate the bearish trend.
Strategy:
Wait to SELL if price pulls back to the former resistance zone within the price box and shows rejection signals. The downtrend will be confirmed if the recent low is broken. Stay out if there’s no clear confirmation.
What do you think will happen next with GBPJPY?
GBPJPYDate:
July 31,2025
Session:
New York Session
Pair:
GBPJPY
Bias:
Long
Liquidity from Monday's London session was swept in today's (Thursday) New York and London Session. Now I see price following the trend downward.
Entry: 199.080
Stop Loss: 199.387
Target: 198.207
RR: 2.90

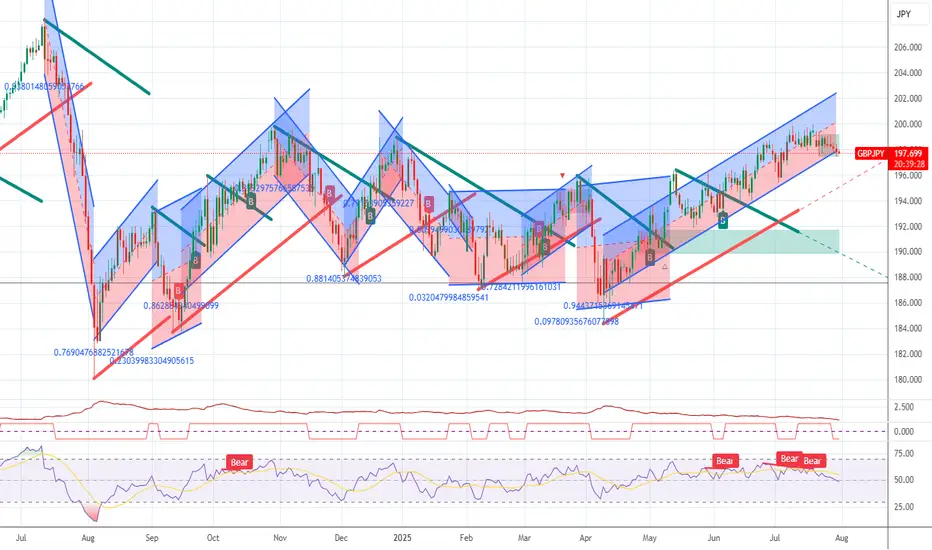
The recent uptrend has been decisively broken, with price actionThe currency pair showed sustained bullish momentum over the past weeks, forming higher highs and higher lows. However, recent price action broke below the ascending trendline and failed to retest previous highs, indicating waning bullish strength. The break of support suggests the uptrend has been invalidated, with increasing risk of a bearish reversal or short-term correction.
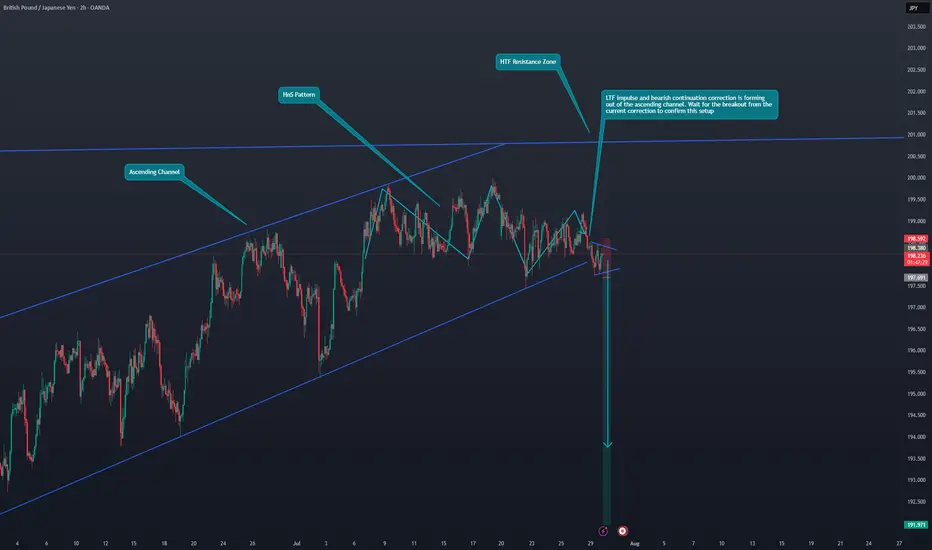
GBP/JPY Bearish OutlookHi Traders.
LTF impulse and bearish continuation correction is forming
out of the ascending channel. Wait for the breakout from the
current correction to confirm this setup
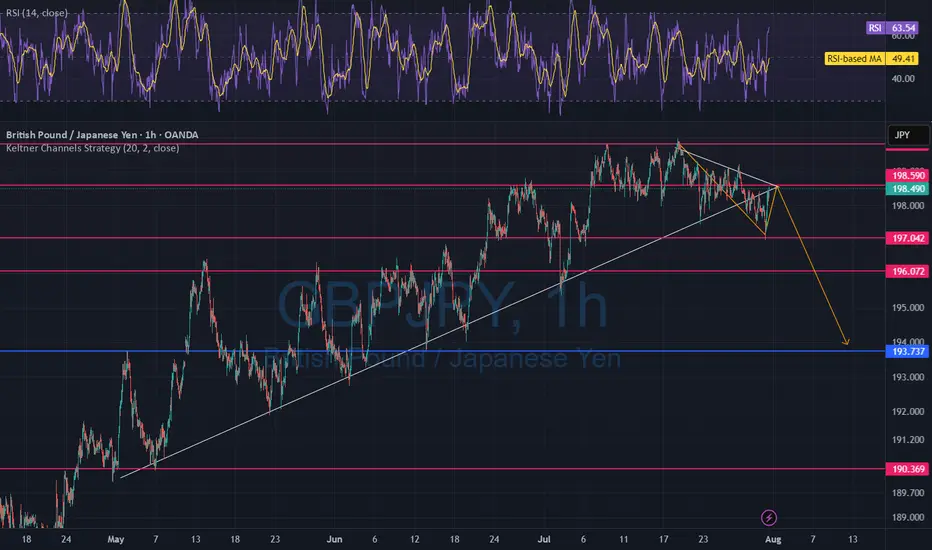
GBPJPY ShortGBPJPY is short on the regression break.
I am not taking this trade, as it has terrible roll short and the other GBP and JPY crosses are not following.
GBPJPY What Next? SELL!
My dear friends,
Please, find my technical outlook for GBPJPY below:
The price is coiling around a solid key level - 199.08
Bias - Bearish
Technical Indicators: Pivot Points Low anticipates a potential price reversal.
Super trend shows a clear sell, giving a perfect indicators' convergence.
Goal - 198.77
Safe Stop Loss - 199.23
About Used Indicators:
The pivot point itself is simply the average of the high, low and closing prices from the previous trading day.
Disclosure: I am part of Trade Nation's Influencer program and receive a monthly fee for using their TradingView charts in my analysis.
———————————
WISH YOU ALL LUCK
GJ BULLISH SET UPPlace a long on this one, price seems to be at strong support and TL has help price in previous touches.

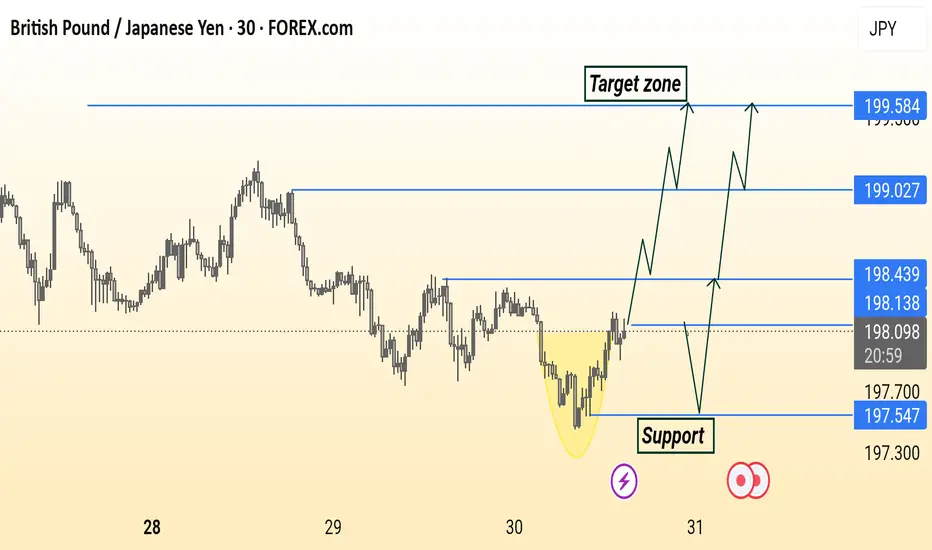
GBP/JPY Analysis is Ready Read The Captions GBP/JPY 30-minute chart shows a potential bullish reversal from a rounded bottom pattern. Price is approaching support around 198.13–197.54, with multiple possible bullish scenarios targeting resistance levels at 198.43, 199.03, and 199.58. The highlighted “Target zone” suggests a continuation if price breaks and holds above key resistance.
GJ Analysis on H4 30.7.25-TL on h4
- candle broke the uptrend TL and making HL LL hence the setup change to Short setup.
- There are 2 areas of short entry with its sL and both has the same area of TP.
We will see if this setup play out as planned.
#selfjournal
#practicetobefulltimetrader
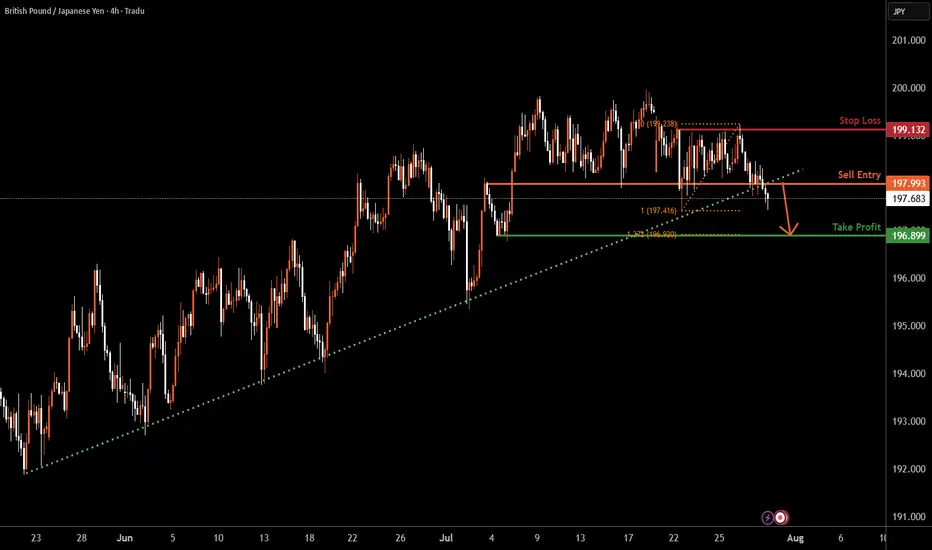
GBPJPY H4 | Bearish dropGBP/JPY has broken below the support level, which is an overlap support. A potential pullback to the sell entry, followed by a reversal, could lead to a further price drop.
Sell entry is at 197.99, which is an overlap resistance.
Stop loss is at 199.13, which is a pullback resistance.
Take profit is at 196.89, which is a swing low support that lines up with the 127.2% Fibonacci extension.
High Risk Investment Warning
Trading Forex/CFDs on margin carries a high level of risk and may not be suitable for all investors. Leverage can work against you.
Stratos Markets Limited (tradu.com ):
CFDs are complex instruments and come with a high risk of losing money rapidly due to leverage. 65% of retail investor accounts lose money when trading CFDs with this provider. You should consider whether you understand how CFDs work and whether you can afford to take the high risk of losing your money.
Stratos Europe Ltd (tradu.com ):
CFDs are complex instruments and come with a high risk of losing money rapidly due to leverage. 66% of retail investor accounts lose money when trading CFDs with this provider. You should consider whether you understand how CFDs work and whether you can afford to take the high risk of losing your money.
Stratos Global LLC (tradu.com ):
Losses can exceed deposits.
Please be advised that the information presented on TradingView is provided to Tradu (‘Company’, ‘we’) by a third-party provider (‘TFA Global Pte Ltd’). Please be reminded that you are solely responsible for the trading decisions on your account. There is a very high degree of risk involved in trading. Any information and/or content is intended entirely for research, educational and informational purposes only and does not constitute investment or consultation advice or investment strategy. The information is not tailored to the investment needs of any specific person and therefore does not involve a consideration of any of the investment objectives, financial situation or needs of any viewer that may receive it. Kindly also note that past performance is not a reliable indicator of future results. Actual results may differ materially from those anticipated in forward-looking or past performance statements. We assume no liability as to the accuracy or completeness of any of the information and/or content provided herein and the Company cannot be held responsible for any omission, mistake nor for any loss or damage including without limitation to any loss of profit which may arise from reliance on any information supplied by TFA Global Pte Ltd.
The speaker(s) is neither an employee, agent nor representative of Tradu and is therefore acting independently. The opinions given are their own, constitute general market commentary, and do not constitute the opinion or advice of Tradu or any form of personal or investment advice. Tradu neither endorses nor guarantees offerings of third-party speakers, nor is Tradu responsible for the content, veracity or opinions of third-party speakers, presenters or participants.
GBPJPY recent global risk appetite significantly increasedThrough the dynamic monitoring of market sentiment and capital flows found that the recent global risk appetite significantly increased, the structure of funds tilted to risky assets, the currency benefited from this trend to show upward momentum.
Public opinion analysis shows that the market is generally concerned about the positive impact of economic recovery and policy support, and media reports and analysts' views tend to be optimistic, which strengthens the bullish market atmosphere.
Money flow data supports the active inflow of funds into the currency, showing a combination of institutional and retail buying, pushing the price to stabilize and rebound.
It is recommended that investors combine the dynamic, reasonably adjust the position, low absorption, and actively participate in the market rebound.
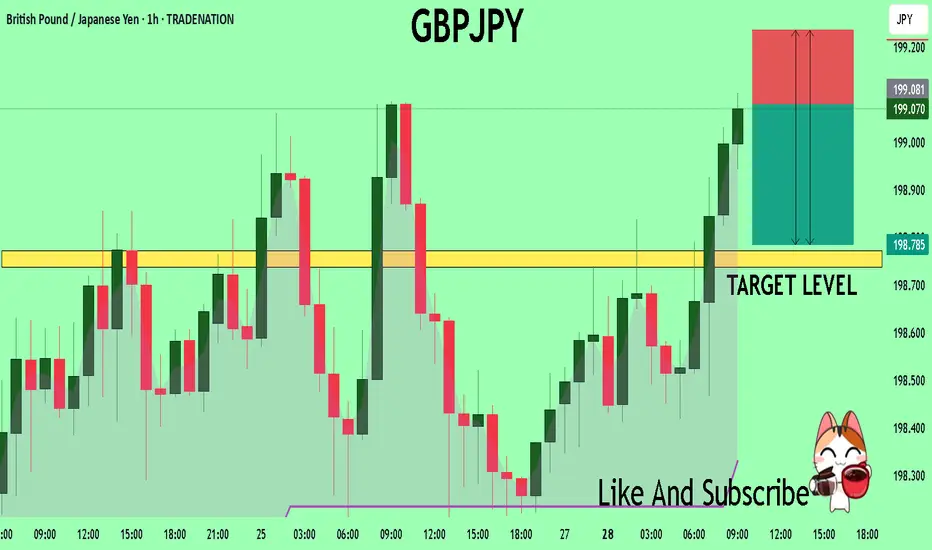
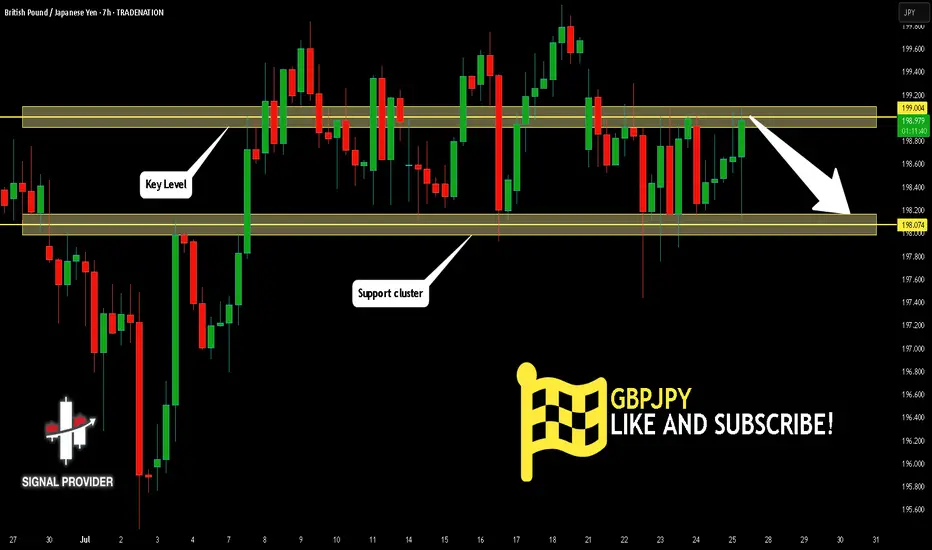
GBPJPY Is Very Bearish! Sell!
Please, check our technical outlook for GBPJPY.
Time Frame: 7h
Current Trend: Bearish
Sentiment: Overbought (based on 7-period RSI)
Forecast: Bearish
The market is trading around a solid horizontal structure 199.004.
The above observations make me that the market will inevitably achieve 198.074 level.
P.S
Please, note that an oversold/overbought condition can last for a long time, and therefore being oversold/overbought doesn't mean a price rally will come soon, or at all.
Disclosure: I am part of Trade Nation's Influencer program and receive a monthly fee for using their TradingView charts in my analysis.
Like and subscribe and comment my ideas if you enjoy them!
GBPJPYDate:
July 29,2025
Session:
London and New York Session
Pair:
GBPJPY
Bias:
Long
Yesterdays liquid untouched still lies. Expecting price to fill that area either by end of NY session or Asia.
Entry: 198.018
Stop Loss: 197.704
Target: 199.068
RR: 3.5