GBPJPY trade ideas

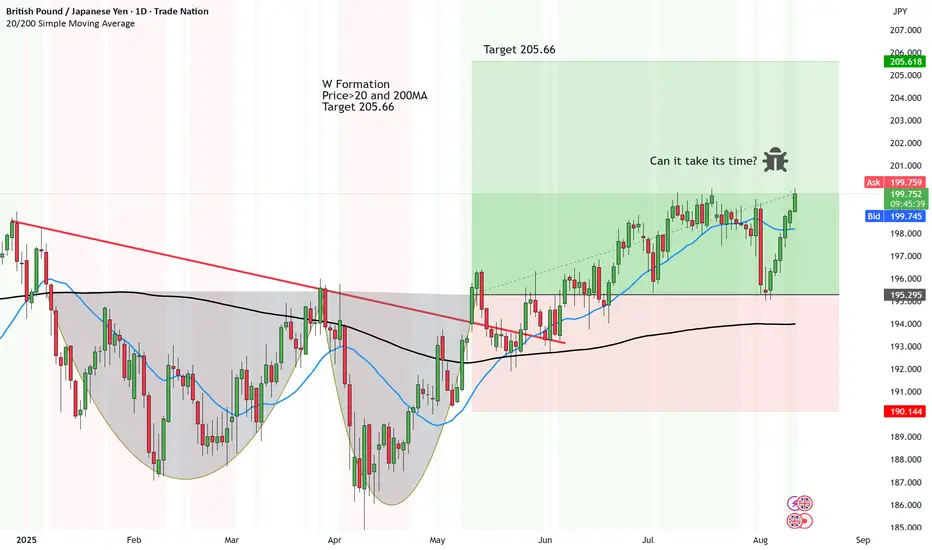
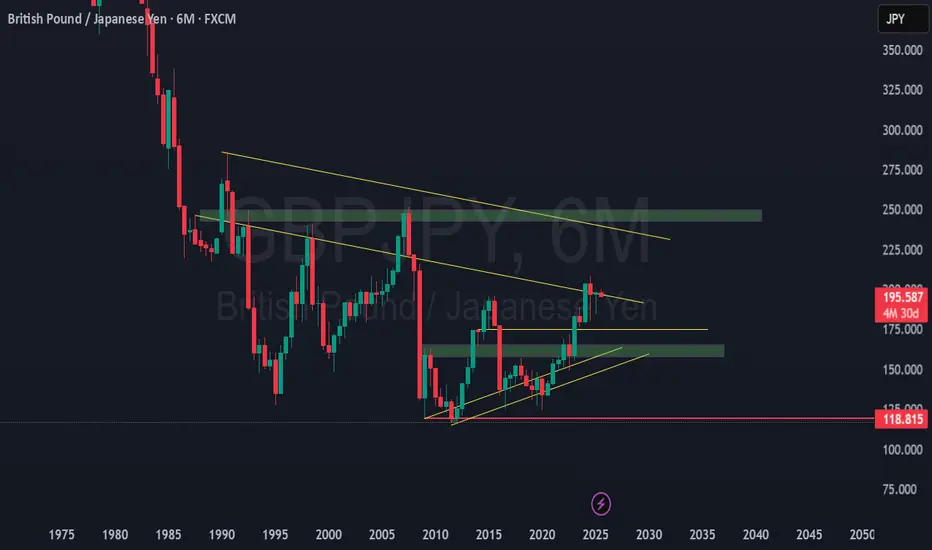
UPDATE: GBP/JPY heading to target but like a Dungbeetle!Another analysis done in May with a W Formation.
It broke above then below then tested the resistance (neckline) three times.
Before it turned back up.
So now we are getting good traction for upside (if the interest daily charges haven't eaten enough of the portfolio.
And now we will just wait for the price to head to the first target of 205.66
W Formation
Price>20 and 200MA
Target 205.66
Disclosure: I am part of Trade Nation's Influencer program and receive a monthly fee for using their TradingView charts in my analysis.
Breaker Block - Trend ContinuationGBPJPY is currently Bullish.. The current structure signal an Upward movement.. The presence of an inducement after the BOS validates our Breaker Block for Buy continuation

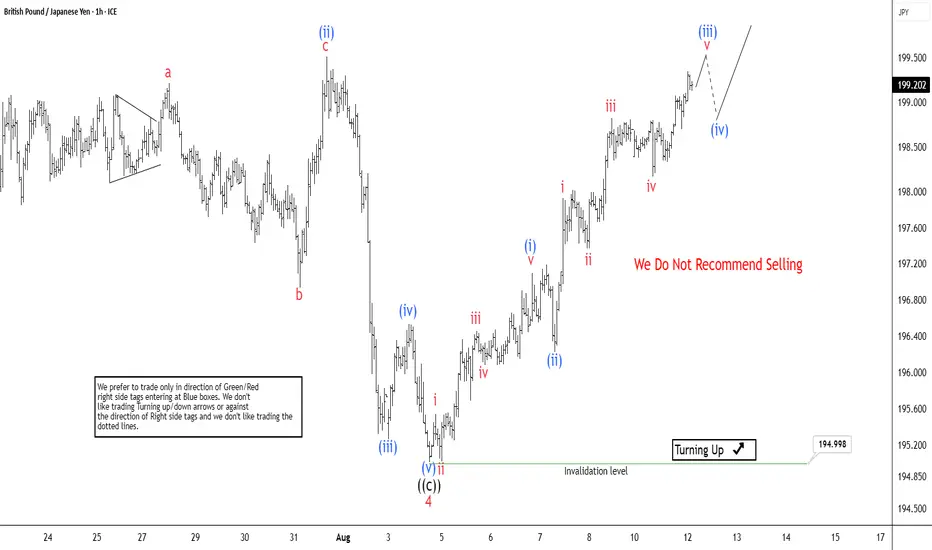
Elliott Wave Outlook: GBPJPY Set to Rally to Target 201.2The bullish cycle initiated from the April 2025 low continues to unfold as a five-wave impulse pattern. As depicted in the one-hour chart, wave 4 concluded at 195.02. The pair has since reversed upward and is poised to breach the previous wave 3 peak at 199.97, reinforcing the bullish outlook. A confirmed breakout above this level would signal the continuation of the upward trajectory. The minimum target for this move is the 123.6% inverse Fibonacci retracement of wave 4, projecting a level of 201.2.
Currently, wave 5 is developing as a smaller-degree five-wave impulse. From the wave 4 low, wave (i) peaked at 197.1, followed by a shallow pullback in wave (ii) to 196.22. The pair has resumed its ascent and is nearing the completion of wave (iii). A corrective pullback in wave (iv) is anticipated, followed by another upward leg to complete wave (v) of ((i)). Subsequently, a wave ((ii)) correction should occur, retracing part of the cycle from the August 5, 2025 low. After this correction, the pair is expected to resume its climb, forming waves ((iii)), ((iv)), and ((v)) to finalize wave 5 and the broader cycle from April 2025. As long as the 195.02 pivot holds, further upside remains likely.

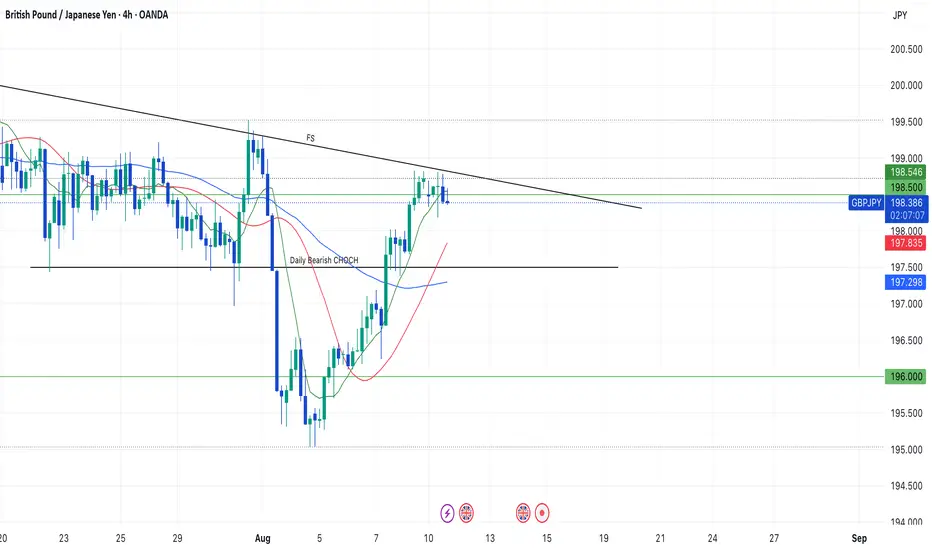
My Confluences to give a SetupHi Traders!
With GJ tapping 198.500 so many times, and eating up Monday July 28th Weekly Bearish candle on Monday the 4th, and testing a weekly CHOCH with rejection- I'm just waiting for a break set up. But, I'd like to see a few confluences first to have more confidence in a long. If price can retrace in between 198.000/197.000 on a higher TF (because it's had 4 Daily runs in a row) and create a new HL, that may confirm to me that the Daily bearish CHOCH would be invalid. Or for price to stay above 198.500 with bounces off that area showing momentum to break the failed swing. IMO, these confluences could give me the best set up possible. Patience is required to see if this set up will work.
*DISCLAIMER: I am not a financial advisor. The ideas and trades I take on my page are for educational and entertainment purposes only. I'm just showing you guys how I trade. Remember, trading of any kind involves risk. Your investments are solely your responsibility and not mine.*
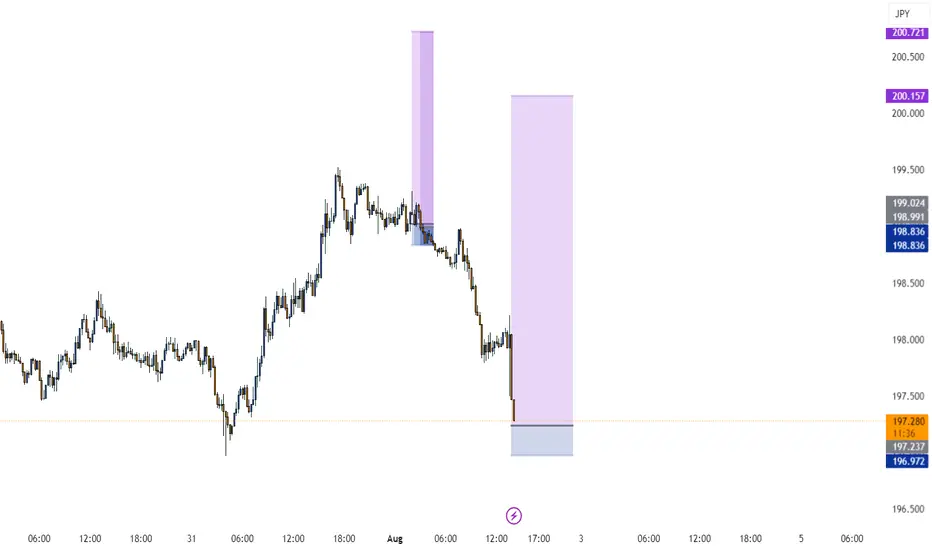
GJ: Courtyard Sweep Into Bullish ContinuationBias: Bullish
Pair: GBPJPY
Higher Timeframe Context (4H & 2H)
• Significant 4H high at 196.846 was broken, confirming bullish intent and momentum.
• Price had been ranging between 196.784 – 199.975 before breaking sell-side liquidity at 196.797.
• This liquidity sweep led to mitigation of a refined 30M order block between 195.405 – 195.349, sparking strong bullish momentum.
• Note: Unmitigated 4H order block exists between 194.816 – 194.022, but current focus is on capturing the bullish continuation in play.
Lower Timeframe Context (30M & 5M)
• After the 30M order block mitigation, price breached and broke the major lower high, shifting bias fully bullish.
• Now in execution mode, awaiting price to reach refined order block at 197.631 – 197.391.
• A courtyard liquidity sweep at 197.682 will act as the trigger for entry.
Execution Plan
• Enter after liquidity sweep at 197.682 and mitigation of the refined OB at 197.631 – 197.391.
• First TP: 198.842 (5M highs).
• Second TP: 199.979 (30M structural highs).
• Hold toward TP2 depending on price delivery and momentum.
Key Levels
• Broken High: 196.846
• Range: 196.784 – 199.975
• Sell-Side Liquidity: 196.797
• 30M Refined OB: 195.405 – 195.349
• Entry OB: 197.631 – 197.391
• Courtyard Liquidity: 197.682
• TP1: 198.842
• TP2: 199.979
Summary:
GBPJPY shifted from analysis to execution mode after breaking a major lower high and mitigating a refined 30M order block. Price is now approaching a key courtyard liquidity level, which, once swept, sets up a clean long entry toward TP1 and TP2. With bullish structure across the board, the plan is to ride momentum into the highs while managing execution on the lower timeframes.

gbpjpy
GBPJPY is a popular and widely traded currency pair in the Forex market. It represents the exchange rate between the British Pound Sterling (GBP) and the Japanese Yen (JPY).
sell gbpjpy after hit order block

GBPJPYSo basically they’re two things, we broke structure to the upside, now we’re at the former support that was broke, bit price is trading above AMA, but I’d still watch to what happens from next week
GBPJPYPotential long opportunity
- The power of 3 ( Accumulation - manipulation - distribution )
- giving us a clear view of how the market can manipulate you to thinking sellers are in control
- overall uptrend for GBP
- Strong bullish candles
- i will be waiting for the markets Monday to see possible long entries

GBPJPY: Bullish Trend Intact But Showing Slowing MomentumShould we buy up to sell?
(H4)
Strong impulsive bullish leg from 197.00
Clean untested demand zone: 197.20–197.40
(H1)
OB: 198.10–198.20 could act as intraday support
Above 198.80 opens imbalance toward 200
(M15)
Consolidation near 198.50–198.80 liquidity zone
Expecting either:
Pullback to demand zones before continuation
Direct breakout above 198.80 for momentum push
Game Plan For Selling:
Watch for London session liquidity grab above 199.40–199.60
As soon as M15 prints a bearish BOS after the sweep, look for a retest into the M15 supply for entry

GBPJPY bullish reaction to BoE policyKey Support: 196.75
This level marks the prior consolidation zone and serves as a critical pivot. A corrective pullback toward 196.75 followed by a bullish reversal would validate the uptrend, with upside targets at:
199.20 – Initial resistance and short-term target
199.70 – Minor resistance zone
200.40 – Longer-term breakout objective
However, a daily close below 196.75 would invalidate the bullish scenario, potentially triggering a deeper retracement toward:
195.80 – Near-term support
194.80 – Key downside level in a bearish reversal
Conclusion:
As long as 196.75 holds, the bias remains bullish, favoring continuation toward the 199–200 zone. A confirmed break below this support would shift momentum, opening the door for a broader corrective decline.
This communication is for informational purposes only and should not be viewed as any form of recommendation as to a particular course of action or as investment advice. It is not intended as an offer or solicitation for the purchase or sale of any financial instrument or as an official confirmation of any transaction. Opinions, estimates and assumptions expressed herein are made as of the date of this communication and are subject to change without notice. This communication has been prepared based upon information, including market prices, data and other information, believed to be reliable; however, Trade Nation does not warrant its completeness or accuracy. All market prices and market data contained in or attached to this communication are indicative and subject to change without notice.

GJ SELLS 11:30AM - UTC+1There could be a bearish pinbar on the 15miute, breaking back into bearish structure.
Only posting this early to see who sees this.
Will not enter shorts unless the 15min englufs bearish at 11:30

Trading Ideas GBPJPY 1D [Disc On]Fundamental Analysis:
The Fed Interest Rate: 4.50% (in line with expectation)
Bank of England Interest Rate: (release date August 7, 2025)
Note:
idk how to explain but all information is in that chart :v


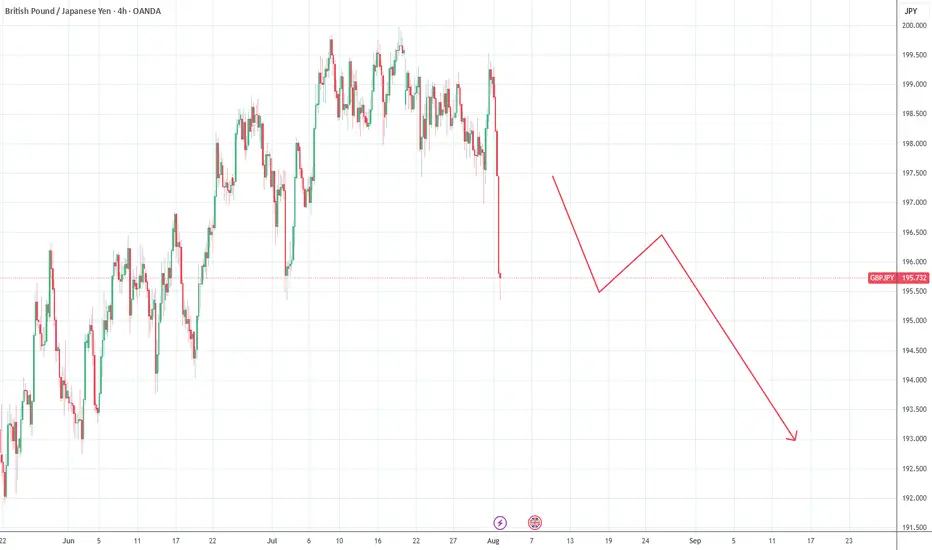
GBPJPY Wave Analysis – 4 August 2025
- GBPJPY reversed from the resistance zone
- Likely to fall to support level 194.00
GBPJPY currency pair recently reversed from the resistance zone between the round resistance level 200.00 (which has been reversing the price from October) and the upper daily Bollinger Band.
The downward reversal from this resistance zone created the daily Japanese candlesticks reversal pattern Bearish Engulfing, which started the active wave c.
Given the predominantly bearish sterling sentiment seen today, GBPJPY can be expected to fall to the next support level 194.00 (target for the completion of the active wave 2).

GBPJPY: trend in 4H timeframeThe color levels are very accurate levels of support and resistance in different time frames, and we have to wait for their reaction in these areas.
So, Please pay special attention to the very accurate trend, colored levels, and you must know that SETUP is very sensitive.
BEST,
MT

GBPJPY BUY SETUP LOOOOOOOOOOOOONGWELCOME TO YOU
we have support which is strong with retest
and we have demand and before it imbalance if you focus on photo
and the price make bos and take liquidity so i will buy with you .but prefer to be there conformation for buying
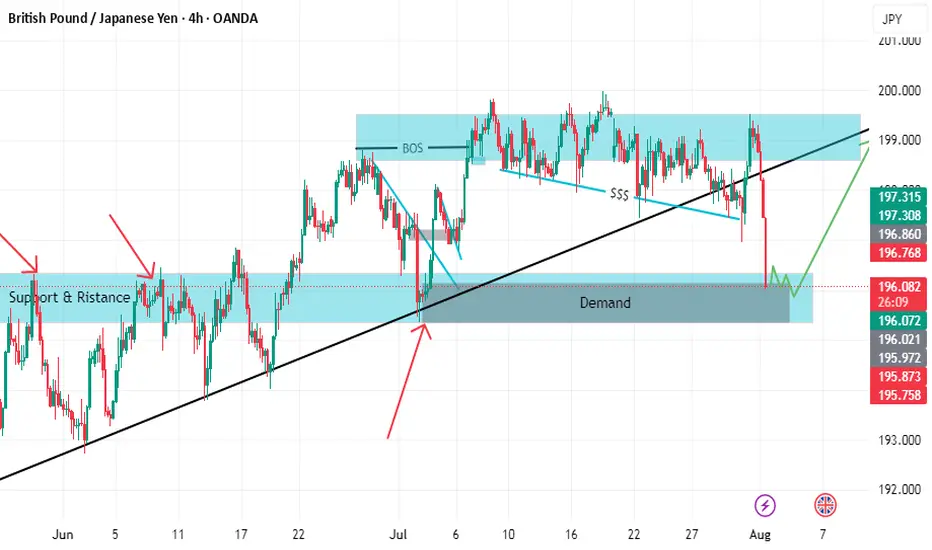
BP/JPY: Strong Bullish Reversal from DemandThe GBP/JPY currency pair has exhibited a strong bullish reversal from a key demand zone, indicating renewed bullish momentum. This pair continues to follow the broader bullish bias observed in GBP crosses, with the Japanese yen (JPY) weakness primarily driven by the Bank of Japan's (BoJ) dovish policy stance.
Technical Analysis (4H Chart)
Upon examining the 4-hour chart, a clear pattern emerges. The pair has demonstrated a bullish rejection from the 195.30-195.50 demand zone, signifying a potential shift in market sentiment. Currently, the pair is trading at 195.58, rebounding from strong support and setting up for a potential upward leg.
Projection
Given the current technical setup, the projection suggests that as long as the 195.34 level holds, GBP/JPY could push toward 197.31, with potential for 199.72 if GBP strength persists. This outlook is contingent upon the pair maintaining its bullish momentum and breaching key resistance levels.
Fundamental Analysis
The fundamental analysis reveals a bullish bias, driven by several key factors:
1. GBP: Supported by BOE's cautious but tight stance: The Bank of England's (BOE) cautious but tight monetary policy stance, driven by persistent inflation pressures, provides support for the GBP.
2. JPY: Remains fundamentally weak: The JPY remains fundamentally weak due to the BoJ's dovish policy stance and avoidance of major policy tightening. Intervention threats only provide short-term support.
3. Risk Sentiment: Mild risk-on conditions favor GBP: Mild risk-on conditions in the market favor the GBP over the safe-haven JPY, further supporting the bullish bias.
Risks
Two primary risks are identified:
1. BoJ FX intervention: BoJ FX intervention could temporarily strengthen the JPY, potentially disrupting the bullish trend.
2. Dovish BOE shift: A dovish shift in the BOE's policy stance could slow GBP momentum, undermining the bullish outlook.

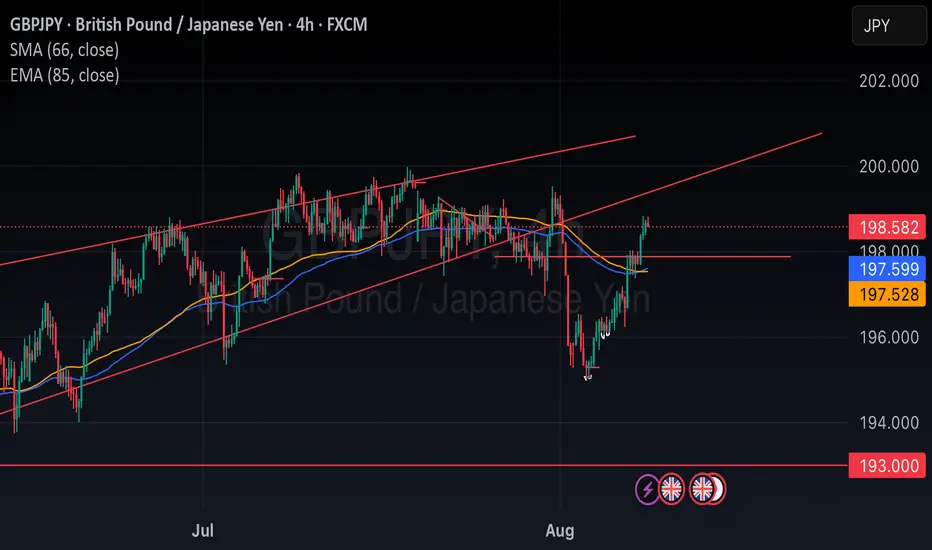
why not eh doodling on the chart, I can change my mind depends on how price moves
key levels and 4 trendlines to gauge the stenght of the waves
Gbp/jpy sellno wonder its friday , last signal was complete wrong , any way gbp/jpy going up but we must test 192 to 190 at first
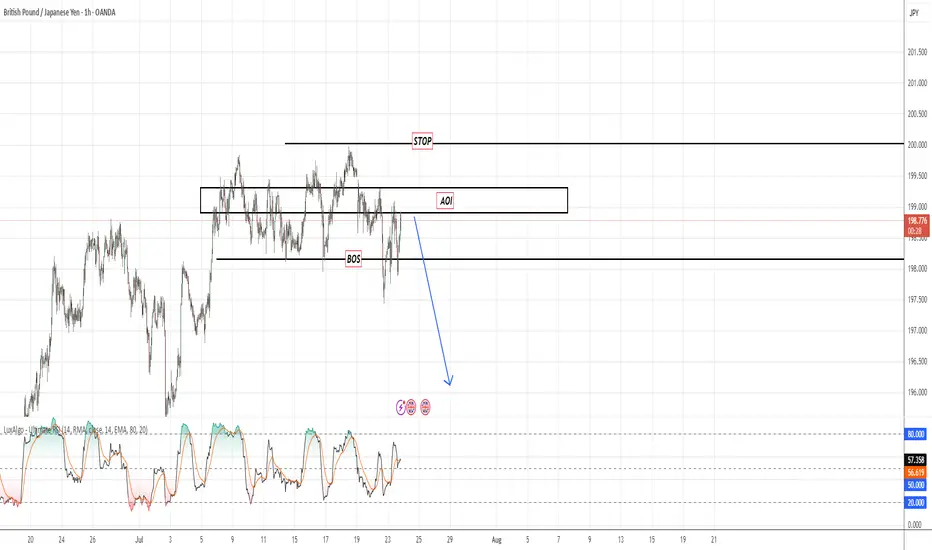
GBPJPY
🧠 Technical Breakdown:
✅ Clear Break of Structure (BoS) around 198.75
🔁 Price retested the Area of Interest (AOI) at previous support now turned resistance
🔻 Strong rejection wick confirms bearish pressure
📉 Expecting continuation toward 195.01 as next major liquidity zone