GBPJPY trade ideas
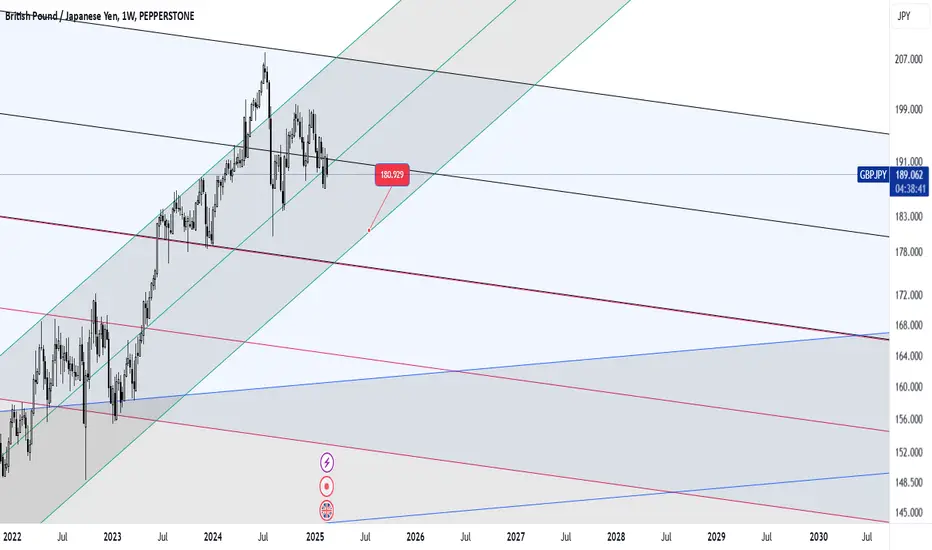
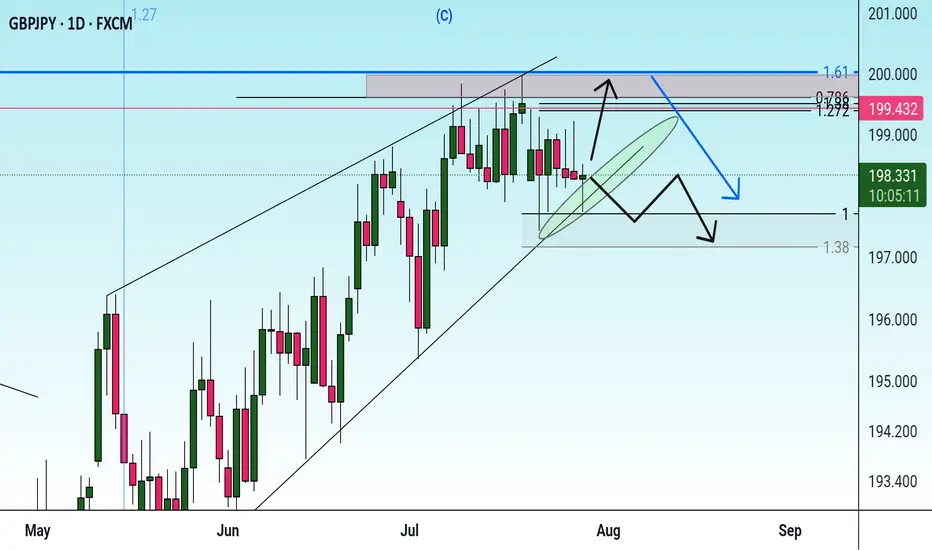
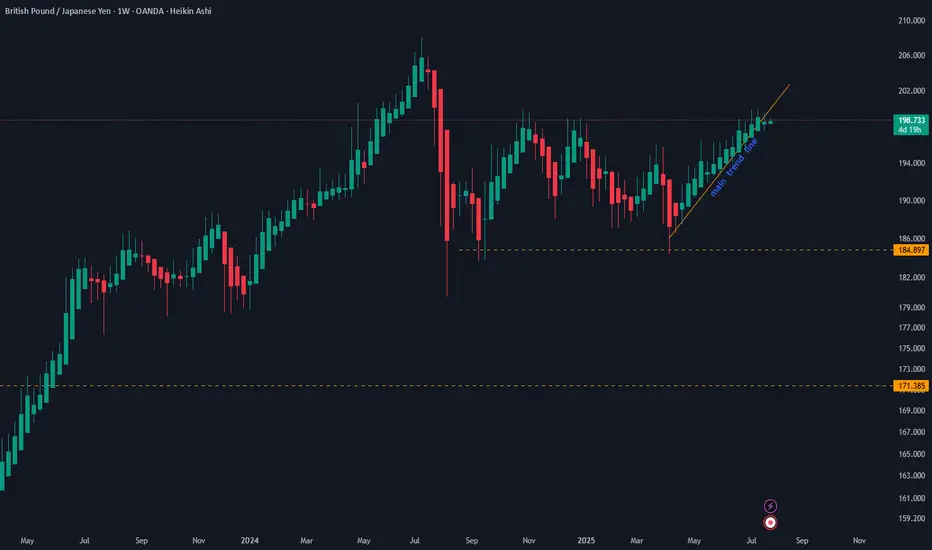
GBPJPY is moving towards a decrease in the parity rate.The predicted direction of movement for this high-margin currency pair seems to me to be more of a corrective one and I have displayed my desired price target on the chart. If it is in line with your analysis, you can use this price target for your profit limit points. Please note that this is a weekly chart.
Thanks
MJ.REZEI
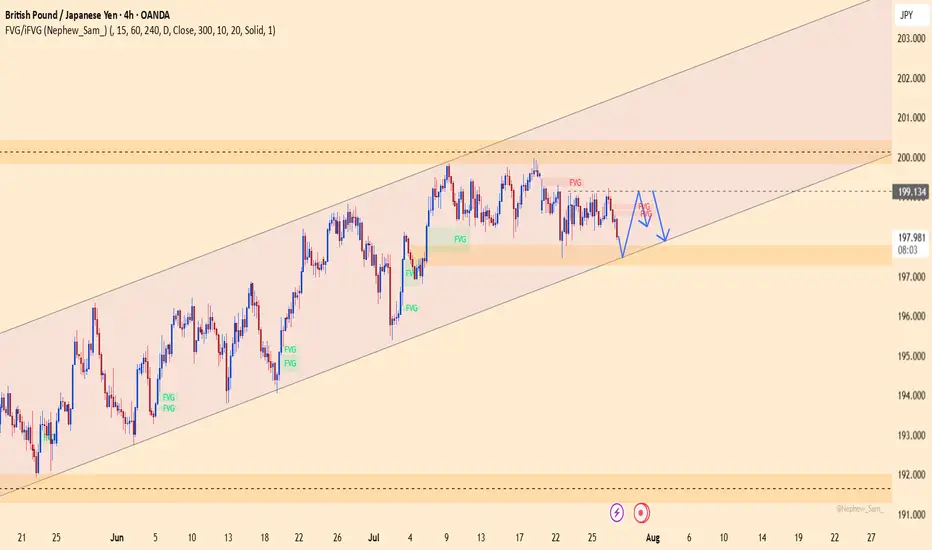
GBPJPY – Bearish pressure returns near ascending channel supportGBPJPY is trading close to the lower trendline of the ascending channel, with the 197.400 zone acting as a key support. A breakdown below this level could trigger stronger bearish momentum.
On the news front, Japan’s CPI remains solid, strengthening the yen. Meanwhile, the British pound is under pressure after recent consumer spending data showed signs of weakness, raising concerns over the UK’s economic outlook.
Strategy: If the price breaks below 197.400 and fails to bounce back, consider SELL setups in line with the bearish trend. If it rebounds, watch the reaction around the 199.100 zone for signs of recovery confirmation.
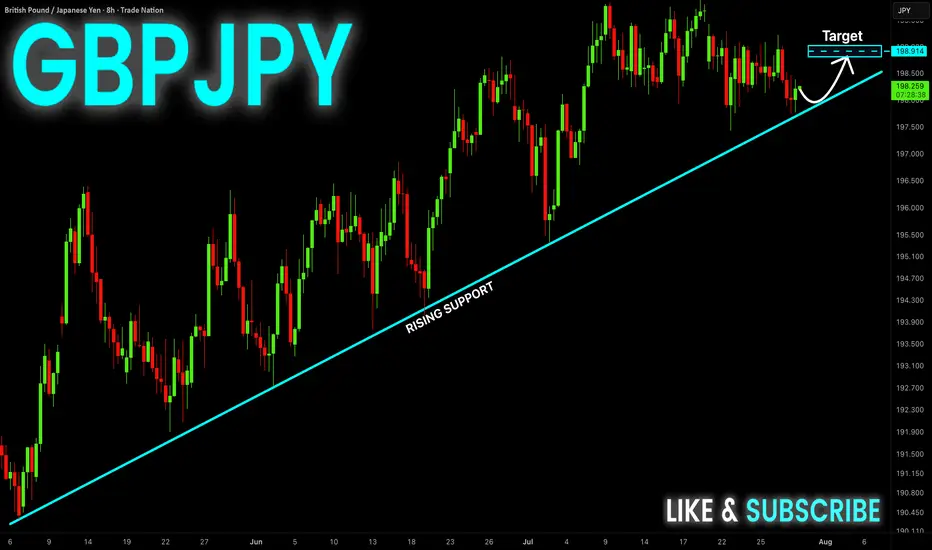
GBP-JPY Rising Support! Buy!
Hello,Traders!
GBP-JPY is trading in an
Uptrend and the pair made
A retest of the rising support
And we are seeing a local
Bullish rebound and we will
Be expecting a further
Local move up
Buy!
Comment and subscribe to help us grow!
Check out other forecasts below too!
Disclosure: I am part of Trade Nation's Influencer program and receive a monthly fee for using their TradingView charts in my analysis.
GBPJPY BUY SETUPGBPJPY is bullish on the daily timeframe and is currently retracing to continue buying. I want to see structural liquidity taken and tap my entry before continuing to the upside.
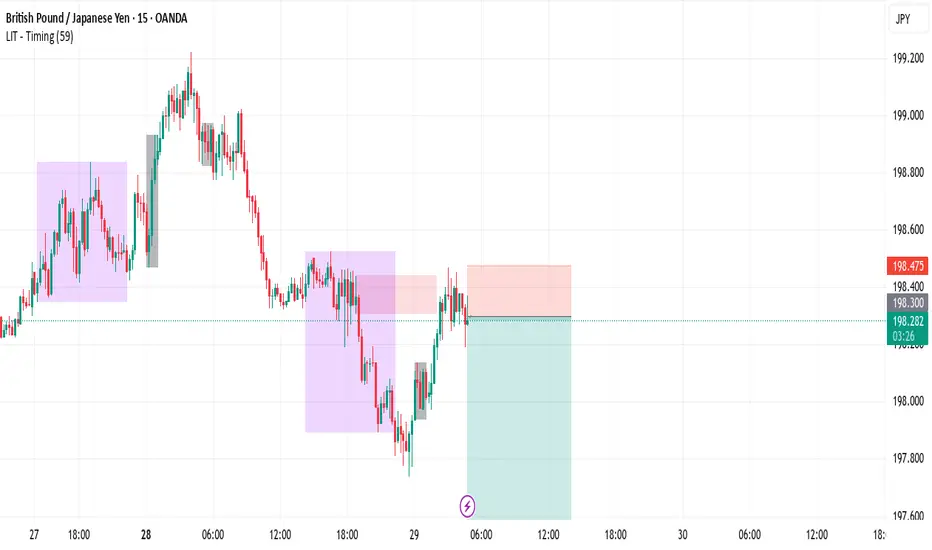
GBPJPY SellLIT cycle combined with Daily cycle. Price is overall bearish as it took liquidity on higher time-frames and we should be trading away from the inducement.
Possibility of correction As long as the price fluctuates above the support trend line, the continuation of the uptrend is likely. If the price crosses the support trend line, it will be a confirmation of the downtrend and the start of a downtrend or correction is likely.
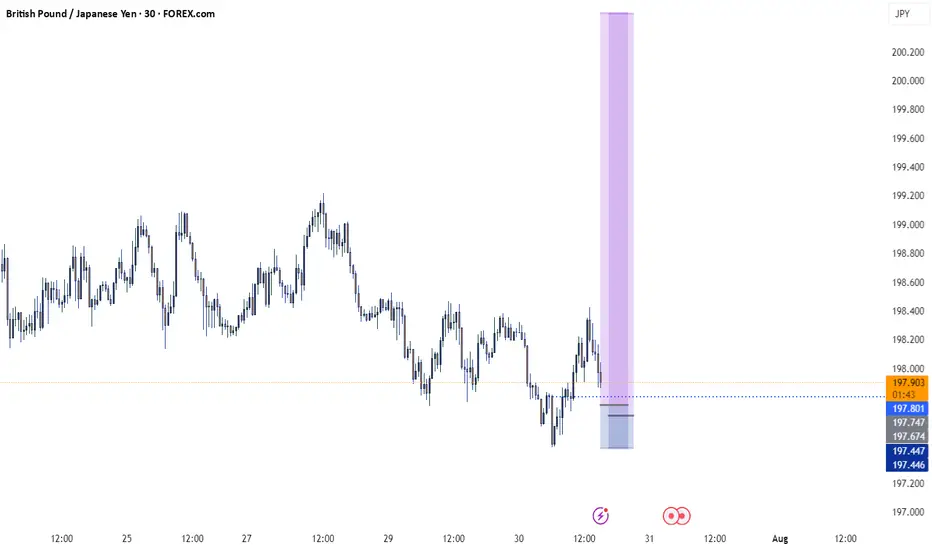
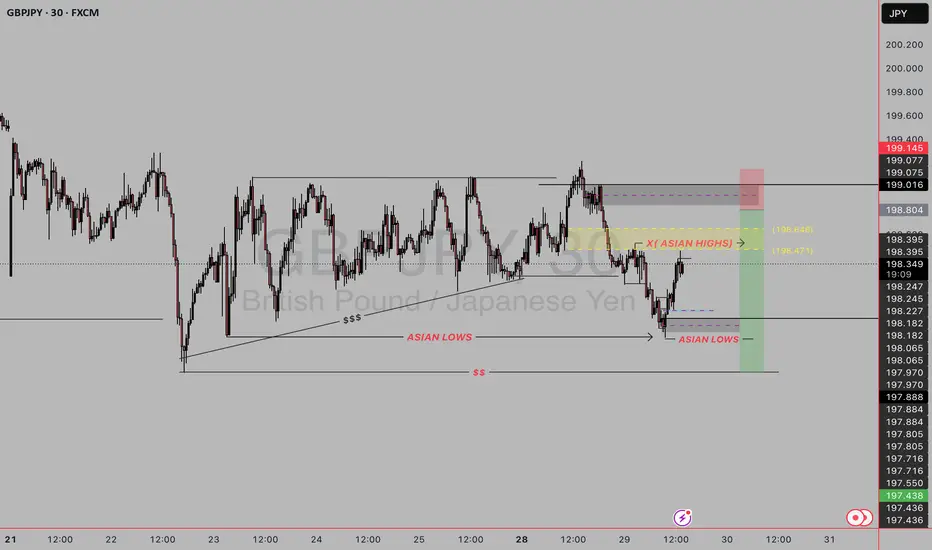
GJ SELL SETUP This GBP/JPY 30-minute chart shows a short trade setup based on Smart Money Concepts (SMC), liquidity sweep zones, and session highs/lows. Here's a breakdown of what’s happening:
1) Key Elements Identified in the Chart
Asian Session Range
Asian Highs (Yellow Zone at ~198.471–198.646): Marked as a key liquidity zone.
Asian Lows (Purple Line): Used for liquidity hunting and market structure context.
2) Market Structure
Prior to this setup, price had a bullish structure, forming higher highs.
Eventually, price broke structure to the downside, suggesting a shift to bearish momentum.
3)Liquidity Grabs
Price swept the Asian lows, tapping into sell-side liquidity.
The current move upward looks like a retracement into the Asian highs, likely aiming to grab buy-side liquidity.
4)Entry Zone
The entry is placed just around the Asian highs, targeting the idea that this area will act as a supply zone or breaker block.
Stop Loss (Red Box): Above the liquidity zone, where a breaker would be invalidated.
Take Profit (Green Box): Targeting the recent lows or continuation lower—likely the low around 197.438.
Risk-Reward Ratio
The R:R looks solid—about 2.5–3:1, suggesting a well-balanced trade.
Why This Is a Bearish Setup
Liquidity Sweep: Price ran below Asian lows, collected liquidity, and is now retracing.
Premium Zone: Current price is retracing into a premium zone (above equilibrium) where sellers are expected to re-enter.
Rejection Expected: The idea is that price will reject around 198.5–198.6 (where previous buy stops are likely stacked).
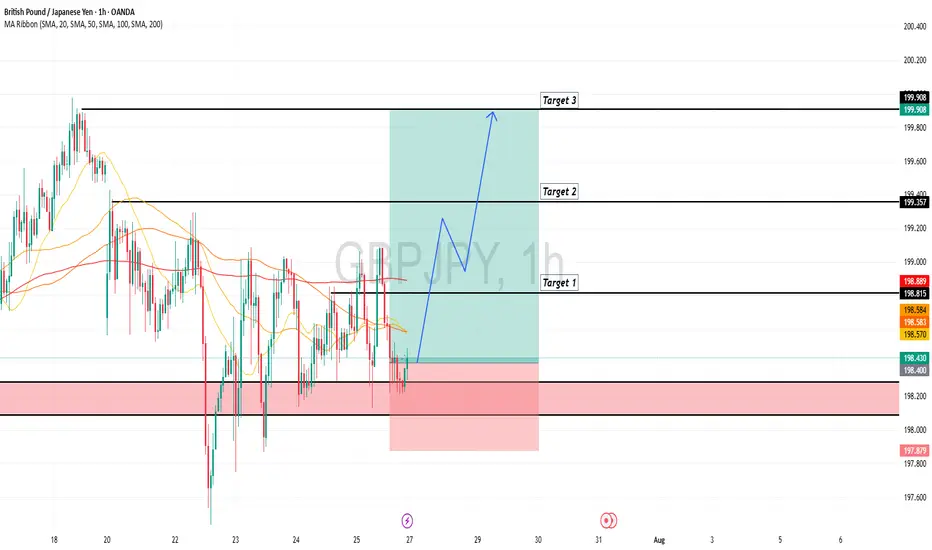
GBPJPY is Holding above the SupportHello Traders
In This Chart GBPJPY HOURLY Forex Forecast By FOREX PLANET
today GBPJPY analysis 👆
🟢This Chart includes_ (GBPJPY market update)
🟢What is The Next Opportunity on GBPJPY Market
🟢how to Enter to the Valid Entry With Assurance Profit
This CHART is For Trader's that Want to Improve Their Technical Analysis Skills and Their Trading By Understanding How To Analyze The Market Using Multiple Timeframes and Understanding The Bigger Picture on the Charts
GBP/JPY SYMMETRICAL TRIANGLESYMMETRICAL TRIANGLE Completion: A potential breakout scenario for GBP/JPY involves the currency pair moving sharply out of a symmetrical triangle pattern. If the pair breaks above the upper trendline, it could signal a bullish move, with traders targeting higher resistance levels. Conversely, a break below the lower trendline may indicate a bearish trend, prompting a search for support levels.
GJ SHORT (Scalp)I have a Supply zone lined at 198.345, found on the 15min. It also correlates with previous hourly resistance found towards the end of June.
I don't expect a massive falloff from this point so I'm just targeting at 1:2RR.
If extreme bearish momentum is to be found, I personally would wait for the unfilled gap at 199.500 to be filled first.
However, by the time you could consider a shift to bullish structure.
For now, I'm focusing on my 1:2 short today.

GBPJPY 4HOUR TIME FRAME BUY ANALYSISOn the 4-hour chart, GBP/JPY is showing clear signs of a renewed bullish trend:
Higher-highs & higher-lows
Since mid-July, price has been carving out a staircase of successive peaks and troughs. The latest swing low around 197.30 held firm, and the subsequent rally cleared the June–July consolidation high near 198.40.
Breakout and retest
Price broke above a shallow descending trendline at ~197.65 late yesterday, then pulled back to retest that line as new support. Your entry at 197.902 sits just above that retest, giving a tight buffer to the stop.
Stop-loss placement
The SL at 197.275 undercuts the recent 4H swing low (197.30), so if that level fails it argues the bullish thesis is invalidated.

SellRejection Level
Daily Volume
Market Structure Shift
Asian Session
Trend Line Break
Untapped Order Point

RECTANGLE CHANNELHello awesome traders! 👋
Hope you’ve managed to grab some solid pips from the markets this week. As we head into the weekend, I’m wrapping things up by dropping a few clean chart setups for you to review and reflect on.
Enjoy the weekend, recharge well — and I’ll see you sharp and ready next week for more structure-led opportunities.
📌 Pattern Breakdown
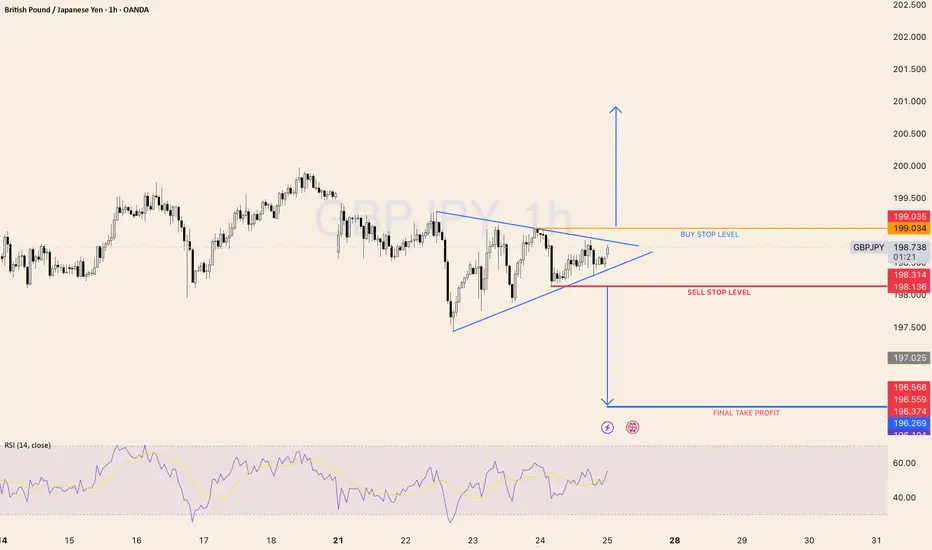
We’ve been tracking a developing rectangle channel between 197.94 (support) and 199.74 (resistance):
🔹 Price formed a clear 4-leg compression
🔹 CD leg bounced off lower support near 197.96
🔹 We’re now approaching the upper edge of the channel at 199.74
🔹 Compression structure suggests breakout potential is building
🚨 Breakout Setup in Focus
🔸 A breakout above 199.75 opens the door toward:
✅ Target 1 Zone:
• 1.5 extension = 200.76
✅ Target 2 Zone:
• 2.0 extension = 201.69
📌 Flip-side: A failed breakout and close back below 197.94 would shift structure toward:
🔻 Bearish Breakdown Targets:
• 1.5 = 197.02
• 2.0 = 196.09
• 2.618 = 194.94
We stay flexible — trade the breakout, not the anticipation.
🧠 Key Concepts in Play
✅ Rectangle consolidation
✅ Breakout-ready structure
✅ Defined upper/lower breakout levels
✅ Volume and reaction at edges = trigger
🗝 Final Thoughts
GBPJPY is boxed in tight — but momentum is clearly leaning bullish.
If we get that clean break above 199.75 with confirmation (volume, close, continuation), the 200.76+ range is firmly in sight. No breakout? No problem — structure has a plan either way.
“Boxes don’t trap the market — they build the tension. Breakouts reward the patient.”
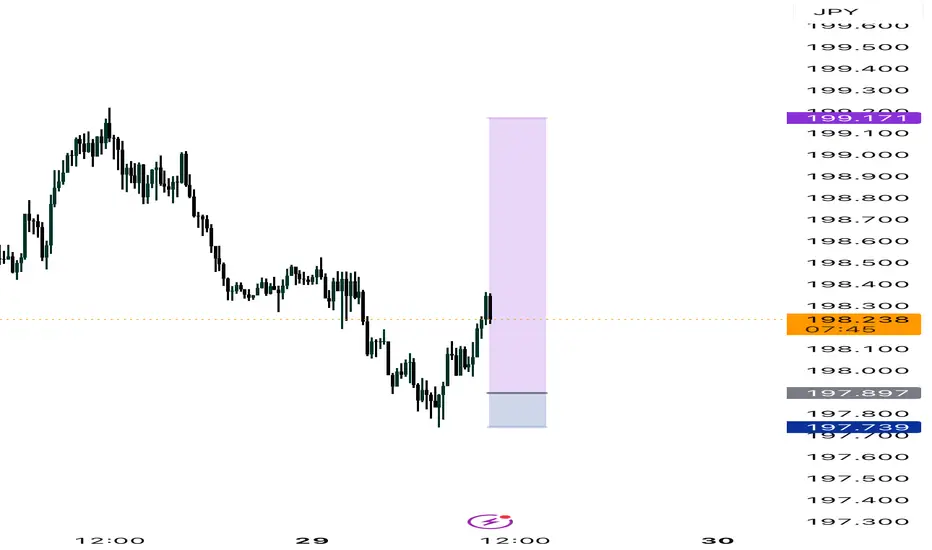
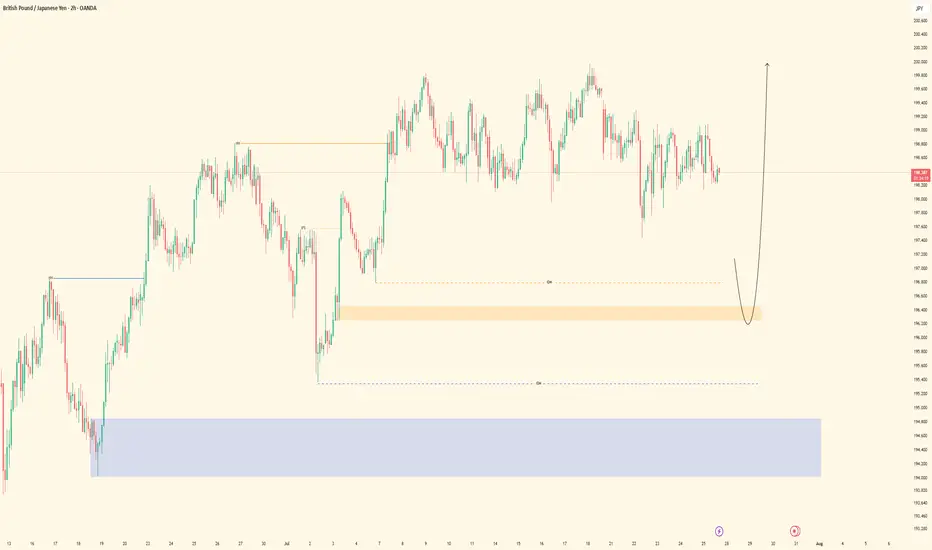
GBPJPY IdeaWe are waiting for our asset to reach our action zone, and based on the reaction, we’ll decide on our next moves.ALWAYS WAIT FOR A CONFIRMATION TO SEE IF THE PRICE VALIDATES THE ZONE.and you what is your vision of the EURUSD its interests me! i wait you in the commentary

gbpjpy
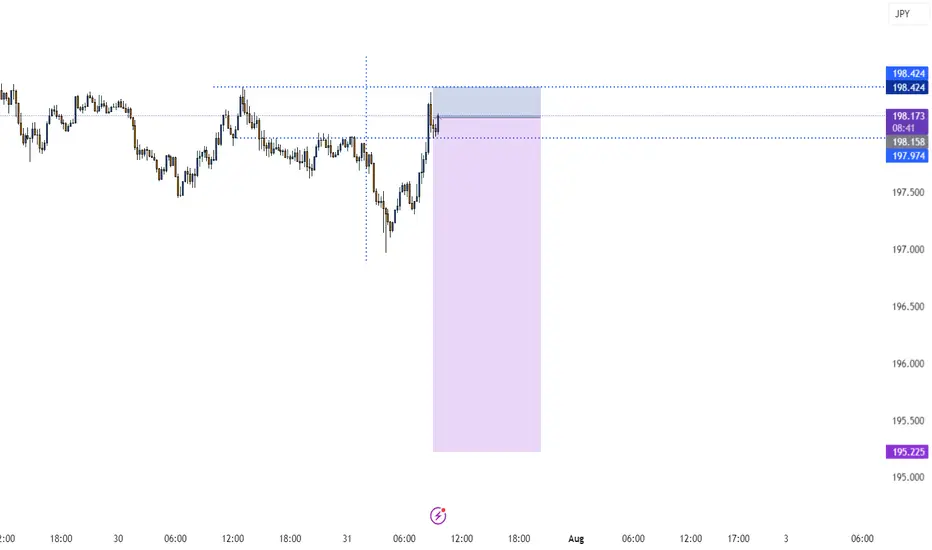
🔔 Trade Entry Recommendation:
Entry Zone: 198.70
This zone presents an ideal entry point for sell, as it lies just above a critical support area,
🛡 Stop Loss:
SL: 199.50
Placing the stop just below the support zone offers a favorable risk-reward ratio, while still allowing for normal price fluctuations.
🎯 Take Profit Targets:
TP1: 198.00
The first target is modest and offers a quick profit potential, ideal for short-term traders.
TP2: 197.50
This level represents a stronger resistance area, where partial profit-taking is recommended.
TP3: 197.000
A psychological round number and a historical price ceiling, which could act as a natural barrier.
Risk/Reward Analysis: This trade setup offers a solid risk-to-reward ratio. The entry and stop-loss are tightly aligned to minimize losses, while the profit targets provide ample upside potential.

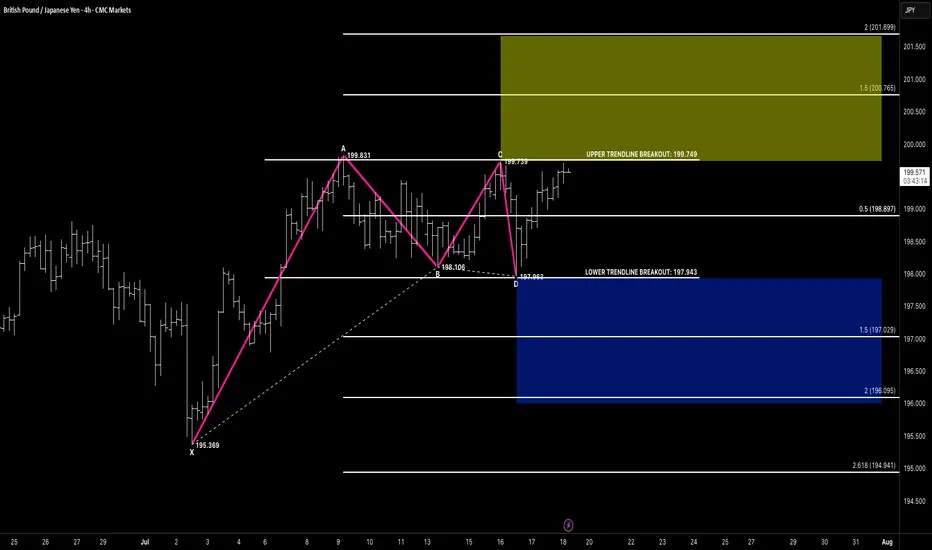
GBPJPY short Fundamental and Trend line structure analysis
possible 600 pip short position
mid term trend line structure break out
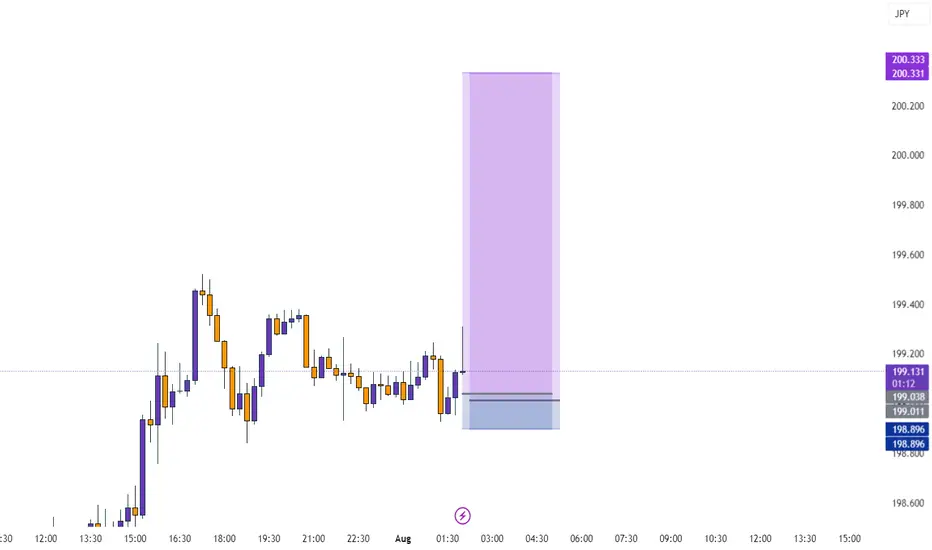
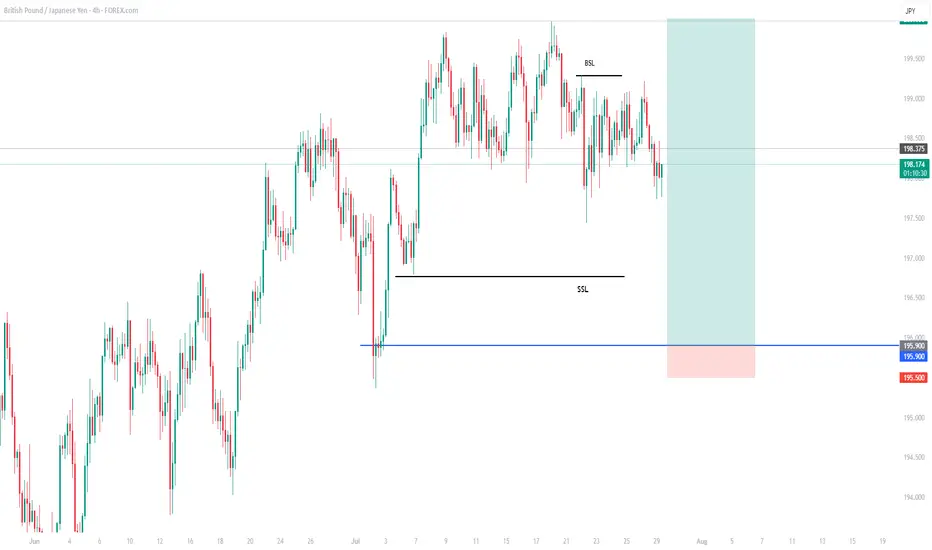
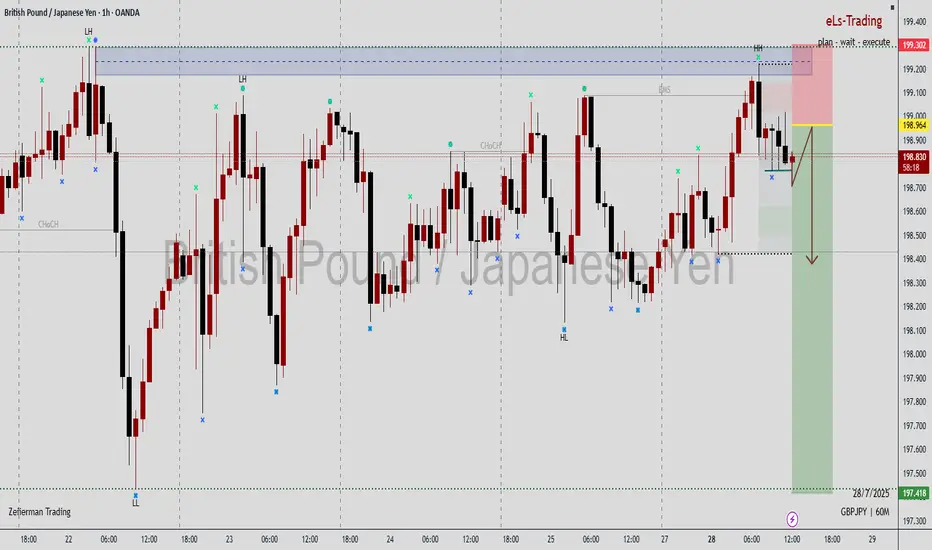
GBPJPY| Bullish Bias - Range Play Before The SweepPair: GBPJPY
Bias: Bullish
HTF Overview (4H):
Structure remains bullish, but price is currently sitting inside a tight top-of-range formation. No clear breakout yet — still waiting on a deeper sell-side liquidity sweep to fuel the next leg. Until then, the focus is on how price dances within mid-range liquidity.
LTF Confirmation (30M):
Still watching for a clean sweep of previous internal lows from last week. 30M OB is refined and marked — once it’s mitigated, I’ll wait for LTF confirmation.
Entry Zone: Will monitor for 5M shift and intent after OB mitigation.
Targets: Initial target = 5M highs; extended = 30M highs depending on price delivery.
Mindset Note: Sitting on hands until Smart Money shows its hand. No rushing range plays. Patience = precision.
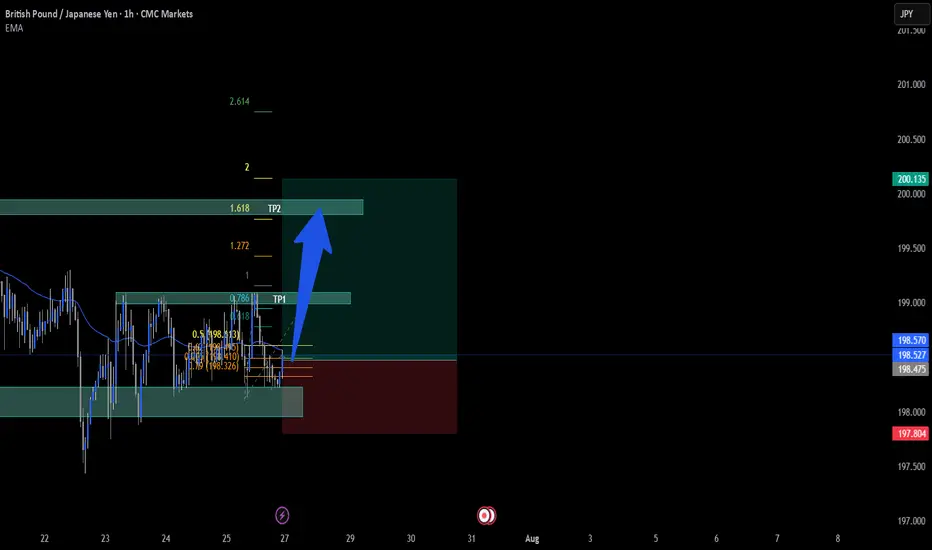
GBPJPY LONGHello, as you can see on the GBPJPY chart, there is a very strong support zone that price has not broken. In fact, we can also identify a fake breakout below that level, which reinforces the strength of the support.
My first target (TP1) is set at the next strong resistance zone, which aligns with a previous support turned resistance. The second target (TP2) is the Order Block (OB) at the top, which also aligns with where my strategy predicts the price will move. This setup suggests a potential bullish move from the current levels.