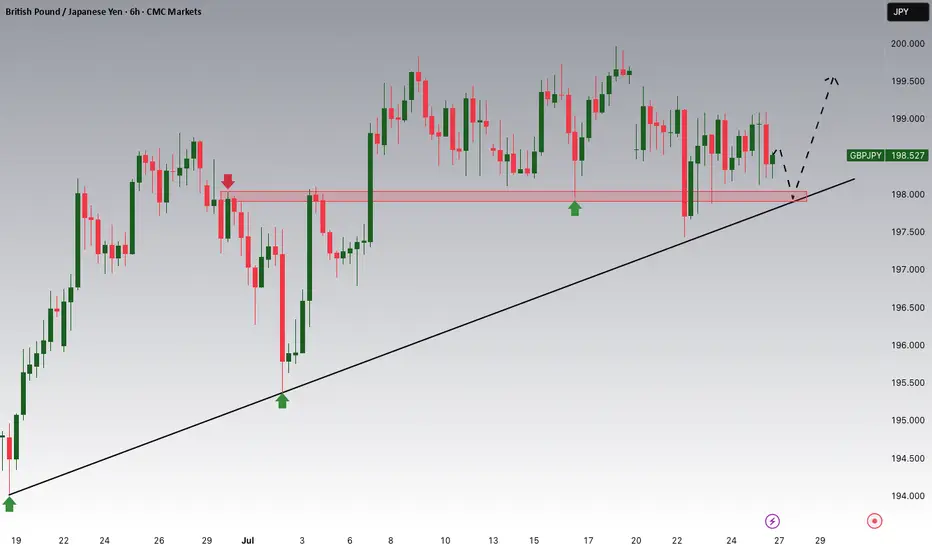
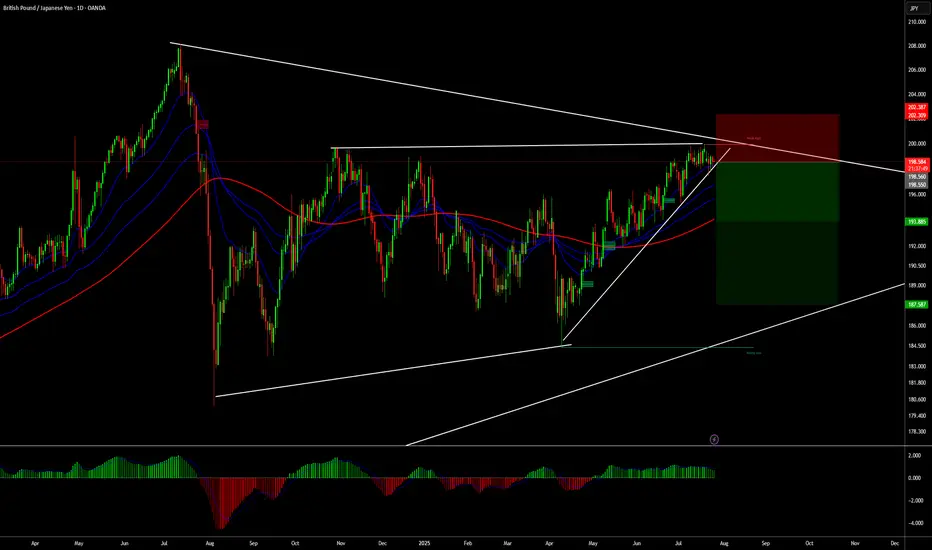
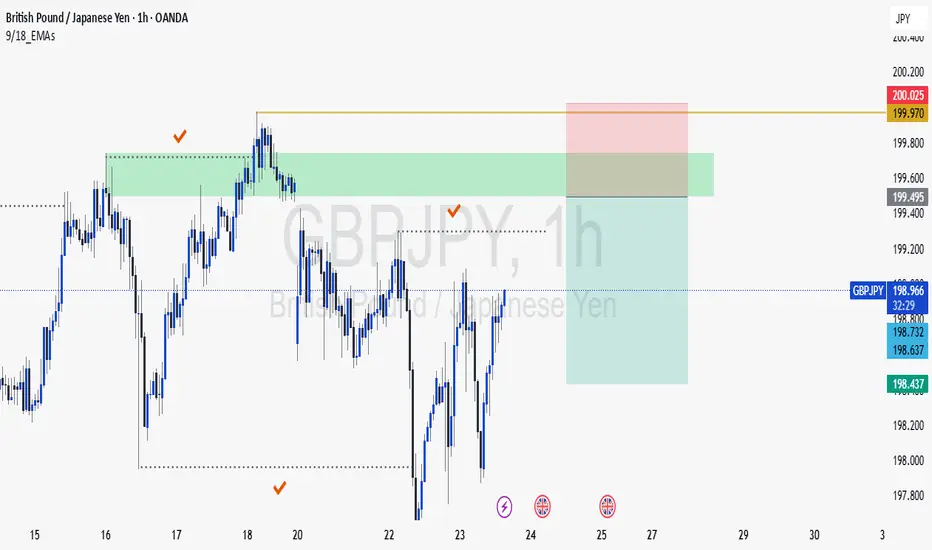
GBPJPY Potential UpsidesHey Traders, in the coming week we are monitoring GBPJPY for a buying opportunity around 197.900 zone, GBPJPY is trading in an uptrend and currently is in a correction phase in which it is approaching the trend at 197.900 support and resistance area.
Trade safe, Joe.
GBPJPY trade ideas
GBPJPY Daily chart analyses
Advanced Price Analysis with Timeframes
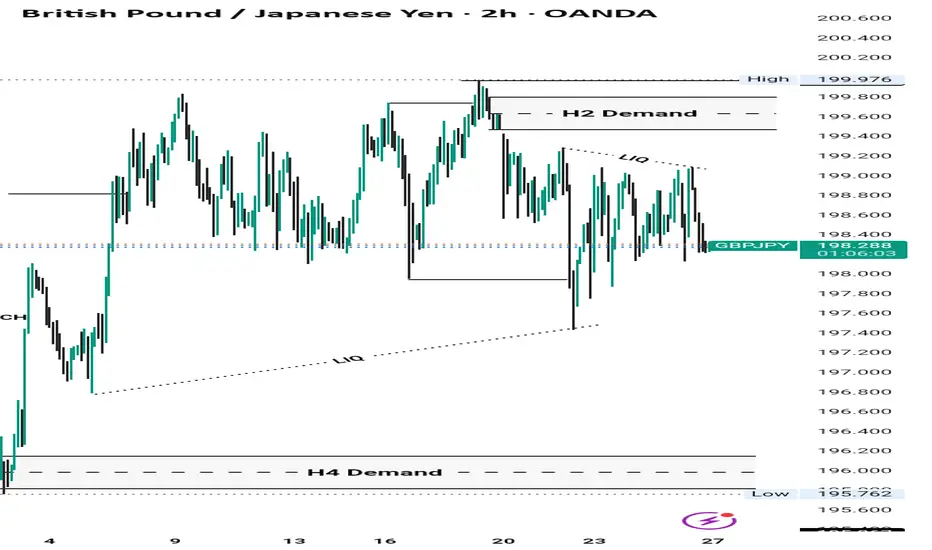
1. Key Observations from the Provided Data (H4 Chart)
Current Price197.800 testing the H4 SUPPORTlevel at 198.000
- Trend Downtrend (Lower Highs & Lower Lows).
- *Recent Structure
- Resistance ~199.600 (rejected multiple times).
- **Support -198.000 (critical level).
- If 198.000 breaks next support is 197.500–197.000
*a) Higher Timeframe (Daily/D1)
- If the **daily trend is bearish**, the H4 downtrend is likely to continue.
- If the **daily trend is bullish**, the H4 drop could be a retracement before a bounce.
- **Key Confirmation Needed**:
- Check if **198.000 aligns with a daily support level** (e.g., Fibonacci, moving averages).
**b) Lower Timeframe (H1/M15)
- **Breakdown Scenario**: If price stays below **198.000** with strong bearish candles, expect a drop to **197.500 → 197.000**.
- **Rebound Scenario**: If price holds **198.000** and forms a bullish reversal pattern (e.g., hammer, double bottom), a bounce to **198.600–199.000** is possible.
---
*3. Key Levels to Watch
| **Level** | **Importance** | **Scenario** |
|-----------------|-------------------------|--------------|
| **199.600** | Strong Resistance | Only break = Trend reversal |
| **198.600** | Minor Resistance | Re-test if bounce occurs |
| **198.000** | **H4 SUPPORT (Critical)** | Hold = Bounce / Break = Drop |
| **197.500** | Next Support | Target if 198 breaks |
| **197.000** | Psychological Support | Strong demand zone |
---
4. Trading Strategy Suggestions**
- **Bearish Bias (Down)**:
- Short if **198.000 breaks** with confirmation (e.g., closing below + high volume).
- Target: **197.500 → 197.000**.
- Stop Loss: **Above 198.300**.
- **Bullish Bias (Up)**:
- Long if **price bounces from 198.000** with a bullish pattern.
- Target: **198.600 → 199.000**.
- Stop Loss: **Below 197.800**.
---
5. Final Verdict**
- **Higher Probability**: **Downside** (unless 198.000 holds strongly).
- **Reversal Signal Needed**: Bullish engulfing, RSI divergence, or volume surge.
**Recommendation**: Wait for **confirmation at 198.000** before taking a trade.

GBPJPY short From what I'm seeing
GBPJPY is not done yet
As buyers have tried to push price higher but pressure from the sellers still keeping price from going any further.
The battle continues
Causing the market to range
Next week tell who wins
For I'm seeing sellers with the upper hand
My thoughts 💭 on GJ 🤔
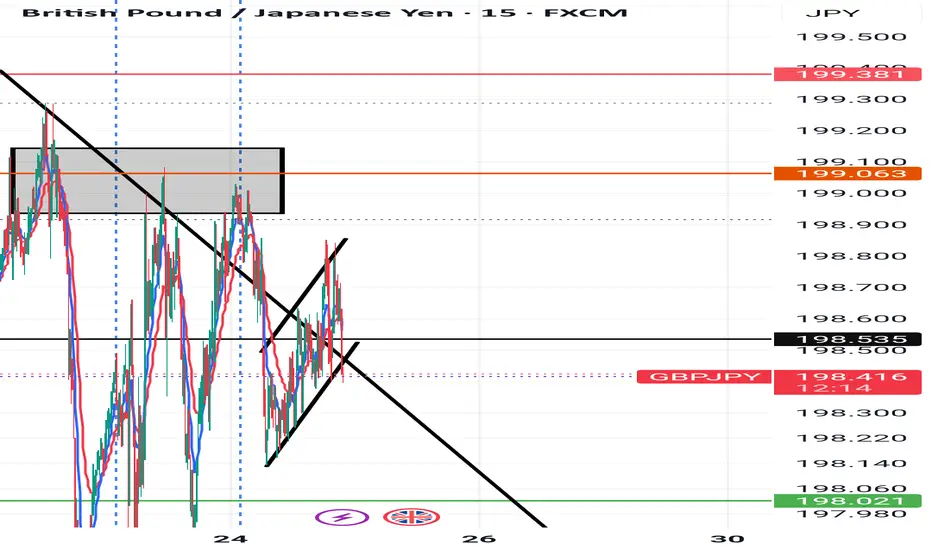
Understanding Market Structure: GBPJPY Trendline Support 📊 GBPJPY Technical Analysis — 15-Min Chart (As of July 24, 2025)
Trend Structure & Price Action
The chart shows a clear ascending trendline, connecting higher lows across the last sessions.
Multiple Break of Structure (BOS) points confirm bullish market behavior, with price consistently forming higher highs and higher lows.
The most recent BOS and price rejection from the lower boundary of the cloud band indicate bullish intent is still active.
Indicators Used
Custom Cloud Band (EMA Based 20, 1.5 settings):
Price is oscillating within and around the cloud band.
Recent candles are attempting to reclaim the upper band, suggesting building bullish momentum.
Volume Profile (VRVP) shows strong volume support around the 198.200–198.500 range, aligning with the trendline.
Support & Resistance
Support Zone: 198.200 (trendline confluence + volume shelf)
Immediate Resistance: 198.800–199.000
Major Resistance: 199.400 (next psychological level and prior high)
Forecast & Trade Idea (Educational Purpose)
If price continues to respect the ascending trendline and breaks above the recent local high (~198.750), we could see a bullish breakout toward 199.200+.
A bullish flag or small consolidation above the trendline before breakout is likely, as illustrated by the arrow.
Invalidation occurs if price breaks and closes below the trendline and 198.200, which may trigger a short-term correction.
✅ Conclusion
GBPJPY is currently in a bullish market structure with support from both trendline and volume profile. A clean breakout above 198.800 with volume confirmation could fuel continuation toward 199.200 and beyond. Risk management is crucial — watch for false breakouts or a shift in structure below the rising trendline.

GBP/JPY - Classic Breakout Trap in PlayPrice nuked below range lows to sweep sell-side liquidity, trapping breakout sellers.
Smart money scooped it up. Entry reclaimed — now eyeing buy-side liquidity above 🎯
This is how the game is played:
1️⃣ Liquidity grab
2️⃣ Breakout trap
3️⃣ Reclaim & reverse
4️⃣ Target resting orders up top 🚀
📈 GBP/JPY – Classic Breakout Trap in Play 🧠💥

Pound-yen consolidates below critical resistanceWeaker retail data and concerns about fiscal policy which affected the pound negatively and caused it to decline against various other major currencies don’t seem to have had a big impact on GBPJPY. Several recent trade deals between the USA and other countries including Japan have reduced demand for havens like the yen and gold. The big shift recently was a significant decline in expectations for the BoJ to hike at its upcoming meeting on 31 July: a hold at 0.5% now seems much more likely.
¥200 would normally be a strong area of psychological resistance and this seems to be likely based on unsuccessful tests in the fourth quarter of 2024. Above there, the next likely area of resistance might be ¥207 around last summer’s highs. Another attempt to push above ¥200 might be more technically likely to succeed because there’s no longer an overbought signal from the slow stochastic. ATR at new lows though could indicate a retracement lower rather than a new upward wave.
There’s no obvious candidate for short-term static support but dynamic support would probably come from the 50 SMA from Bands. British credit and mortgage data on 29 July might increase intraday volatility somewhat but the next strong catalyst is much more likely to come from news about tariffs and/or the BoJ’s press conference on 31 July.
This is my personal opinion, not the opinion of Exness. This is not a recommendation to trade.

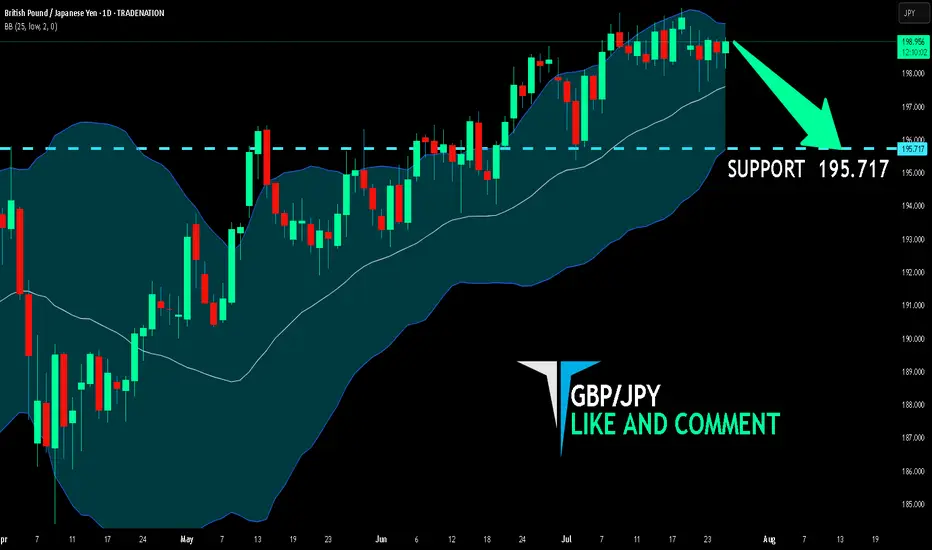
GBP/JPY BEARISH BIAS RIGHT NOW| SHORT
Hello, Friends!
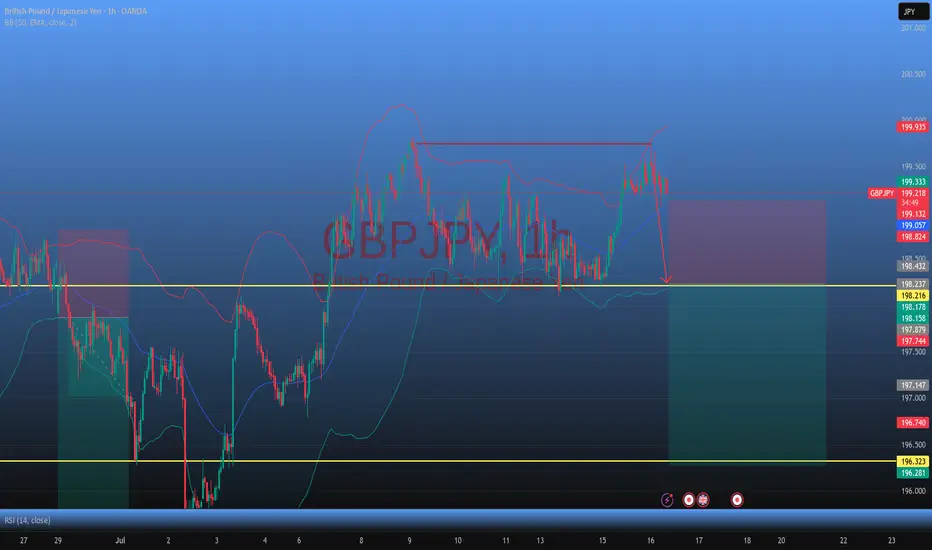
GBP/JPY pair is trading in a local uptrend which we know by looking at the previous 1W candle which is green. On the 1D timeframe the pair is going up too. The pair is overbought because the price is close to the upper band of the BB indicator. So we are looking to sell the pair with the upper BB line acting as resistance. The next target is 195.717 area.
Disclosure: I am part of Trade Nation's Influencer program and receive a monthly fee for using their TradingView charts in my analysis.
✅LIKE AND COMMENT MY IDEAS✅
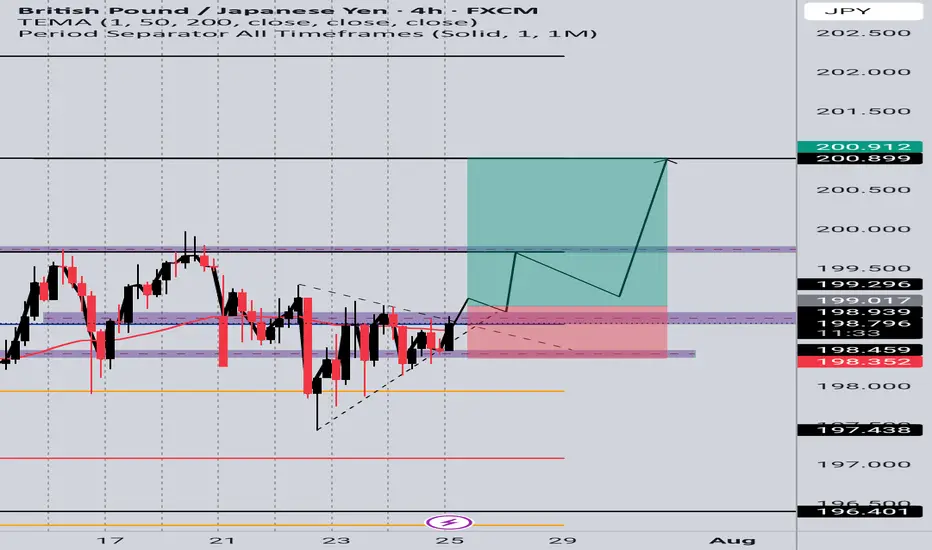
GBPJPY Buy Setup
📈 Entry: 199.017
🎯 Target: 200.912
🔒 Reason: Bullish momentum in play with clean structure. Buying the breakout continuation aiming for psychological resistance near 201.00.
potential here with a bearish moveThis is a continuation pattern to the downside that we are watching for a good short entry on. It could still push up to around 201.125 ish area, so no move yet, just on the radar.
GBPJPY uptrend co0ntinuation support at 196.75Key Support: 196.75
This level marks the prior consolidation zone and serves as a critical pivot. A corrective pullback toward 196.75 followed by a bullish reversal would validate the uptrend, with upside targets at:
199.20 – Initial resistance and short-term target
199.70 – Minor resistance zone
200.40 – Longer-term breakout objective
However, a daily close below 196.75 would invalidate the bullish scenario, potentially triggering a deeper retracement toward:
195.80 – Near-term support
194.80 – Key downside level in a bearish reversal
Conclusion:
As long as 196.75 holds, the bias remains bullish, favoring continuation toward the 199–200 zone. A confirmed break below this support would shift momentum, opening the door for a broader corrective decline.
This communication is for informational purposes only and should not be viewed as any form of recommendation as to a particular course of action or as investment advice. It is not intended as an offer or solicitation for the purchase or sale of any financial instrument or as an official confirmation of any transaction. Opinions, estimates and assumptions expressed herein are made as of the date of this communication and are subject to change without notice. This communication has been prepared based upon information, including market prices, data and other information, believed to be reliable; however, Trade Nation does not warrant its completeness or accuracy. All market prices and market data contained in or attached to this communication are indicative and subject to change without notice.

GBPJPY: Buy ideaHigh probability of an increase in GBPJPY according to the pattern shown on the chart.

GBPJPY Potential UpsidesHey Traders, in today's trading session we are monitoring GBPJPY for a buying opportunity around 197.700 zone, GBPJPY is trading in an uptrend and currently is in a correction phase in which it is approaching the trend at 197.700 support and resistance area.
Trade safe, Joe.
GJ-Thu-24/07/25 TDA-Messy wide range, gap hasn't been filled yetAnalysis done directly on the chart!
Premise:
A simple idea plan (like Tradingview public posts) won't describe everything.
No one can predict how market will move, it's always good to react to how it moves.
It gives an idea of how price might move, but no one come from FUTURE.
So I always encourage people to openly and actively discuss in real time.
I don't give signals blindly, people should learn
and understand the skill.
Following blindly signals you won't know how to
manage the trade, where precisely put sl and tp,
lot size and replicate the move over time.
That's why you need active real time discussions.
Trading is not get rich quick scheme!
Active in London session!
Not financial advice, DYOR.
Market Flow Strategy
Mister Y

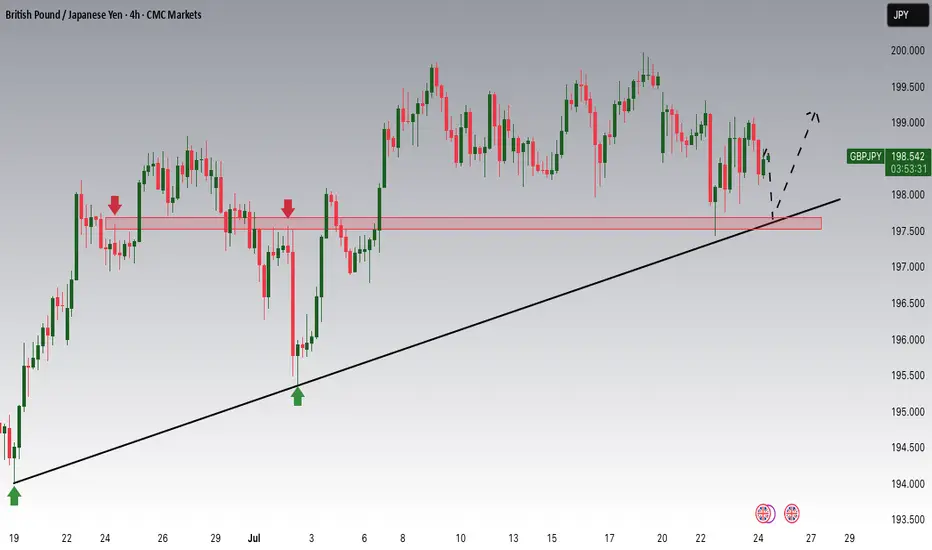
GBPJPY Forming Descending ChannelGBPJPY is currently trading within a well-defined descending channel on the 4H chart, showing signs of building pressure toward an upside breakout. The price has consistently respected both the upper and lower bounds of this channel, creating a controlled correction within a larger bullish trend. With the recent bounce off the lower channel boundary, the pair is now preparing for a potential bullish breakout, aiming for a target zone near 202.700 in the coming sessions.
From a fundamental perspective, the British pound is benefiting from hawkish commentary by the Bank of England, which continues to battle sticky inflation. The latest UK inflation data suggests that price pressures remain elevated, prompting market participants to anticipate further tightening or a prolonged hold in interest rates. On the other hand, the Japanese yen continues to weaken due to the Bank of Japan’s ultra-loose monetary policy, making GBPJPY attractive for long positions amid widening yield differentials.
Technically, the structure remains bullish in the broader context, and this descending channel looks more like a bullish flag—a continuation pattern. If bulls maintain momentum and break above the upper trendline near 199.50, we can expect a strong impulsive move toward the 202–203 zone. The risk remains well-defined below 197.40, which is the recent swing low, giving a healthy risk-to-reward setup for traders.
With strong technical structure and fundamental divergence favoring the British pound over the yen, GBPJPY presents a high-probability long opportunity. I'm looking for confirmation of a breakout on lower timeframes, and once triggered, I expect clean bullish follow-through. Stay ready for the breakout—it’s a textbook setup aligning with macro and technical confluence.

GBPJPY outlook: Potential Sell Setup FormingPrice action has recently broken out of a sustained uptrend and completed a retest of the former trendline support, now acting as resistance. This behavior suggests a potential bearish setup is developing.
📉 Entry Level: ~198.700
🛑 Stop Loss: 199.200
🎯 Take Profit Targets:
• TP1: 196.515
• TP2: 194.521
We’re now watching for confirmation to enter short, anticipating a move toward the stated profit targets should momentum continue to shift in favor of the bears.

GBPJPY – is the end of the range near?After nearly two weeks stuck in the 197.600–200.000 range, GBPJPY has successfully shaken off a bearish fakeout and is now consolidating near the upper FVG zone. The bullish structure remains intact within the rising channel – and this time, the market may not forgive another missed opportunity.
Supporting news:
– UK CPI data released yesterday came in hotter than expected → inflation pressure is back → market expects the BoE to stay hawkish → GBP gains strength.
– Meanwhile, the JPY continues to weaken as the BoJ maintains ultra-low interest rates, setting the stage for this pair to surge.
A breakout above 200.000 could open the door for a push toward the channel top – this could be the ignition point for a major summer rally.

Possible GBY/JPY bullish?I did mark my chart. You can look at it and decipher accordingly! If you have any ideas or mark ups please drop them or tag me in them :)

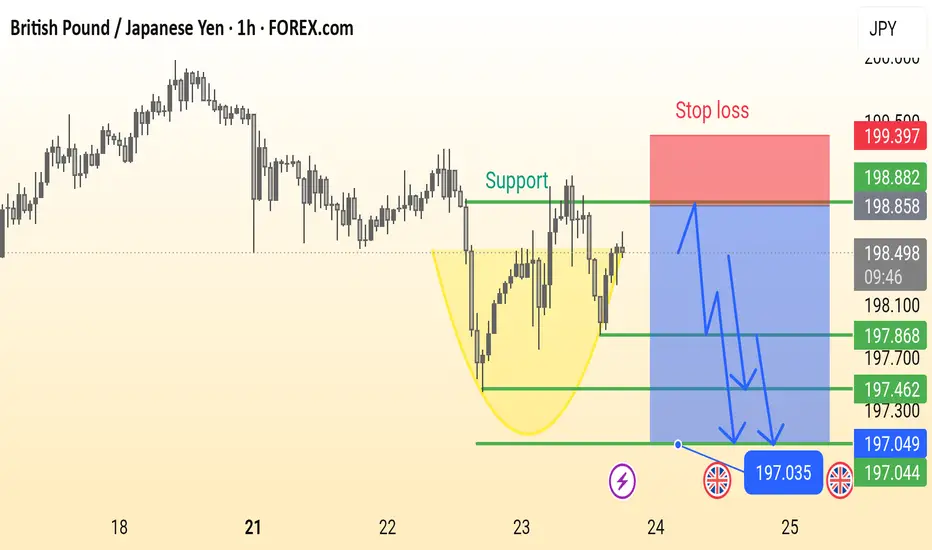
GBP/JPY Analysis is Ready This is a 1-hour chart of the GBP/JPY currency pair showing a potential bearish setup. Key elements include:
Support Zone: Around 198.000, previously tested multiple times.
Bearish Cup Pattern: Highlighted in yellow, suggesting a reversal.
Stop Loss: Marked above 199.397.
Sell Entry Zone: Near the support break at ~198.000.
Bearish Targets: 197.868 → 197.462 → 197.035 (with final support near 197.044).
Bearish Projection Arrows: Indicate expected price movement after breakdown.
This chart suggests a sell setup on breakdown, with well-defined risk and reward levels.
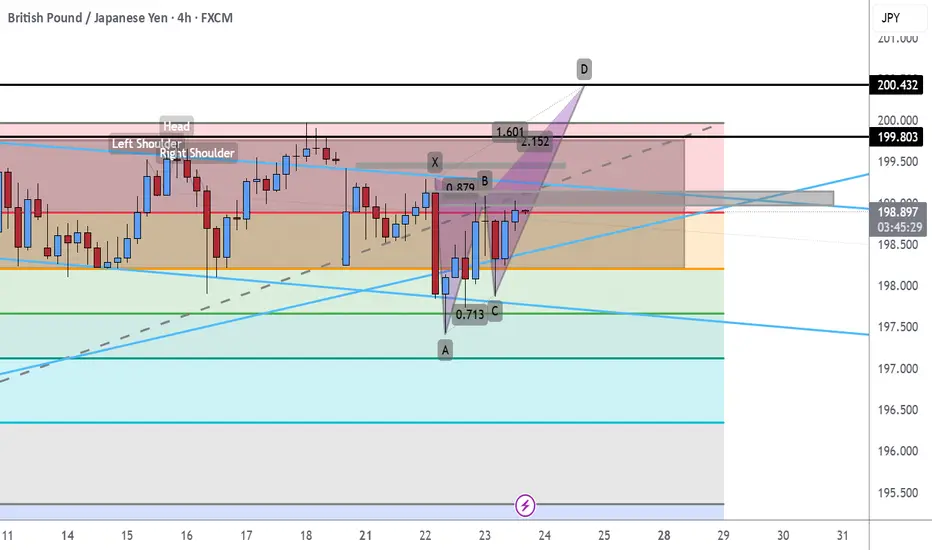
GBP/JPY 4H - Rejection from Supply Zone and Key Fib AreaOverview:
GBP/JPY is trading near 197.91, and recent price action suggests a potential short opportunity. The pair has been rejected from a key Fibonacci resistance zone, and bearish momentum appears to be building beneath a fading ascending channel. Let’s break down why this chart leans more bearish.
Market Structure Breakdown:
* Price action failed to sustain new highs above 199.90 and is now forming lower highs, a potential early sign of trend exhaustion.
* The recent bounce from 197.40 was muted and rejected near the 0.5 and 0.618 retracement levels, indicating strong supply around the 198.68–198.98 zone.
Fibonacci Confluence:
* The rejection occurred right at the 0.618 retracement of the prior downswing — a key Fibonacci level often used by institutional traders to re-enter in the direction of the trend.
* Price is now hovering below the 0.382 (198.38) and 0.5 (198.68) levels, which may now act as resistance.
* If the current rejection holds, downside targets are:
* 0.0 (197.40) – recent low
* -0.27 extension (196.70) – potential bearish continuation target
* -0.618 extension (195.81) – extended downside objective
Trendline & Channel Considerations:
* The ascending channel is losing momentum.
Moving Averages:
* Price is now below the 50 EMA, and testing the 200 EMA, which is at risk of breaking.
* A clear close below both EMAs would confirm bearish momentum.
RSI & Momentum:
* The RSI shows bearish divergence on recent highs and is struggling to break above the midline (50).
* Momentum is tilting to the downside and failing to build higher on bounces.
Key Zones:
* Resistance Zone: 198.60–198.98
* Strong Fibonacci confluence + previous supply
* Support Zone: 197.40
* Prior swing low and 0.0 Fib level
* Bearish Continuation Zone: Below 197.30
* Breakout would confirm downside acceleration toward 196.70 and 195.80
Conclusion:
GBP/JPY is showing signs of bearish pressure beneath key resistance. With the rejection from the 0.618 Fib level and weakening channel structure, the path of least resistance may be to the downside — especially if price breaks and holds below 197.40.
A confirmed breakdown opens the door toward 196.70 and possibly 195.80, as bearish continuation unfolds. Overall we can even see price hitting past historical levels at 189.50
