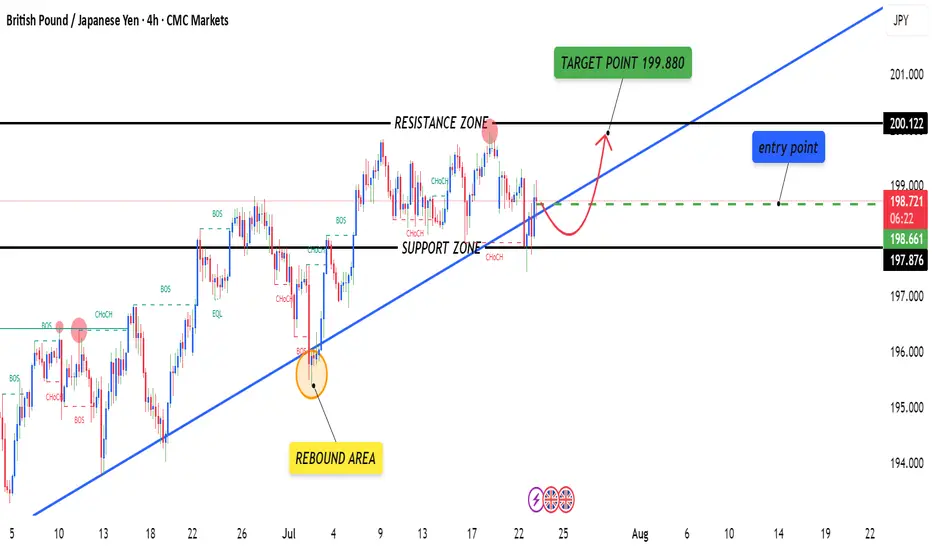
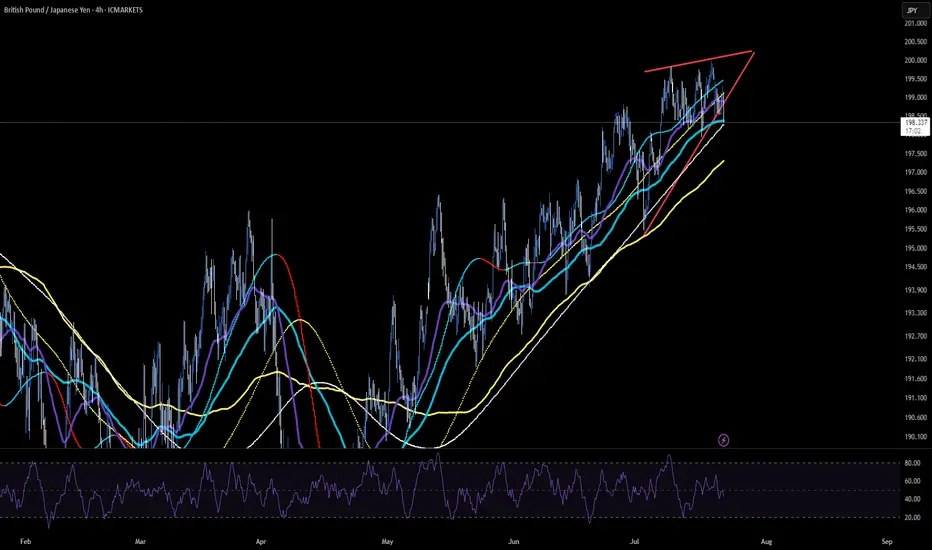
GBPJPY 4HOUR TIME FRAME ANALYISOn the 4-hour chart, GBP/JPY has been tracing out a clear up-trend over the past several weeks, marked by a sequence of higher highs and higher lows. Your proposed long entry at 198.632 neatly coincides with two layers of support:
Trendline support: A rising trendline drawn off the last two significant swing lows intercepts right around 198.6, suggesting the pair is catching a bid as it back-tests that line.
GBPJPY trade ideas
GBPJPY Breakout or Trap? Price in Key Exhaustion Zone | 4H ChannGBPJPY is sitting at a critical point inside an ascending channel. After rejecting the exhaustion zone multiple times, price is trying to reclaim bullish momentum. Key levels to watch:
✅ Bullish Bias: Hold above 198.400 and break past 199.200 for continuation toward 200.000+.
⚠️ Bearish Risk: A break below 198.400 could signal a deeper correction.
The 20 EMA and 68 EMA are converging—expect a strong move soon!
Question: Do you think we break out or fake out? Comment below! 👇
#GBPJPY #ForexTrading #PriceAction #ForexSignals #GBPJPYAnalysis #TradingView #ForexSetup #TechnicalAnalysis #ForexStrategy #SwingTrading #ForexEducation #ForexMarket #DayTrading

GJ-Wed-23/07/25 TDA-Gap hasn't been filled yet!Analysis done directly on the chart!
Premise:
A simple idea plan (like Tradingview public posts) won't describe everything.
No one can predict how market will move, it's always good to react to how it moves.
It gives an idea of how price might move, but no one come from FUTURE.
So I always encourage people to openly and actively discuss in real time.
I don't give signals blindly, people should learn
and understand the skill.
Following blindly signals you won't know how to
manage the trade, where precisely put sl and tp,
lot size and replicate the move over time.
That's why you need active real time discussions.
Trading is not get rich quick scheme!
Active in London session!
Not financial advice, DYOR.
Market Flow Strategy
Mister Y

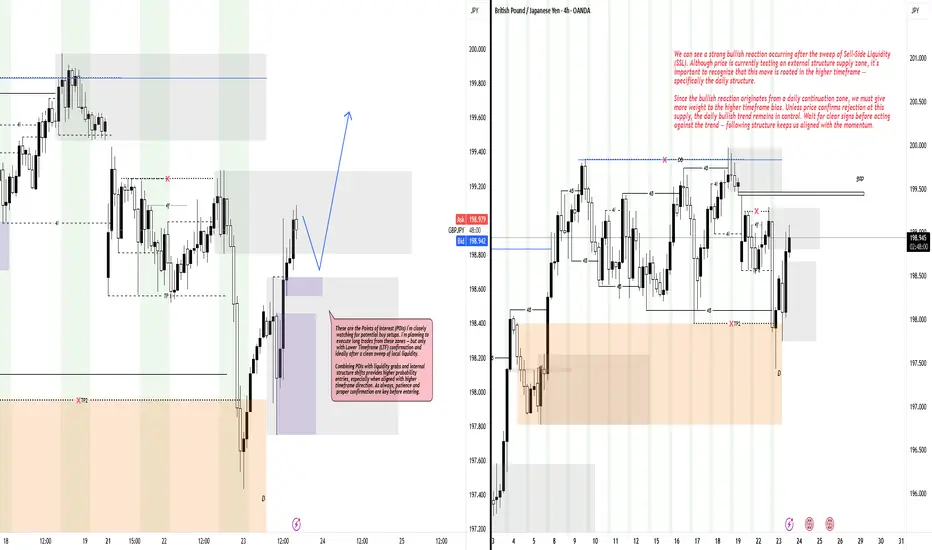
Bullish Continuation Setup: Reacting from Daily StructureHey Traders, hope you’re having a great day! 👋
GBPJPY is making a sharp bullish reaction after sweeping the Sell-Side Liquidity (SSL). Although price is currently at an external structure supply zone, this move originates from the daily structure, so the dominant daily bullish continuation bias remains intact.
I’m watching key Points of Interest (POIs) for potential buy trades, planning to enter only with Lower Timeframe (LTF) confirmation and after a clean liquidity sweep. This method combines smart liquidity hunting with structural alignment, increasing the probability of successful trades.
Patience and proper confirmation will be key to trading this setup effectively.
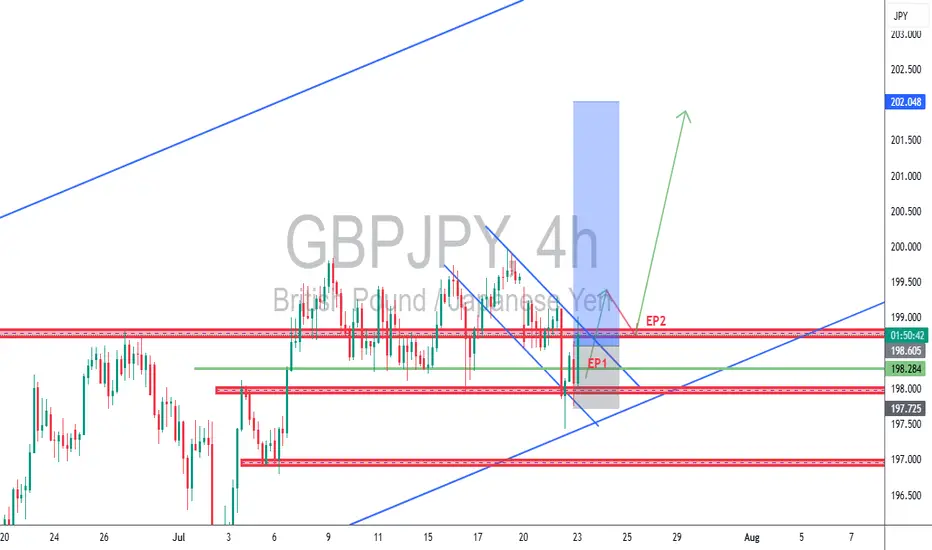
GBPJPY 4H – A+ Setup Using TCB Strategy, Bullish continuation
📈 GBPJPY 4H – A+ Setup Using TCB Strategy 🔥
Bullish continuation setup unfolding with precision.
✅ Trend Phase:
Higher highs and higher lows confirm uptrend
Price bounced from ascending trendline and demand zone
EP1 already triggered on bullish rejection from key support
✅ Countertrend Phase:
Falling wedge (countertrend channel) broken to the upside
Early confirmation for continuation from breakout
✅ Breakout Phase (Pending):
Clean structure at 199.00 acting as resistance
EP2 will be activated after bullish breakout + successful retest of 199.00
Targeting major resistance around 202.000
📍 SL below demand (~197.70)
🎯 TP: 202.000
⚖️ RRR: ~1:3
🧠 Confluences:
Bullish trendline support
Demand zone reaction
Falling wedge breakout
Upcoming key level breakout (199.00)
Price action confirmation
📌 Watch closely for the breakout-retest of 199.00 before engaging EP2.
Manage risk, move SL to breakeven at 1:1.
🔖 Hashtags:
#GBPJPY #ForexSetup #TCBStrategy #TechnicalAnalysis #BreakoutTrade #SwingTrading #SmartMoneyConcepts #FXSignals #TrendTrading #PriceAction #TCBFlow
🗣️ Drop your comment if this setup adds value or aligns with your bias! 👇
GBPJPY – breakout loading: final leap to 200.500?After days of compression, GBPJPY is flashing clear signs of an explosive breakout.
Price is holding firmly above the ascending trendline and consolidating right at the top of the FVG zone – a strong signal that buyers are preparing to punch through the 200.500 resistance in one decisive move.
Meanwhile, the JPY continues to lose ground as the BoJ shows no clear intention to hike rates, while GBP gains support on expectations that the BoE will maintain its hawkish stance longer due to persistent core inflation.
Trade setup (reference):
Buy limit: 198.900
SL: below 198.500
TP: 200.500

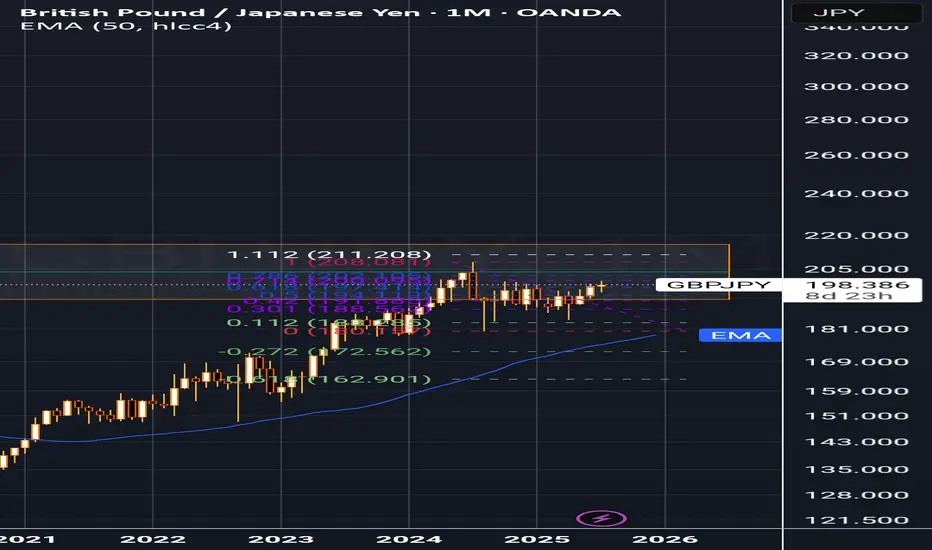
MAJOR MONTHLY SUPPLY ZONE ON GBP/JPY SELLERS INBOUNDRegarding the monthly supply zone, my technical analysis indicates that the price has historically failed to breach this area over several years. I anticipate a potential reversal and recommend waiting for confirmation, such as a double top or harmonic pattern, before initiating a sell position. Furthermore, i will consider selling opportunities upon the .618 Fibonacci level being reached.
Entry: 199.0
Take Profit: 183.3
Overall Price Target: 163.0
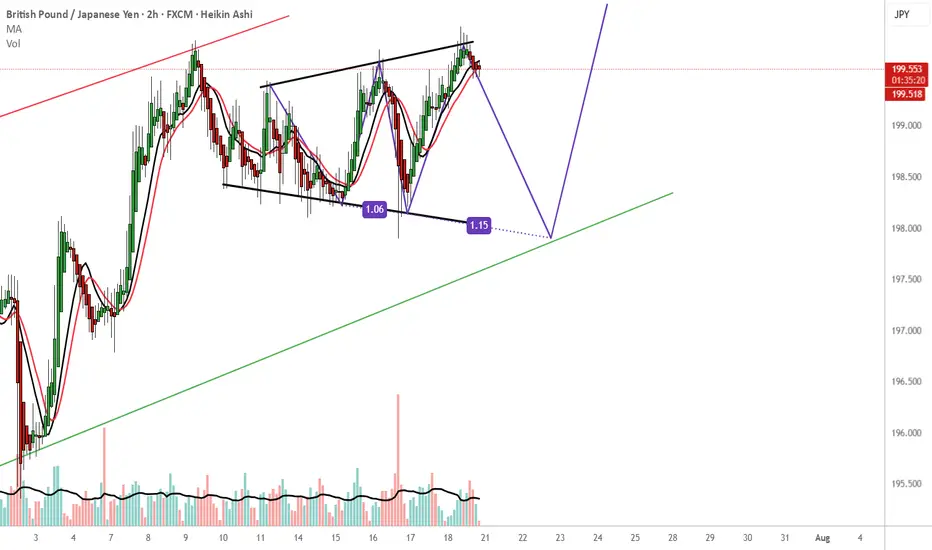
GBPJPY - How i see the market. WHAT DO YOU THINK?A channel within a channel .
Short-term bearish pressure to complete the 3-drives pattern, which ultimately suggests a long bullish setup. I'd only consider this setup if the trend continues to 198.000.
side note
198.000 I'll be looking for buying opportunities to the upside probably until we hit the red channel trendline. That should guarantee approx. 350pips.
You could take advantage of the current bearish move and rejoin when the bulls hit the ground running. Remember use your own trading plan and enjoy the ride . It can go either way but hopefully it respects PA and goes with this flow.
Gbpjpy buy The pound looks like it has finally given a signal for a buy bouncing off a nice support zone and fib , I can see a good healthy rise from 198.126 take profits at 199.857

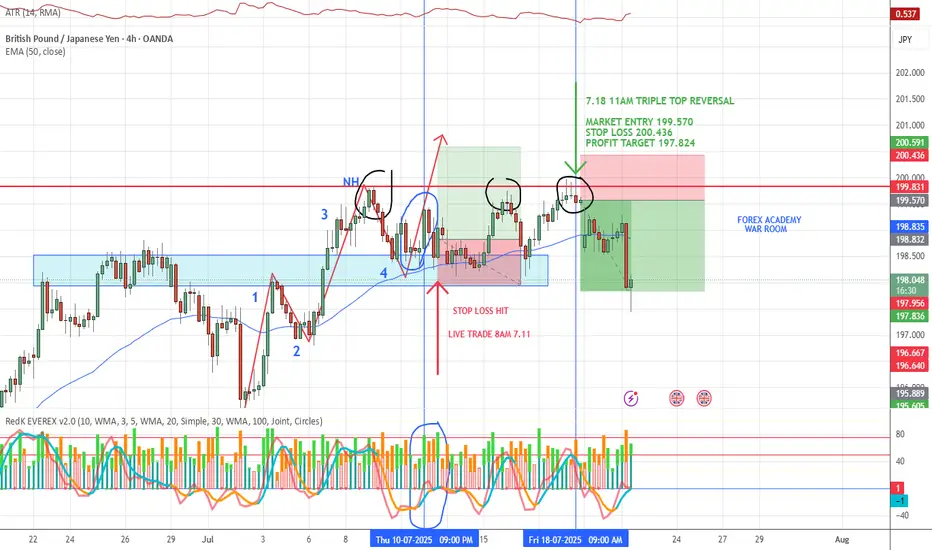
GBP/JPY WIN📈 VMS Strategy – GBP/JPY Triple Top Win
Another clean triple top reversal, this time on GBP/JPY, using the VMS strategy.
This trade checked every box:
✅ Clear triple top structure
✅ Strong engulfing candle
✅ Volume + momentum aligned perfectly
✅ Entry near the 50EMA with patience and confirmation
Price made a solid move in our favor and hit the profit target earlier this morning.
If you’re finding value in the VMS system, consider sharing it with someone who needs structure, patience, and a real edge.
📌 The trade either fits the rules—or it doesn’t. That’s what makes this work.
GBPJPY is in the Down Trend From Resistance LevelHello Traders
In This Chart GBPJPY HOURLY Forex Forecast By FOREX PLANET
today GBPJPY analysis 👆
🟢This Chart includes_ (GBPJPY market update)
🟢What is The Next Opportunity on GBPJPY Market
🟢how to Enter to the Valid Entry With Assurance Profit
This CHART is For Trader's that Want to Improve Their Technical Analysis Skills and Their Trading By Understanding How To Analyze The Market Using Multiple Timeframes and Understanding The Bigger Picture on the Charts
buy idea GBPJPYSeveral weeks after this pair, we observed these possible scenarios. The only thing that could change our analysis is a change in the structure in the red-marked area.

GBPJPY 4H – Demand Zone Rejection | Bullish Continuation🏹 GBPJPY 4H – Demand Zone Rejection | Bullish Continuation
GBPJPY tapped into a key 4H demand zone with a strong rejection wick, respecting both horizontal support and trendline structure. With bullish momentum building, price is likely to push toward the psychological 200.000 level.
✅ Demand zone + trendline confluence
✅ Bullish rejection after liquidity sweep
✅ Clean 1:3+ RRR setup
✅ Clear HTF bullish structure
Strategy: TCB – Trend Phase (Pullback Entry)
Entry Zone: 198.800
Stop Loss: 198.370
Take Profit: 200.000
Checklist Score: ✅ 100% A+ setup
#GBPJPY #ForexSetup #SmartMoney #PriceActionTrading #DemandZone #TrendTrading #ForexAnalysis #TCBStrategy #LiquiditySweep #SwingTrade #JapaneseYen #BullishMomentum #ForexChart #TradingViewIdeas #GBPJPYAnalysis

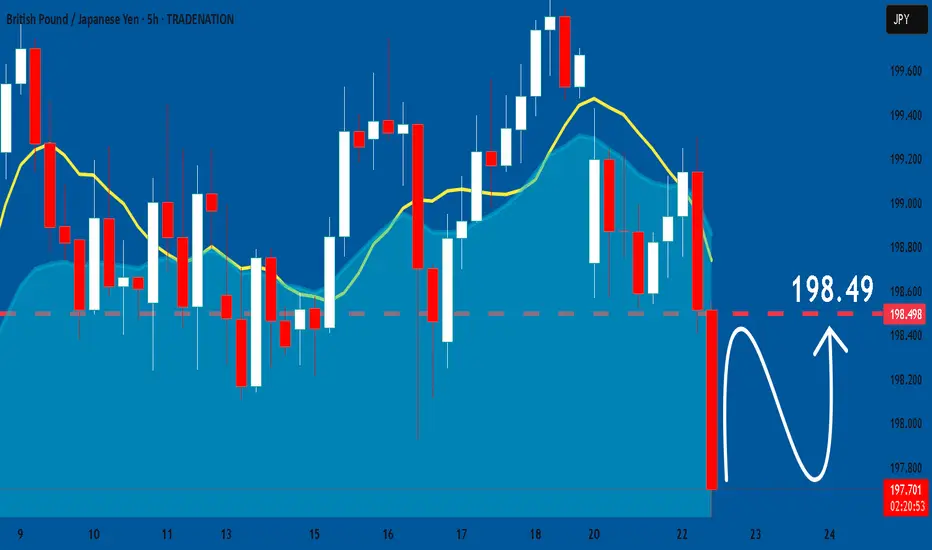
GBPJPY: Swing Trading & Technical Analysis
It is essential that we apply multitimeframe technical analysis and there is no better example of why that is the case than the current GBPJPY chart which, if analyzed properly, clearly points in the upward direction.
Disclosure: I am part of Trade Nation's Influencer program and receive a monthly fee for using their TradingView charts in my analysis.
❤️ Please, support our work with like & comment! ❤️
GBPJPY Reversal SetupFundamentals in Politics:
Japan's ruling coalition (Liberal Democratic Party and Komeito) has lost its majority in the upper house of parliament in recent elections. This is a significant setback for Prime Minister Shigeru Ishiba, though he has stated he will remain in office to combat inflation and continue trade talks with the US.
The election results indicate a surge in support for right-wing populist parties, fueled by public frustration over economic challenges like soaring rice prices and inflation exceeding wage growth. This weakened position for Ishiba's government could lead to legislative gridlock and impact future policy decisions, including those related to trade and the Bank of Japan's monetary policy.
JPY has been experiencing notable fluctuations, largely influenced by the recent election results and their potential implications for monetary policy:
Initial Yen Strength Post-Election: Following the weekend election results where Japan's ruling coalition lost its upper house majority, the Japanese Yen showed significant strength, gaining nearly 1% against the USD. This was somewhat counter-intuitive for some analysts who expected political uncertainty to be yen-negative.
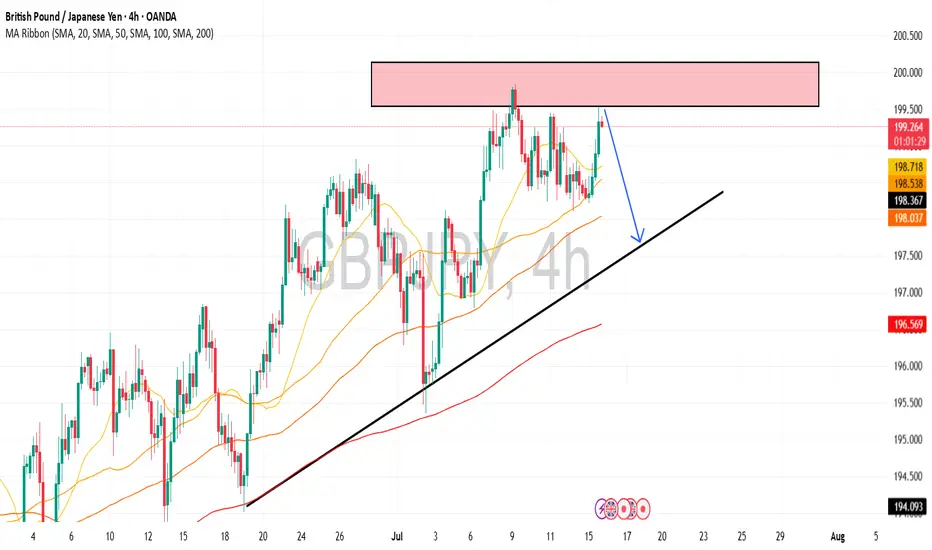
However, technicall DRAGON ( GBPJPY) seem to make a correction after testing 200.000 line.
Closing below 197.000s will trigger a deeper bearish correction.
Good Luck!
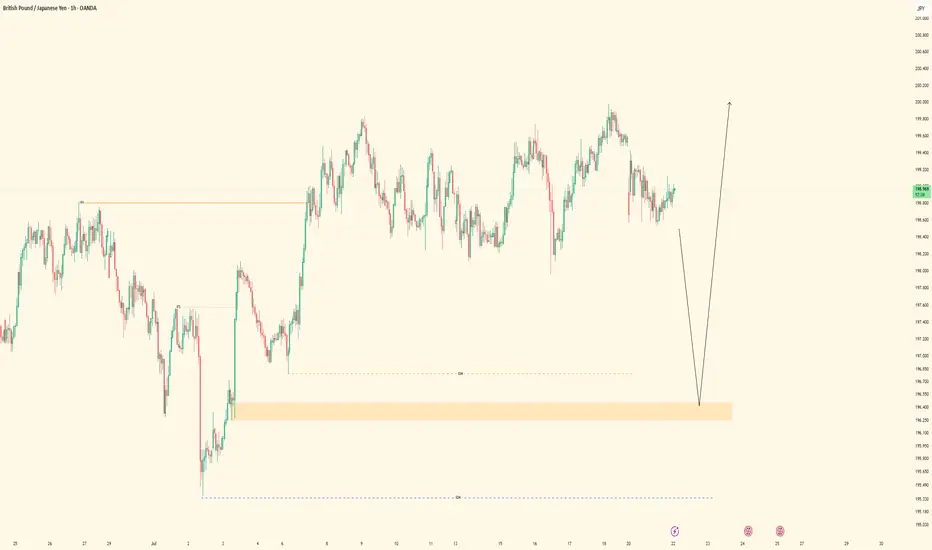
GBPJPYGBPJPY needs one more push down as a correction before a rise.
Disclosure: We are part of a Trade Nation's influencer program and receive a monthly fee for using their Tradingview charts in our analysis.
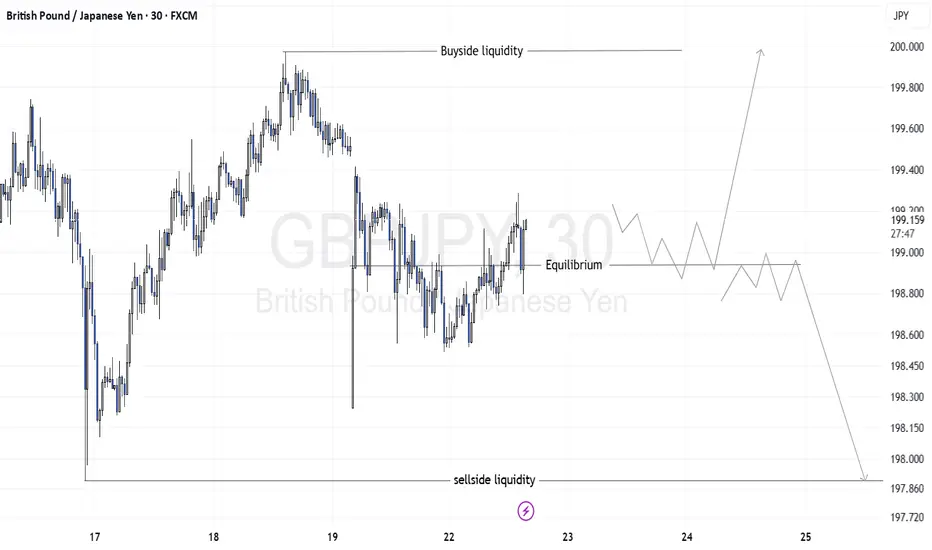
GBPJPY Looking Bullish in the 30 minute Timeframe Since markets are dynamic, I identify both bullish and bearish trading opportunities whenever this strategy appears at equilibrium levels
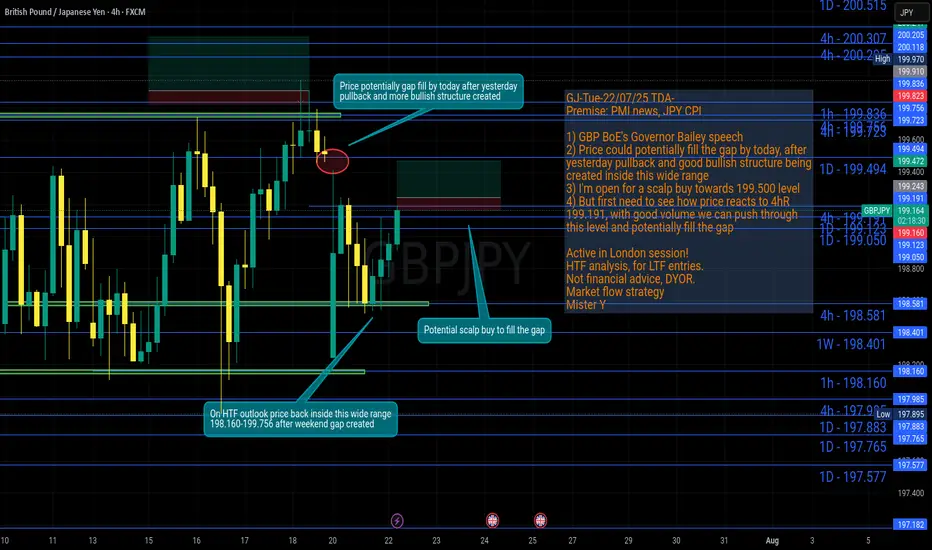
GJ-Tue-22/07/25 TDA-Potential scalp buy to fill the gap!Analysis done directly on the chart!
Weekend gaps in the majority of times (if not all the time) at some point
will be filled.
Premise:
A simple idea plan (like Tradingview public posts) won't describe everything.
No one can predict how market will move, it's always good to react to how it moves.
It gives an idea of how price might move, but no one come from FUTURE.
So I always encourage people to openly and actively discuss in real time.
I don't give signals blindly, people should learn
and understand the skill.
Following blindly signals you won't know how to
manage the trade, where precisely put sl and tp,
lot size and replicate the move over time.
That's why you need active real time discussions.
Trading is not get rich quick scheme!
Active in London session!
Not financial advice, DYOR.
Market Flow Strategy
Mister Y
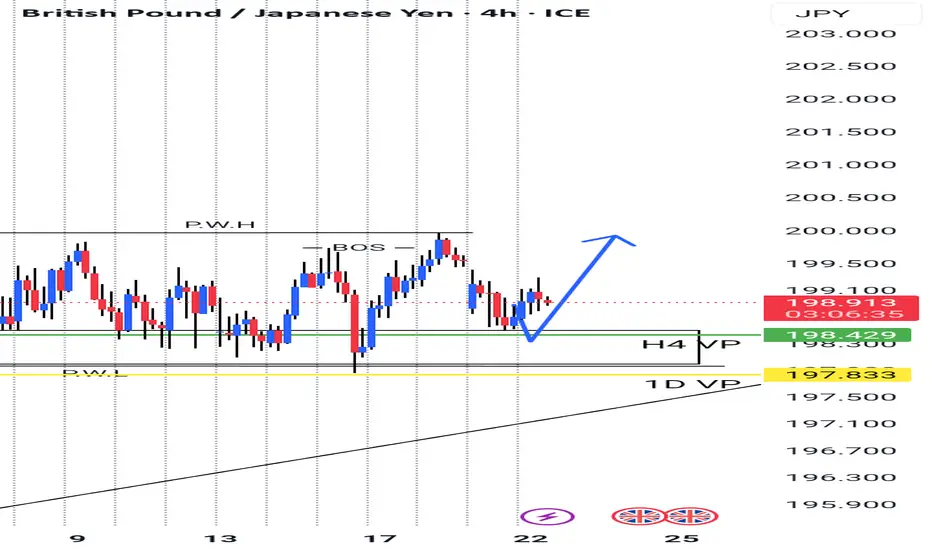
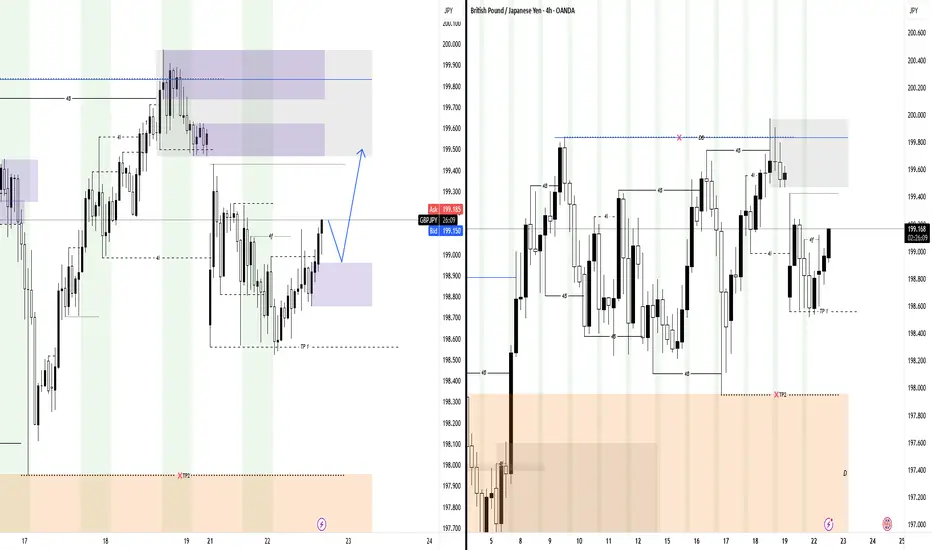
Bullish Shift After Liquidity Sweep – Eyes on BSL & Weekly GapHello Traders,
As per yesterday’s analysis, price successfully swept the weak internal lower low (LL), but failed to close below structure. Instead, price has shifted bullish, indicating that sellers were overpowered by buyers at that level.
Before considering any trading decisions, I would like to see price take out the Buy-Side Liquidity (BSL) to confirm the bullish intent. Additionally, note that the new weekly gap on the 4-hour timeframe remains unfilled, which could act as a magnet for price in the short term.
GBPJPY| - Bullish Opportunity DevelopingPair: GBPJPY (GJ)
Bias: Bullish
HTF Overview: 1H structure remains bullish with clear higher highs. Market currently pulling back toward a visible 1H Order Block.
LTF Confirmation: Waiting for price to mitigate the 1H OB, then will drop to 15M and 5M for bullish confirmation before entering.
Entry Zone: OB zone marked and active — ideal setup includes liquidity grab or inducement before confirming entry shift.
Targets: First target is recent 1H high — extended targets based on continuation structure above.
Mindset Note: No need to force the trade — the edge comes after the zone is respected and price confirms. Let the setup come to you.
Bless Trading!
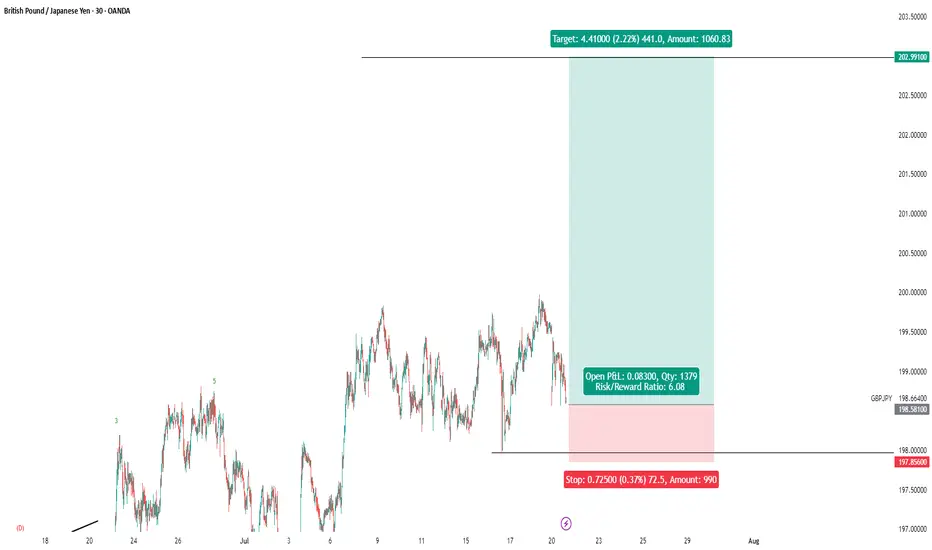
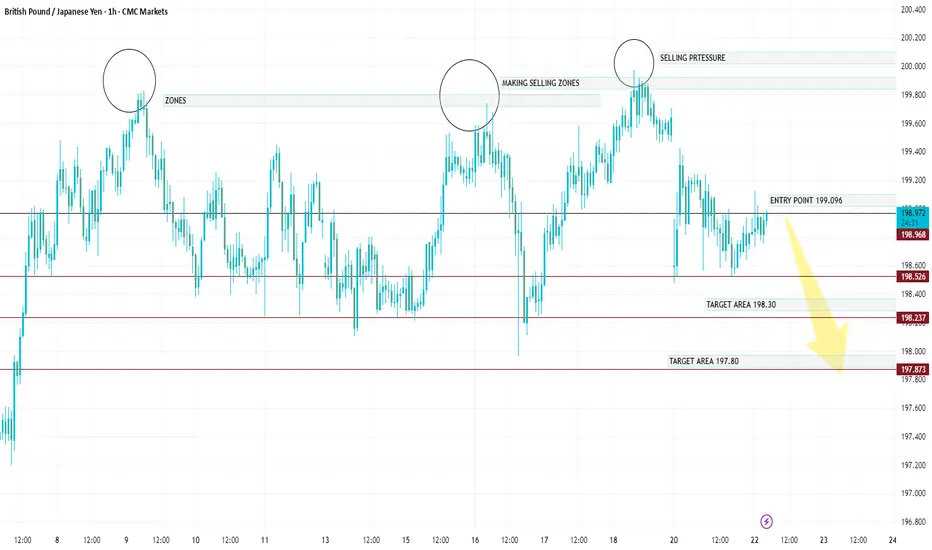
GBP/JPY Trade Analysis – Short Position Entry: 198.953 (currentGBP/JPY Trade Analysis – Short Position
Entry: 198.953 (current market price)
Direction: Sell (Short)
Stop Loss (SL): 199.700
Take Profit (TP) Levels:
TP1: 198.30
TP2: 197.80
TP3: 197.00
Technical Outlook:
GBP/JPY Gap AttackI've written before of the August/September 2008 gap in GBP/JPY and here 17 years later, it continues to show items of interest for intra-day trading strategy.
Most recently, it was the top of that gap at 198.08 holding support on both Monday and Wednesday of last week - allowing for a flare up to just 2.5 pips away from the 200 psychological level. Bulls have shied away from that, for now, but given the way that it happened it could easily be written off as a stretched move stalling before a big figure could come into play.
This also illustrates support potential, especially given the broader move of Yen-strength that's shown so far this week. While USD/JPY is nearing a key Fibonacci level, GBP/JPY can be seen as a more attractive venue for JPY-weakness, especially given the turn that's so far showed in GBP/USD. - js

Gbpjpy buy signal. Don't forget about stop-loss.
Write in the comments all your questions and instruments analysis of which you want to see.
Friends, push the like button, write a comment, and share with your mates - that would be the best THANK YOU.
P.S. I personally will open entry if the price will show it according to my strategy.
Always make your analysis before a trade